Virtual STAR Conference - 23 MARCH 2021 - Datalogic
←
→
Page content transcription
If your browser does not render page correctly, please read the page content below
Virtual STAR
 Conference

   23 MARCH 2021
Disclaimer
This document has been prepared by Datalogic S.p.A. (the "Company") for use during meetings with investors and financial analysts
and is solely for information purposes. The information set out herein has not been verified by an independent audit company.
Neither the Company nor any of its subsidiaries, affiliates, branches, representative offices (the “Group”), as well as any of their
directors, officers, employees, advisers or agents (the “Group Representatives”) accepts any responsibility for/or makes any
representation or warranty, express or implied, as to the accuracy, timeliness or completeness of the information set out herein or
any other related information regarding the Group, whether written, oral or in visual or electronic form, transmitted or made
available.
This document may contain forward-looking statements about the Company and/or the Group based on current expectations and
opinions developed by the Company, as well as based on current plans, estimates, projections and projects of the Group. These
forward-looking statements are subject to significant risks and uncertainties (many of which are outside the control of the Company
and/or the Group) which could cause a material difference between forward-looking information and actual future results.
The information set out in this document is provided as of the date indicated herein. Except as required by applicable laws and
regulations, the Company assumes no obligation to provide updates of any of the aforesaid forward-looking statements.
Under no circumstances shall the Group and/or any of the Group Representatives be held liable (for negligence or otherwise) for any
loss or damage howsoever arising from any use of this document or its contents or otherwise in connection with the document or
the aforesaid forward-looking statements.
This document does not constitute an offer to sell or a solicitation to buy or subscribe to Company shares and neither this entire
document or a portion of it may constitute a recommendation to affect any transaction or to conclude any legal act of any kind
whatsoever.
This document may not be reproduced or distributed, in whole or in part, by any person other than the Company.
By viewing and/or accepting a copy of this document, you agree to be bound by the foregoing limitations.

                                                              2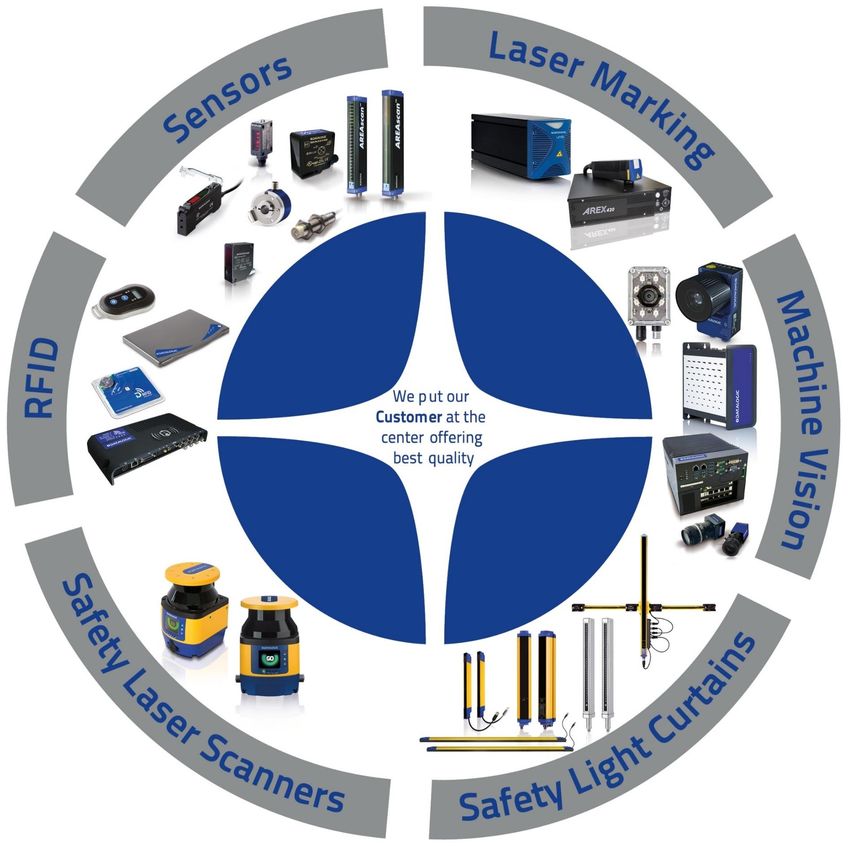
Corporate Overview

              3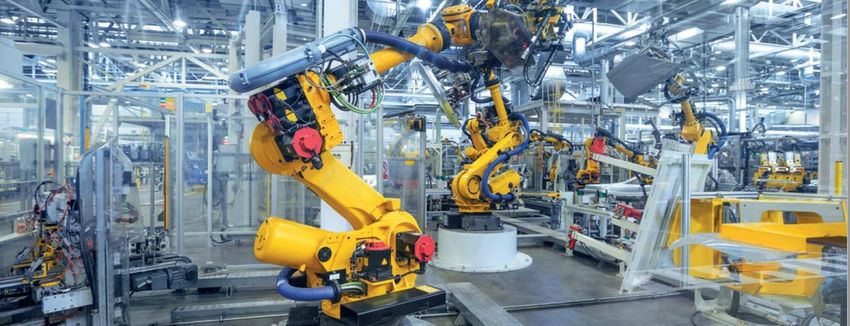
Datalogic at a glance
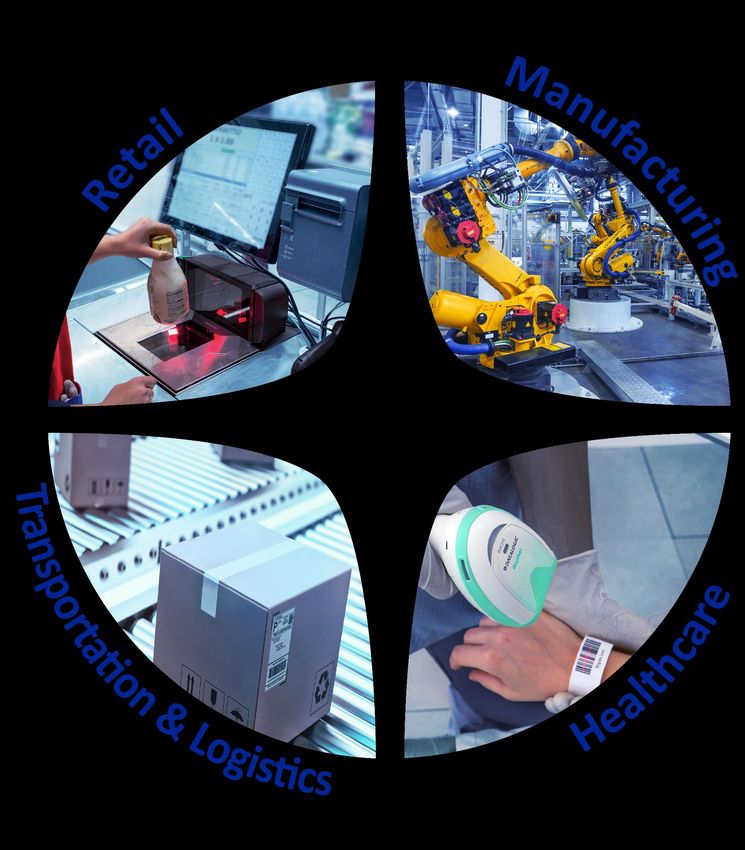
Global technology leader in the automatic data capture and
industrial automation markets, in the Retail, Manufacturing,
Transportation & Logistics, and Healthcare industries
Founded in 1972, listed on the Italian Stock Exchange since 2001
≈ 1,200+ patents filed
> 500 engineers in 11 R&D centers and 3 DL Labs
in: Italy, USA, Vietnam, China, and Germany
2,826 Employees in 28 countries:
18% Americas, 56% EMEAI, 26% APAC
10 Manufacturing and Repair facilities in:
Italy, US, Brasil, Hungary, Slovakia, Vietnam and
Australia
Data refer to YE 2020
4
Core Advantages
                                                             ▪ Worldwide leader in the ADC and IA markets
                         STRONG POSITIONING IN THE           ▪ Balanced presence across markets / segments
    1
                                 INDUSTRY                    ▪ External growth through M&A activities mainly in the IA market

                                                             ▪ Leadership in FRS and SIS
    2                                     INNOVATION         ▪ Focus on technology innovation thru R&D Investment 11-13%
                                                             ▪ 20% of sales from new products*

                                                             ▪ Financial strength positioning for future growth
    3                              SOUND PROSPECTS           ▪ Sound profitability and cash generation
                                                             ▪ Acquisitive in key segments

                                                             ▪ Solid operational efficiency and leverage global industrial footprint
    4                  EFFICIENCY AND PRODUCTIVITY           ▪ High potential from economy of scale
                                                             ▪ Proven cost flexibility

*New Products: products launched in the last 24 months

                                                         5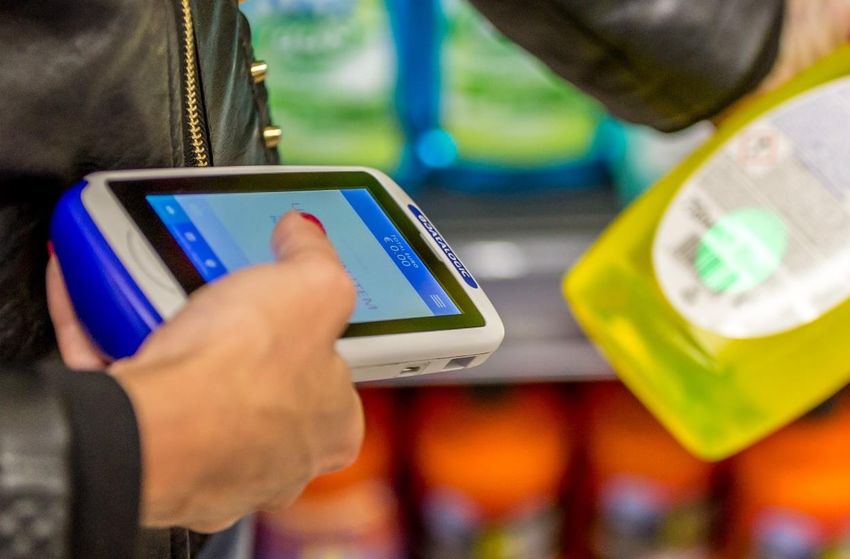
Nearly 50 years of Technological Innovation
                                                                  EXPANSION
                                                              ▪ Minec AB                             NEW STRATEGY
                                                              ▪ Laservall SpA
                                                                                                     ▪ Set up new One
                                                              ▪ Informatics Inc.
                                                                                                       Datalogic
                                                              ▪ PSC Inc
                                  EXPANSION                                                          ▪ New organization
                                                              ▪ Datasensor SpA          2012           by verticals
                                                                                                                                         M&A
                 1972          ▪ Escort Memory      2001      ▪ Evolution Robotic                                         2020         STRATEGY
                                 Systems Inc.                   Retail Inc.
                                                                                        2015         ▪ Acquisition of
                                                                                                       Soredi Touch                    ▪ Acquisition of
                               ▪ IDWare mobile                ▪ Accu-Sort System Inc.
                                                                                                       Systems GmbH                      MD
                                 Computing&Comm.              ▪ PPT Vision Inc.

                                                   LISTING                        INNOVATION                         FOCUS ON
             FOUNDATION
                                             ▪ Listed on the STAR               ▪ Acquisition of                   CORE BUSINESS
            ▪ Established in                                        2002                                                                    2021
              Bologna
                                   1988        segment of the                     Multiware              2017       ▪ Acquisition of
                                   1997        Italian Stock        2011          Photonics SA                        a minority
                                               Exchange                         ▪ Partnership with                    stake in
                                                                                  CAEN RFID Srl                       AWM Smart
                                                                                                                      Shelf
                                                                                                                    ▪ Disposal of
                                                                                                                      85% Solution
                                                                                                                      Net System

                                                      6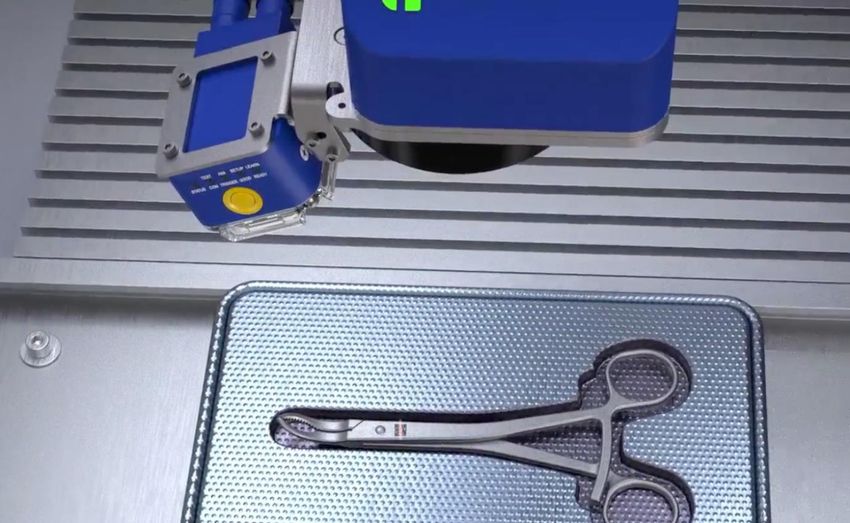
A Wide Geographical Footprint
    10 Manufacturing & Repair sites

    11 R&D Centers, 3 DL Labs

    Direct presence in 28 countries

    Percent on FY 2020 Revenues

                                          EMEAI
                                          53.1%
                        Americas
                         31.5%

                                                  APAC
                                                  15.4%

Data refer to YE 2020
                                      7
Stock and Governance
       Market Segment: STAR MTA                                                                                       Ticker: DAL
       Reuters Code: DAL.MI                                                                                           Price (March 22, 2021): 18.21 Euro
       Bloomberg Code: DAL IM
                                                                                                                      Market Cap (March 22, 2021): 1,070 mln Euro
       Outstanding Shares: 58,446,491
                                                                                                                      Auditing Company: Deloitte
       Share Par-Value: 0.52 Euro each

                 DATALOGIC SHARE PERFORMANCE vs. INDICES                                                                             SHAREHOLDERS’ STRUCTURE

 130
                                                                                                                                       32.2%
 120

 110

 100
                                                                                                                                                                    64.8%
                                                                                                         DAL.MI          Hydra SpA
  90

  80
                                                                                                         FTSEMIB.MI      Treasury Shares
  70
                                                                                                         ITSTAR.MI
                                                                                                                         Free-Float
  60

  50
                                                                                                                                       3.0%
 40
 02/01/2020   02/03/2020   02/05/2020   02/07/2020   02/09/2020   02/11/2020   02/01/2021   02/03/2021

                                                                                                             8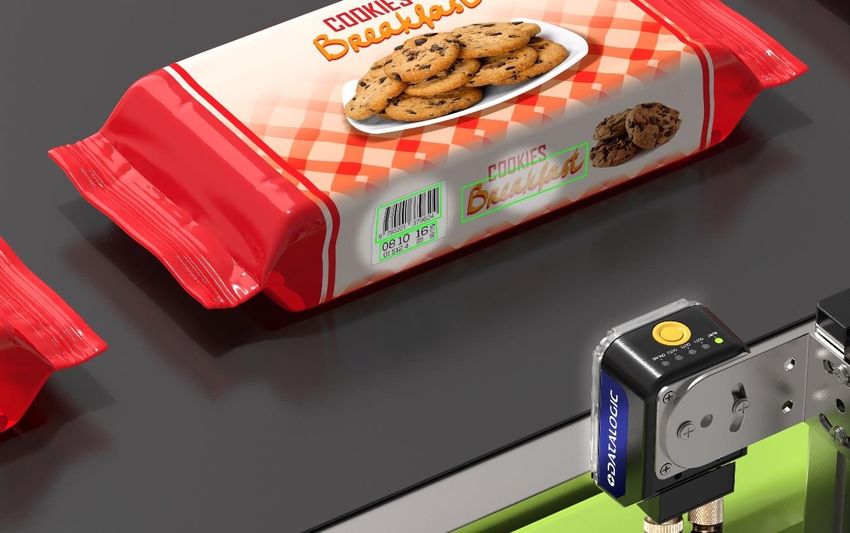
Strategy

           9
Serviceable Available Market
SAM:
~ 13.5 bln USD
Healthcare
4%
Healthcare
T&L
13%
T&L
Retail
Manufacturing
Retail Manufacturing
23% 60%
2020 Leadership position in SIS and FRS
Source market data: VDC 2020,ARC 2020,HEXA 2018,RAIN 2020
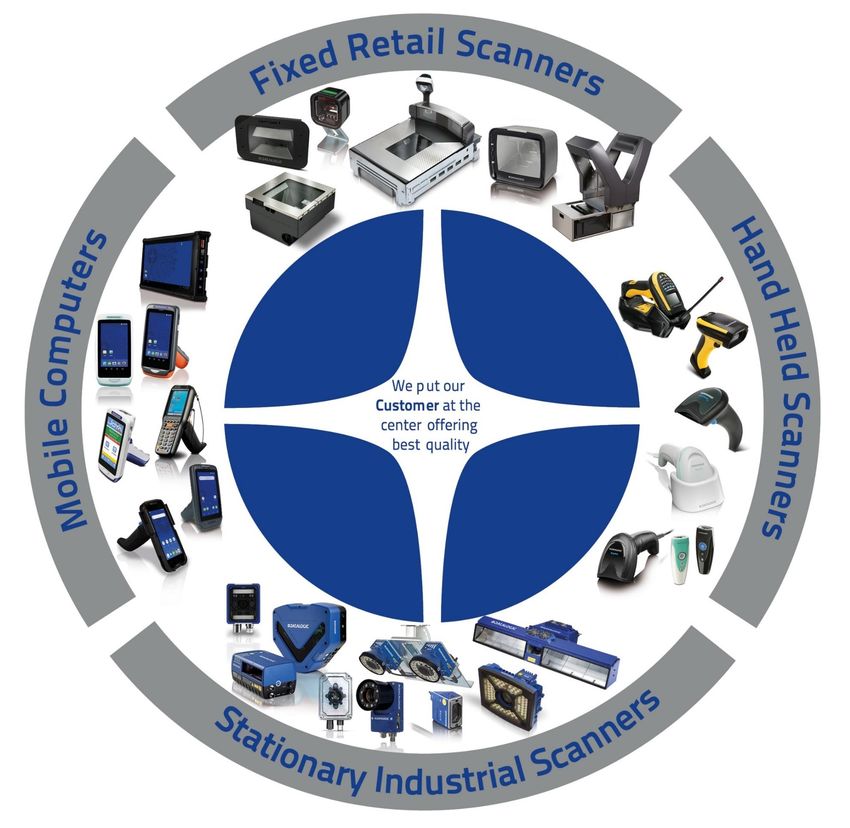
10A wide range of products that is able to fulfill our customers’
needs for both data collection and process automation
Most complete offer of barcode readers: from retail to Complementary/Open doors products in
industrial scanners, from hand held to mobile the MFG Industry
Undisputed leadership on barcode readers
11Our products are key enablers of critical
applications along our customers’ supply chain
Self-Shopping Mark & Read Dimensioning & Weighing
Systems
Complete Traceability Mark & Trace
12Our market by industry
▪ E-commerce, dark stores ▪ Automotive and tire
▪ New physical stores / omni-channel
1 2 ▪ Hybrid/electric cars
▪ Contactless requirements in stores MANUFACTURING is ▪ Agility and lean production pushing
Strong position in
▪ Vision and robotic solutions (AI) a huge market that intralogistics and traceability
RETAIL that we need
we are not yet
to leverage on a global ▪ Continued effort to diversify supply chains
covering at it’s full
basis to avoid disruption in case of local crisis
potential, worldwide
TRANSPORTATION & HEALTHCARE is growing
LOGISTICS is a fast and represents a
▪ E-commerce – micro hubs and booming industry and unique opportunity in ▪ COVID-19 pushing tracking and
micro-fulfilment centers we have a new this «Covid time» digitalization
▪ Robotics and automation offering to leverage
▪ Distribution, storage and injection of
▪ Last mile delivery COVID-19 vaccines
▪ Airports' cargo business
3 4 ▪ Drugs regulations and traceability
13Retail
Food and Self Check-out are the main drivers
Datalogic Proposition
▪ We meet the needs of retailers globally, from the distribution centers, through
check-out, to the customer’s home
▪ Market Leader along the Retail supply chain from 1974 with the first scanner ever
sold to a grocery store in Troy, Ohio
▪ Excellence in productivity and customer experience for self-checkout and attended
lanes for both Grocery and Non-Food with FRS and HHS product portfolio
▪ Artificial Intelligence adoption to be ready for the next checkout POS investment
cycle
Market Outlook
▪ The main international players are experimenting new products and solutions to
satisfy new shoppers’ needs and improve efficiency of their operations: click &
collect, drive & collect, online verification, in real time, of the availability and exact
position within the shelves of the products in the store or in the warehouse,
assisted selling, self scanning and self check-out
▪ Retailers are more and more interested in collecting customers’ data to do analytics
to better serve them
▪ Increase of distribution centers advanced automated logistics solutions to optimize
online shopping and last mile order fulfilment
14Manufacturing
All the thrust of industry 4.0
Datalogic Proposition
▪ Leader in traceability thanks to the most complete and performing offer of
stationary industrial scanners
▪ Unique portfolio provider of smart, interconnected devices able to protect, identify,
sense, check and mark
▪ Datalogic is providing multi-product portfolio to serve all the major manufacturing
clients: Automotive, Food and Beverage, Automated Machinery and Electronics,
Packaging and Intralogistics
Market Outlook
▪ Industry 4.0 is pushing for multi-technology adoption, product interoperability and
enhancement self diagnostic capabilities*
▪ The adoption of key digital technologies shows a strong growth over the next 5 years
▪ Robot and AGV: the Industrial Robotics Market stands at 13.9 billion USD with an
11.8% growth **
▪ Automotive and tire: new segments due to new technology - hybrid and electric
cars
▪ Agility and lean production is pushing intralogistics and traceability
▪ Continued effort to diversify supply chain to avoid disruption in case of local crisis
* Source: IoT Analytics
** Source: International Federal of Robotics (IFR) data and Loup Ventures
15Transportation & Logistics
E-commerce is the market driver
Datalogic Proposition
▪ We ensure Data Collection to Courier-Express-Parcels, Airports and Logistics
▪ Datalogic is at the forefront of the development of airport systems, since 1984
with the first automatic reading station in Milan, to the recent contracts on 4 of
the 5 main airports worldwide (source SkyTrax rating)
▪ Historically leader in stationary industrial scanners, Datalogic provides top
performing solutions for High-Speed sorting to all the main CEPs and 3PLs
▪ Datalogic has a big opportunity to seize in the T&L mobility space, especially with
the new PDT Skorpio X5 and a complete offer o PDAs (Memor family)
Market Outlook
▪ Growth is driven by e-commerce: order fulfillment is the core process, while high
speed sorting and the added ability to manage any size of parcel, is driving the
industry growth.
▪ The omnichannel concept of retailers is evolving towards online orders: dark
stores micro fulfillment and last mile delivery as new relevant applications.
▪ The baggage handling system market is projected to reach pre-covid numbers in
2023-4, cargo applications keep the pace of 3-4% growth Y/Y (*)
▪ Strong demand for solutions beyond barcode, image-based diagnostics and big
data management
▪ Robotics & Automation: higher productivity, zero-defects, less manual operations
*Source: IATA
16Healthcare
Health protection as a top priority
Datalogic Proposition
▪ We empower the entire Healthcare ecosystem from drug production to patient care
▪ Datalogic is the sole company providing unique product features for the HC industry
such as: Anti-microbial enclosures, Inductive charging technology for battery
recharge, and Green spot good match to ensure positive medicine-patient
identification
Market Outlook
▪ COVID-19 pushing tracking and digitalization in particular for the distribution, storage
and injection of COVID-19 vaccines
▪ Drugs regulations and traceability
▪ Hospital investments in patient safety are expected to grow significantly in the next 5
years: technology adoption to secure proper patients traceability and drug
administration
▪ EMR/EHR adoption/expansion in hospitals/clinics (Electronic Medical/Health Record)
▪ Telemedicine/Telehealth. Health systems are more and more using digital health tools
and telehealth platforms to better take care of patients after they leave the hospital
172020 New Product Launches and Innovation
Mobile Computer Fix Retail Scanners Hand Held Scanners Industrial Automation T&L
Manufacturing Sensors
Skorpio X5
DSM004XX HANDSCANNER™
Scan Module
Memor K PowerScan
95X1-AR Smart Vision
JOYA™ Sensor
TOUCH A6 Matrix 120 AGV
WITH Gryphon AV900 Industrial
ANDROID™ 4200 Reader
8.1 OREO Series
MAGELLAN™
Memor 20 Gryphon 4500
1500i OEM
ANTIMICROBIAL
S8 Series IO Link
❑ Vitality Index (New products*/ sales) at 20.0% in line with 20.1% in 2019
❑ R&D spending**, amounted to approximately € 63.0 m, reaching 13.1% as a percentage of Revenues
compared to 10.8% in the 2019
*New Products: products launched in the last 24 months
** Including capitalized R&D
18Key Growth and Strategic Drivers
▪ Keep focus on all of our verticals
▪ MFG ($8 bln): expand into new sectors
Industry ▪ RTL ($ 3 bln): check out evolution, cross sell mobile, watch distribution centers carefully
▪ T&L ($2 bln): cross sell – complete offer SIS, Mobile, HHS
▪ Protect our leadership in SIS
Products ▪ Mobile: increase market share completing and widening our offer of portable data terminal (PDT) and
portable data assistant (PDA)
▪ HHS: lead the shift to 2D technology
M&A ▪ Selected target to accelerate our growth particularly in the manufacturing sector
▪ Continuous improvement of core technology (bar code reading) e.g. optics, decoding
▪ Investing in complimentary technologies:
▪ Vision / Machine learning
Technology ▪ RFID
▪ Digital watermarking
▪ Investing in Android
19M.D. Acquisition
20MD Group
DL Industrial Automation Market MD Products
• Large market $7.7bn
• Industry 4.0 driving solid growth prospect Inductive Sensors Photoelectric Sensors Ultrasonic Sensors
Safety Area Sensors
MD Acquisition MD Geographic Revenue Breakdown
APAC
9.9%
• Group Headquartered in Italy
• € 25M Revenue and €4m Ebitda in 2020 Americas
15.8%
• Complementary Sensors offers for Industrial
Automation applications and Synergetic distribution EMEAI
network 74.3%
21Financials &
Outlook
222020 Highlights: Strong Execution in the downturn
❑ Progressive Top line improvement during the Pandemic Operating costs
from -26.8% in Q2 to -5.4% in Q4. EMEAI and Americas 250.0
217.9
affected. Solid Growth in APAC
200.0 185.8
❑ Strong execution both on tactical and operational 150.0
efficiency delivering Second-Half Adj Ebitda margin back 100.0
to pre-pandemic level at 16.0%
50.0
❑ Protected investment in Innovation with R&D spending* 0.0
FY 2019 FY 2020
at ca. 13.1% and Vitality Index at 20.0%
Ebitda Margin
❑ Cash Generation in Q4 delivering Net Financial Position 18.0%
16.2% 15.9%
positive at 8.2 M€ 16.0%
14.0%
12.0%
❑ Sound signs of rebound starting from Q4 in all 10.0%
10.0%
geographies coupled with leaner cost base preparing 8.0%
5.9%
return to profitable growth 6.0%
4.0%
2.0%
❑ Strengthened position in Industrial Automation with the 0.0%
Q1 2020 Q2 2020 Q3 2020 Q4 2020
acquisition of MD Micro Detectors Group in Q1 2021
* Including capitalized R&D expenses and excluding D&A
23Group Revenues by Segment
FY 2019 Var % % on DL Business Revenues
€m FY 2020
Restated* vs. FY 2019
Channel
Retail 198.3 231.1 (14.2%) 18.2%
Manufacturing 110.7 117.7 (5.9%)
Transportation & Logistics 53.9 74.4 (27.6%) Healthcare
3.7% Retail
Healthcare 17.2 17.7 (2.6%) 42.7%
Channel 84.5 127.3 (33.6%)
T&L
Total DL Business 464.6 568.1 (18.2%) 11.6%
Informatics 16.4 18.7 (12.3%)
Manufacturing
Intra division (1.2) (1.1) 7.4% 23.8%
Total Datalogic 479.8 585.8 (18.1%)
❑ Retail: Decline driven mainly by Americas and base effect from end of major FRS Roll-outs in 2019
❑ Manufacturing: 40.3% growth in APAC. EMEAI and Americas impacted by Covid particularly in Automotive
❑ T&L: Double digit growth in APAC . Tough comparison in Americas due to the conclusion of important multi-year contracts
❑ Healthcare: double digit growth in APAC, slight decrease in EMEAI and North America
❑ Channel: Distributors destocking and small/medium size business decline during the pandemic
* December 31, 2019 comparative data have been restated to reflect the new allocation of Group's revenues to geographic areas and business sectors, as redefined by the “ New Sales
Organization” model launched in 2020 and the classification of Solution Net Systems Inc. as discontinued operation according to IFRS 5.
24Group Revenues by Geography
FY 2019 Var % % on Group Revenues
€m FY 2020
Restated* vs. FY 2019 APAC
15.4%
EMEAI 254.8 307.1 (17.0%)
Americas 151.2 210.1 (28.0%)
APAC 73.8 68.5 7.7%
EMEAI
Total Datalogic 479.8 585.8 (18.1%) 53.1%
Americas
31.5%
❑ EMEAI: performance affected by Covid-19 and phase-out of major Fixed Retail Scanners roll-outs. Signs of recovery in H2, with
Q4 returning to growth driven by Italy achieving +12.4% vs Q4-2019 pre-Covid.
❑ Americas: Most affected market during the pandemic. Restriction to mobility severely affected the development of the
costumer base
❑ APAC: Double digit growth in the second part of the year driven mainly by China in T&L and Manufacturing.
* December 31, 2019 comparative data have been restated to reflect the new allocation of Group's revenues to geographic areas and business sectors, as redefined by the “ New Sales
Organization” model launched in 2020 and the classification of Solution Net Systems Inc. as discontinued operation according to IFRS 5.
25*
FY 2020 P&L
FY 2019 Variance Constant
€m FY 2020
Restated Reported FX ▪ Gross Margin at 45.8%, decrease driven by lower
Revenues 479.8 585.8 (18.1%) (17.0%) volumes and price/mix effects
Gross Margin 219.9 288.1 ▪ Operating expenses at €185.8m down 14.7%
% on Revenues 45.8% 49.2% -3.4 pp
executing cost reduction plans to protect margin:
Operating expenses (185.8) (217.9)
% on Revenues (38.7%) (37.2%) -1.5 pp ✓ Continue investing in R&D (10.8% on revenues vs
Adjusted EBITDA 58.3 92.1 10.0% in 2019)
% Adj. Ebitda margin 12.2% 15.7% -3.5 pp
EBIT ✓ S&D cost decreased by 21.2% due to both tactical
18.4 62.7
% Ebit margin 3.8% 10.7% -6.9 pp savings and efficiencies
Net Result 13.9 50.3 ▪ Adj Ebitda at 12.2% in 2020 on Revenue, reaching
% on Revenues 2.9% 8.6% -5.7 pp
15.9% in Q4 vs 14.5% in Q4-2019 pre-Covid
▪ Net Result at €13.9m consolidating recovery for three
consecutive quarters
* December 31, 2019 economic data were restated following the classification of Solution Net Systems Inc. as discontinued operation as required by the accounting standard IFRS 5.
26*
EBITDA Adj: actual vs last year
€m
92.1
1.9 58.3
29.9
(0.6)
(41.7)
10.5
(16.3)
(17.4)
EBITDA Adj. Volume Price Mix Productivity Structure INFX FX/other EBITDA Adj.
2019 2020
15.7% on Group 12.2% on Group
Revenues Revenues
Positive Items Negative Items
* December 31, 2019 economic data were restated following the classification of Solution Net Systems Inc. as discontinued operation as required by the accounting standard IFRS 5.
27Net Debt & Cash Flow Analysis : Dec’19 – Dec’20
€m
27.3
58.3
(47.2) (3.6)
(7.7)
(6.8)
13.4
8.2
(17.0)
(8.3)
NFP EBITDA Adj. Ch TWC Capex * Taxes Net Financial Purchase Dividend Other NFP
Dec 19 Charges Own Shares Payment Dec 20
Positive Items Negative Items
* Including IFRS 16 impact
282021 Outlook
▪ In this unprecedent context, the Group has promptly reacted this fast-moving scenario implementing aggressive cost
measures to protect business and profit
▪ Encouraging signs of end markets recovery in all geographical areas, corroborated by a significantly improved trend in
order intake versus early 2020. Despite high levels of uncertainty continues, under Covid emergency and shortage of
some components in the short-term, Datalogic expects to see a gradual recovery in 2021 Revenues and an
improvement in the profit margin levels with respect to 2020
▪ In this context, the Group's strategy confirms its focus on innovation and investment in strategic market segments
while consolidating and repositioning its presence in the core markets
29Contact
IR CONTACTS NEXT EVENTS
IR Manager
Laura Bernardelli April 29, 2021
Tel. +39 051 3147109 Shareholders’ Meeting
IR Advisor May 13, 2021
Vincenza Colucci Q1 2021 Results
CDR Communication Srl
Tel. +39 335 6909547
vincenza.colucci@cdr-communication.it
IR Assistant
Daniela Giglioli
Tel. +39 051 3147109
Fax +39 051 3147205 DATALOGIC ON LINE
E-mail daniela.giglioli@datalogic.com
www.datalogic.com
ir@datalogic.com
Via Candini, 2
40012 Lippo di Calderara di Reno
Bologna – Italy
30This presentation contains statements that are neither reported financial results nor other historical
information. These statements are forward-looking statements. These forward-looking statements rely
on a number of assumptions and are subject to a number of risks and uncertainties, many of which are
outside the control of Datalogic S.p.A., that could cause actual results to differ materially from those
expressed in or implied by such statements, such as future market conditions, currency fluctuations, the
behavior of other market participants and the actions of governmental and state regulators
© 2019 Datalogic S.p.A. and/or its affiliates - All rights reserved. • Without limiting the rights under
copyright, no part of this documentation may be reproduced, stored in or introduced into a retrieval
system, or transmitted in any form or by any means, or for any purpose, without the express written
permission of Datalogic S.p.A. and/or its affiliates • Datalogic and the Datalogic logo are registered
trademarks of Datalogic S.p.A. in many countries, including the U.S. and the E.U. • All other trademarks
and brands are property of their respective owners.
Datalogic S.p.A.
Via Candini, 2 - 40012 Lippo di Calderara di Reno - Bologna (Italy)
Tel. +39 051 3147011 | Fax +39 051 3147205
corporate@datalogic.com
ww.datalogic.com
31You can also read