State of the Markets Inside Views on the Health and Productivity of the Global Innovation Economy - Silicon Valley Bank

Page created by Glen Hoffman
 
CONTINUE READING
State of the Markets Inside Views on the Health and Productivity of the Global Innovation Economy - Silicon Valley Bank
State of the Markets
Inside Views on the Health and Productivity
of the Global Innovation Economy
Third Quarter 2018

                                              SPECIAL REPORT:
                                              China’s Tech Growth Strategy
State of the Markets Inside Views on the Health and Productivity of the Global Innovation Economy - Silicon Valley Bank
State of the Markets: Third Quarter 2018

  4   Bull Run: Tech Outswings the Market

  8   Exit Conditions: Dual-Tracks Open

 13   Emerging Sectors: Tech in the Real World

 17   Venture in China: Investment Playbook

 21   Spotlight on Shenzhen: Entrepreneurial Success

 24   Southeast Asia: Expanding Influence

                                                 State of the Markets: Q3’18   2
State of the Markets Inside Views on the Health and Productivity of the Global Innovation Economy - Silicon Valley Bank
State of the Markets: Third Quarter 2018
Tech Titans Dominate

Recent headlines might be all about tariffs, potential trade wars and turmoil, but investors’ appetite for tech
appears unabated. Tech titans continue to lead this bull market and monopolize top slots as the most valuable U.S.
companies. Yet while the IPO window remains open for emerging companies and both strategic and financial
buyers have ample cash on hand for deals, investors and operators would be wise to acknowledge the underlying
risks. The venture economy is not immune to economic downturns, so global growth rates bear watching.

Of course investors’ love affair with tech is not a U.S. phenomenon. This quarter we travel to China, which has
quickly established itself as a leading innovation economy with a proliferation of young unicorns. The “hardware
capital” of Shenzhen offers a fascinating case study, evolving from sleepy fishing village, to low-value
manufacturing, to global tech powerhouse in just a generation. China’s influence is spreading to Southeast Asia by
exporting tech and establishing programs to partner with neighboring countries. The influence of Chinese tech is
not a passing phase, but rather it’s just the beginning.

Bob Blee
Head of Corporate Finance
Silicon Valley Bank

                                                                                            State of the Markets: Q3’18   3
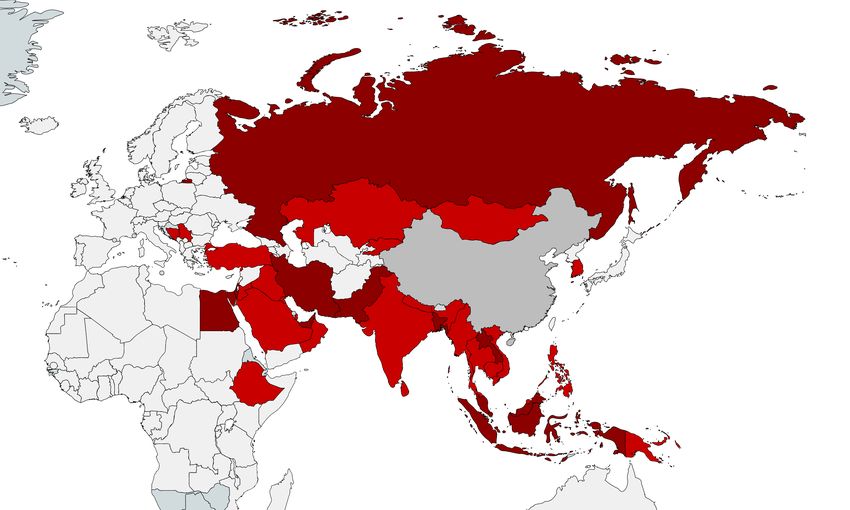
State of the Markets Inside Views on the Health and Productivity of the Global Innovation Economy - Silicon Valley Bank
Bull Run: Tech
Outswings the Market
                       State of the Markets: Q3’18   4
State of the Markets Inside Views on the Health and Productivity of the Global Innovation Economy - Silicon Valley Bank
U.S. Tech Giants Worth More Than Next 10 Companies
A decade of robust consumer and business spending has helped tech lock down the top five slots as
the most valuable U.S. companies. Still, tech is susceptible to larger swings than the overall market.

Top 5 vs. Next 10: Highest Market Cap at 6/30/18             Cumulative Returns for S&P 500 Tech vs. S&P 500

$4.0T       $3.8T                                            350%
                                                                     S&P 500 Information Technology
           #5                                                        S&P 500 Market Index
$3.5T                                                        300%

           #4
                                                     $3.1T
$3.0T                                                        250%

$2.5T                                                        200%
           #3

$2.0T                                                        150%

           #2
$1.5T                                                        100%

$1.0T                                                         50%
           #1
$0.5T                                                          0%
                                                #6
                                                                 1998        2002       2006          2010         2014             2018

$0.0T                                                         -50%
                   1                                   2

          Source: S&P Capital IQ and SVB analysis.                                                    State of the Markets: Q3’18          5
State of the Markets Inside Views on the Health and Productivity of the Global Innovation Economy - Silicon Valley Bank
Could Market Turmoil Spoil the Party for Venture?
Venture capital by its very nature is a riskier asset. The last two bouts of U.S. market turmoil had
a marked effect on investment flows into emerging tech and life sciences companies.

Dot-com Era: Q2’98–Q1’02                                      Financial Crisis: Q4’05–Q3’09                          Current Bull Run: Q3’16–Q2’18
       S&P 500 Index Returns                                          S&P 500 Index Returns                                 S&P 500 Index Returns
50%                                                            50%                                                   50%
40%                                                            40%                                                   40%
30%                                                            30%                                                   30%
20%                                                            20%                                                   20%
10%                                                            10%                                                   10%
 0%                                                             0%                                                    0%
       1           53        105         157        209               1          53         105          157   209          1           53         105         157    209
-10%                                                          -10%                                                   -10%
-20%                                                          -20%                                                   -20%
-30%                                                          -30%                                                   -30%
-40%                                                          -40%                                                   -40%
-50%                                                          -50%                                                   -50%

       U.S. Venture Investment                                        U.S. Venture Investment                               U.S. Venture Investment
$35B                                                          $14B                                                   $35B

$30B                                                          $12B                                                   $30B

$25B                                                          $10B                                                   $25B

$20B                                                           $8B                                                   $20B

$15B                                                           $6B                                                   $15B

$10B                                                           $4B                                                   $10B

 $5B                                                           $2B                                                    $5B

$0B                                                            $0B                                                    $0B
           1 2 3 4 5 6 7 8 9 10 11 12 13 14 15 16                     1 2 3 4 5 6 7 8 9 10 11 12 13 14 15 16                    1 2 3 4 5 6 7 8 9 10 11 12 13 14 15 16

                   Source: PwC/CB Insights MoneyTree, PitchBook/NVCA, S&P Capital IQ and SVB analysis.                                  State of the Markets: Q3’18   6
State of the Markets Inside Views on the Health and Productivity of the Global Innovation Economy - Silicon Valley Bank
Coordinated Global Growth Falls Out of Sync
The U.S. economy is powering global growth after stumbles in Europe and emerging markets in early
2018. To avoid overheating, the Federal Reserve continues to raise rates, and is now out of step with
other major economies. Tech companies, at scale, rely on global growth to substantiate lofty valuations.

Cumulative Equity Market Returns: Q3’17–Q2’18                                              Benchmark Rates for Major Economies: 2006–1H’18

25%                                                                                        7%
      Performance        2H’17                                    Q2’18
      United States1     +12%                                 U.S. +6%
      Emerging Markets2 +17%                                  EM -9%
                                                                                           6%
      Developed Markets3 +9%                                  DM -4%
20%

                                                                                           5%
                                                                                                                                                                                     China4
15%
                                                                                           4%

                                                                                           3%
10%

                                                                                                                                                                                        U.S.5
                                                                                           2%

 5%
                                                                                           1%
                                                                                                                                                                                        U.K.6
                                                                                                                                                                                        E.U.7
 0%                                                                                        0%
         July
  Jul. 2017            Sept.
                 Oct. 2017                Jan.
                                    Jan. 2018              April
                                                     Apr. 2018                                    2006                        2010                         2014                        1H’18
                                                                                                2006
                                                                                                       2007
                                                                                                              2008
                                                                                                                     2009
                                                                                                                             2010
                                                                                                                                    2011
                                                                                                                                           2012
                                                                                                                                                  2013
                                                                                                                                                         2014
                                                                                                                                                                2015
                                                                                                                                                                       2016
                                                                                                                                                                              2017
                                                                                                                                                                                     2018
         2017                             2018
                Notes: 1) OMSCI USA. 2) OMSCI EM. 3) OMSCI EAFE. 4) China 1 Year Benchmark Lending Rates, PBOC.
                5) U.S. Fed Funds Rate. 6) UK Bank of England Official Bank Rate. 7) ECB Main Refinancing Operations Rate.
-5%             Source: S&P Capital IQ, Bloomberg, Federal Reserve Bank of New York and SVB analysis.                                                    State of the Markets: Q3’18           7
State of the Markets Inside Views on the Health and Productivity of the Global Innovation Economy - Silicon Valley Bank
Exit Conditions:
Dual-Tracks Open
                   State of the Markets: Q3’18   8
State of the Markets Inside Views on the Health and Productivity of the Global Innovation Economy - Silicon Valley Bank
IPOs Look More Attractive in 2018
The backlog of companies looking to access liquidity and capital with an IPO found low
valuations to start 2016 and high volatility to start 2018. However, heading into the summer of
2018 both indications appear ripe for public debuts. IPOs are likely to follow.

U.S. Equity Volatility Index (^VIX): 2H’15–1H’18                                              BVP Cloud Index1: Rev. Run Rate Multiple (Median)2
50                                                                                             10.0x

                                                                                                9.0x

40
                                                                                                8.0x

                                                                                                7.0x
30

                                                                                                6.0x
                                              Low Volatility
20
20
                                                                                                5.0x

                                                                                                4.0x
10

                                                                                                3.0x

 0                                                                                              2.0x
       July         Jan.          July         Jan.          July         Jan.
                                                                                                       7/1/2015
                                                                                                            July
                                                                                                                  10/1/2015   1/1/2016
                                                                                                                                  Jan.
                                                                                                                                         4/1/2016   7/1/2016
                                                                                                                                                       July
                                                                                                                                                               10/1/2016   1/1/2017
                                                                                                                                                                             Jan.
                                                                                                                                                                                      4/1/2017   7/1/2017
                                                                                                                                                                                                  July
                                                                                                                                                                                                            10/1/2017   1/1/2018
                                                                                                                                                                                                                        Jan.
                                                                                                                                                                                                                                   4/1/2018
 Jul. 2015
        Oct. 2015
              Jan. 2016
                     Apr. 2016
                            Jul. 2016
                                   Oct. 2016
                                          Jan. 2017
                                                Apr. 2017
                                                       Jul. 2017
                                                              Oct. 2017
                                                                    Jan. 2018
                                                                           Apr. 2018
      2015         2016                      2017                       2018                                2015                  2016                                       2017                                       2018

                   Notes: 1) More information on BVP Cloud Index at: https://www.bvp.com/strategy/cloud-computing/index.
                   2) Revenue run rate = Most Recent Quarter’s Revenue x 4. Valuations based on total enterprise value.
                   Source: Bessemmer Venture Partners, S&P Capital IQ and SVB analysis.                                                                                               State of the Markets: Q3’18                             9
State of the Markets Inside Views on the Health and Productivity of the Global Innovation Economy - Silicon Valley Bank
IPOs Provide Price Discovery for Acquisitions
Strategics have been willing to pay up in 2018. Acquirers are so hungry for tech assets that several
companies in IPO registration have been acquired for healthy premiums before hitting the market.

Notable $1B+ Tech Acquisitions: 2017–1H’18
        Public                                In IPO Registration                                                     Privately Held                                          Legend
$8.0B

                                                                                                                                                                             Valuation at
$7.0B                                                                                                                                                                        Acquisition

$6.0B

                                                                                                                                                                              Last Public
$5.0B                                                                                                                                                                          Valuation

$4.0B

$3.0B                                                                                                                                                                       IPO Valuation

$2.0B

                                                                                                                                                                             Last Private
$1.0B                                                                                                                                                                         Valuation

$0.0B
         MuleSoft                   AppDynamics   iZettle    AppNexus   Adaptive Insights         GitHub     Mobike   Glassdoor    Ring      Musical.ly     PillPack
                                                                                                                                                                               Target
                                                                                                                                                                              Acquirer
        Mar. 2018                  .Jan. 20171 May 2018 June 2018 June 2018                     June 2018 .Apr. 20182 June 2018 Apr. 2018   Dec. 2017 June 2018              Deal Date

                    Notes: 1) AppDynamics was reportedly pricing IPO below last private round.
                    2) Mobike was acquired at a 10% discount to their last private round.
                    Source: PitchBook, S&P Capital IQ, The Wall Street Journal, CNBC and SVB analysis.                                                State of the Markets: Q3’18       10
Continued M&A for Scaled Mid-Market Companies
Beneath the megadeals, financial buyers continue to offer another exit path for companies at
Ample Cash at the Ready for Tech M&A
Capital remains plentiful for traditional acquirers: Private equity firms are nearing all-time highs
for dry powder, and strategics are cash- and equity-rich. As tech moves to disrupt all industries,
note that current S&P 500 constituents have doubled their cash over the last decade.

Net Cash: Financial and Strategic Buyers1                                                                     S&P 5002: Cash and Cash Equivalents: 2008–1H’18
                                        $145B
$140B                                                                                                           $2.5T

$120B
         $107B                                      $109B
                                                                                                               $2.0T

$100B

 $80B                                                                                                           $1.5T

 $60B                                                          $51B
                                                                                                                $1.0T
                                                                            $44B
 $40B

                                                                                                               $0.5T
 $20B

                                                                                        $1B
  $0B
                                                                                                               $0.0T
           Private Equity                   Apple     Google    Microsoft    Facebook   Amazon

        U.S. PE Tech
        Dry Powder3                                                                                                   2008
                                                                                                                  12/31/2007            2010           2012    2014         2016            2018

                            Notes: 1) Net cash for strategic acquirers includes cash and ST & LT investments, net ST & LT debt. No consideration was
                            given to domicile of holdings. 2) Based on constituents of the S&P 500 as of June 30, 2018. 3) Based on dry powder for
                            private equity as of September 30, 2017, multiplied by SVB estimate of amount invested in technology deals.
                            Source: PitchBook and SVB analysis.                                                                                               State of the Markets: Q3’18          12
Emerging Sectors:
Tech in the Real World
                     State of the Markets: Q3’18   13
Shifting Retail Trends Attract Capital
Consumer expectations are shifting, and retail continues to migrate away from brick and mortar.
As e-commerce giants expand their logistics capabilities to cover both domestic and
international markets, startup investors are committing capital to the next generation.

Logistics: Venture Capital Raised and Deal Count                                           Acquisitions & Investments for E-commerce
$800M                                                                                120

                                                                                              Dominance in local         China-based logistics firm      SE Asian e-commerce site
                                                                                                                         Acquired majority stake in      Acquired majority stake in
                                                                                             and regional markets

                                                              Projected Full Year1
                                                                                                                          2017 at $20B valuation           2016 at $2B valuation
$600M                                                                                90

                                                                                                                               Middle Eastern                  Middle Eastern
                                                                                               Helping accelerate             e-commerce site                   logistics firm
                                                                                                int’l expansion         Acq. in July 2017 for $580M      Acq. in Sept. 2017 by Souq
$400M                                                                                60

                                                                                                                            Invested $550M into         Invested $215M into JD.com
                                                                                               “The rival of my..           JD.com in June 2018         for 15% stake in March 2014
$200M                                                                                30        rival is my friend”         Invested in Jet in 2015       Invested in Flipkart in 2017

                                                                                                                       U.S. e-commerce and logistics      Indian e-commerce site
  $0M                                                                                0          Adapting to sales
                                                                                                                          Acquired by Walmart for         Acquired by Walmart for
                                                                                                 moving online               $3.3B in Aug. 2016             $20B in April 2018
        2012           2014               2016               1H'18

           Note: 1) Based on annualized 1H’18 total.
           Source: PitchBook, TechCrunch, The Wall Street Journal, Reuters, CNBC, company websites and SVB analysis.                          State of the Markets: Q3’18             14
Tech Venturing into Healthcare
Healthcare is a massive yet inefficient marketplace ripe for innovation and investment. But
tackling healthcare challenges is no easy task. Data-rich use cases for AI/ML in diagnostics and
genomics are drawing substantial interest.

Most Active Generalist Investors1 in U.S. Healthcare: 2H’13–1H’18                                                              Notable Efforts from Tech Giants
           Total    Deals
         Deal Value 0                   25                50                 75               100               125

           $5.0B
               NEA

                                                                                                                                        Online pharmacy          Announced partnership
            $2.5B
        Polaris Partners
                                                                                                                                    delivery startup acquired    in Jan. 2018 to combat
                                                                                                                                     for $1.0B in June 2018      rising healthcare costs
           $3.6BGV

            $1.8B
        Canaan Partners

            $3.2B
              Venrock

                                                                                                                                   Biotech R&D subsidiary        Life sciences subsidiary
            $2.1B
         Kleiner Perkins                                                                                                         in partnership with AbbVie      utilizing data to improve
                                                                                                                                    focused on longevity        patient care and outcomes

            $1.6B
               Khosla

            $1.2B
         Founders Fund

                                                                                                                               China Invts.

                                                                                                                                                                                      U.S. Invts.
           $0.5B
         Data Collective

           $2.0B
             Sequoia

             Note: 1) Includes venture firms where less than one-third of deals over the past five years were in healthcare.
             Source: PitchBook, The Wall Street Journal, company websites and SVB analysis.                                                            State of the Markets: Q3’18          15
AI+: Vertical Applications of Artificial Intelligence
The future is out of the lab and into our lives, improving everything from portfolio returns to
human lifespans. The percentage of startups using AI has climbed in nearly every category.

AI + Cybersecurity                                    AI + Digital Health                             AI + Fintech
100                                             25%   100                                       25%   100                                           25%
      U.S. Venture Deals                                    U.S. Venture Deals                              U.S. Venture Deals
      % of all Cybersecurity Deals                          % of all Digital Health Deals                   % of all Fintech Deals

80                                              20%   80                                        20%    80                                           20%

60                                              15%   60                                        15%    60                                           15%

40                                              10%   40                                        10%    40                                           10%

 20                                             5%     20                                       5%     20                                           5%

 0                                              0%     0                                        0%      0                                           0%
      2012      2014       2016        1H'18                2012     2014     2016      1H'18               2012      2014       2016       1H'18

  Most Well-Funded U.S. Startups: June 2018            Most Well-Funded U.S. Startups: June 2018       Most Well-Funded U.S. Startups: June 2018

       $481M           $330M            $297M               $500M           $237M           $55M            $1,357M          $718M           $439M

                Source: PitchBook and SVB analysis.                                                                   State of the Markets: Q3’18    16
Venture in China:
Investment Playbook
                      State of the Markets: Q3’18   17
A Younger Herd of Unicorns in China
China has quickly established itself as a Top Two venture market. In China, the ratio of younger
(10 years) is 1-to-1. In the U.S., that ratio is 1-to-4. This speaks to
how rapidly companies can reach an astronomical scale in this dynamic emerging market.

Distribution of Current Unicorns by Age as of June 2018: China vs. U.S.
Age        China Total:                                                                             U.S. Total:
20+
               72                                                                                       113
18
16
14
12
10
                                                                             Median: 9
 8
 6                                                               Median: 6

 4
 2
 0
      15                     10                          5               0               5   10                         15
                                                                       Count

              Source: CB Insights, PitchBook and SVB analysis.                                    State of the Markets: Q3’18   18
The Long Reach of China’s BATJ
China’s internet giants are a dominant presence in the venture ecosystem. More than two-thirds
of China’s current unicorns with $5B+ valuations have received investment from at least one of
the BATJ. And now, Alibaba and Tencent may look to invest even earlier in companies’ life cycles.

BATJ and $5B+ China Unicorns
  Valuation Band1
$250B+ .

                                                                                                                                                                   Unaffiliated
$50–$250B
$20–$50B
$10–$20B

                                                                                                                      Pinduoduo
                                                                                                                                                                  Jiedaibao

                                                                                                                           Legend       Own/Acquired
$5–$10B

                                                                                                                                            Invested

                Note: 1) Valuations based on market cap (Baidu, Alibaba, Tencent and JD.com) or most recent private round as of June 30, 2018.
                Source: China Money Network, S&P Capital IQ, PitchBook, TechCrunch, company websites and SVB analysis.                            State of the Markets: Q3’18   19
IPOs: How China’s Companies Decide Where to List
Scaled companies in China face an international decision when it comes time to list and must
consider access to capital, liquidity and regulatory constraints. Six of China’s last eight $1B+ tech
IPOs chose exchanges in the U.S. and Hong Kong. Officials would like to see more list domestically.

China Tech IPO Gross Proceeds by Exchange: Capital Raised in $100M+ IPOs
                                                           $22B
$6.0B

$5.0B

                                                           Alibaba

                                                                                            CRSC
$4.0B

                                                                                                                                                                           FII Foxconn
                                                                                                                                    ZhongAn

                                                                                                                                                                  Xiaomi
$3.0B
                                                                            Guosen

                                                                                            Legend

                                                                                                                                                         iQIYI
$2.0B
                                                           JD.com

$1.0B

$0.0B
        U.S.   H.K. China         U.S.   H.K. China        U.S.      H.K. China      U.S.   H.K. China   U.S.   H.K. China   U.S.   H.K. China           U.S.    H.K. China
               2012                      2013                        2014                   2015                2016                2017                         1H'18
               2012                      2013                        2014                   2015                2016                2017                         1H’18

                Source: S&P Capital IQ and SVB analysis.                                                                                State of the Markets: Q3’18                  20
Spotlight on Shenzhen:
Entrepreneurial Success
                     State of the Markets: Q3’18   21
Shenzhen: Economic Experiment Yields Results
In the span of a generation, Shenzhen has climbed from a fishing village to a global tech powerhouse.
Deliberate structural planning and talent acquisition efforts, coupled with world-class hardware
manufacturing, have equipped a generation of market-oriented companies to compete globally.

City Population, Milestones and Company Formations: 1970–Today                                                        Shenzhen’s Tech Giants
                                                                                        Shenzhen
                                                                                                                                 Telecom equipment developer,
                                                                                                                                 manufacturer and distributor
12.0M
                                                                                                                                 Market Cap: Privately Held
                                                                                                                                 2017 Total Revenue: $92.5B

10.0M

                                                                                    New York City                                Internet social and gaming platform;
                                                                                                                                 e.g. owns WeChat (1B+ MAU)
8.0M                                                                                                                             Market Cap (6/30/18): $473.5B
                                                                                                                                 2017 Total Revenue: $36.5B

6.0M                                   Shenzhen Stock                    Launches int’l recruitment
                                       Exchange opens.                   effort, the “Peacock Plan.”
                                                                                                                                 Consumer aerial drone and camera
                                                                                                                                 developer and manufacturer
                 Designated China’s first
                 Special Economic Zone.                                                                                          Market Cap (6/30/18): $15B1
4.0M
                                                                                                                                 2017 Total Revenue: Unknown
        Small fishing community
        with 2000-year history.
 2.0M                                                                                                                            Telecom equipment and other
                                                                                                                                 information technology provider

                                                                                                                                 Market Cap (6/30/18): $7.9B
0.0M                                                                                                                             2017 Total Revenue: $16.7B
        1970            1980                1990         2000              2010              Today

          Note: 1) Based on current fundraising efforts as of April 2018.
          Source: South China Morning Post, S&P Capital IQ, China Money Network, company websites and SVB analysis.              State of the Markets: Q3’18        22
Market-Oriented Approach Spurs Innovation
Shenzhen’s short history means little presence from incumbent state-owned enterprises. Instead,
special economic incentives attracted entrepreneurs, and free market forces drove them to be
innovators. Shenzhen-based companies now hold the top two spots in global patent applications.

China’s Centrally Controlled                                PCT Applications2 by City:                                      PCT Applications2 by Company:
State-Owned Enterprises by City1                            Percentage of China Total3                                      Top 5 & Shenzhen Cos. in Top 1004

75%                                                          75%
                                                                                                                                   Rank           Company                 PCT Apps.

                                                                                                                                      1           Huawei                    4,204.
60%                                                         60%                                                                       2           ZTE                       2,965.
                                                                                                                                      3           Intel                         2,637.
45%                                                          45%                                                                      4           Mitsubishi                    2,521.
                                                                                                                                      5           Qualcomm                      2,163.

30%                                                          30%
                                                                                                                                     18           Shenzhen CSOT                  972.
                                                                                                                                     32           Tencent                        560.
15%                                                          15%
                                                                                                                                     34           Yulong                         517.
                                                                                                                                     85           DJI Technology                 238.
0%                                                            0%
      Beijing
        BJ        Shanghai
                     SH    Shenzhen
                              SZ            Other
                                            Other                      Beijing
                                                                         BJ       Shanghai
                                                                                     SH    Shenzhen
                                                                                              SZ             Other
                                                                                                               O

                Notes: 1) Based on list of 96 companies under the supervision of the State-owned Assets Supervision and Administration Commission
                (SASAC). 2) PCT Applications are applications filed under the Patent Cooperation Treaty. 3) Data as of 2016. 4) Data as of 2017.
                Source: State-owned Assets Supervision and Administration Commission website, World Intellectual Property Organization,
                The Economist analysis of WIPO and SIPO data, company websites and SVB analysis.                                                  State of the Markets: Q3’18        23
Southeast Asia:
Expanding Influence
                      State of the Markets: Q3’18   24
China Sees Itself in Southeast Asia
Today, China is looking to Southeast Asia as their engine of economic growth. With double-digit
growth for a user base that’s already larger than the U.S., China’s tech is finding opportunities to
go international.

Gross Domestic Product: 2000–2017                                                        Internet Users (IU) and YoY Growth Rates: Jan. 2018
Finding Familiar Investments in Southeast Asia
The market opportunities in Southeast Asia bear a strong resemblance to those in China a decade
ago. This reflects the influence of strategic capital from China’s corporate giants and prominent
investors. Often, the focus is expanding services to an upgrading consumer class.

Notable SE Asian Companies with Significant Investment from China Companies and Venture Firms

              Sea                                             Grab                                            GO-Jek                            Lazada
 Headquarters: Singapore                       Headquarters: Singapore                          Headquarters: Jakarta                Headquarters: Singapore
 Valuation: $5.0B                              Valuation: $10.0B                                Valuation: $5.0B                     Valuation: $2.0B
 Publicly Traded on NYSE                       Series H in June 2018                            Series E in Feb. 2018                Acquisition in April 2016
 China-Based Investors:                        China-Based Investors:                           China-Based Investors:               China-Based Acquirer:

 Business Line Expansion:                      Business Line Expansion:                         Business Line Expansion:             Business Line Expansion1:
                                                   Ride                                          Motorcycle
   Gaming   E-commerce    Payments                            Payments       Grocery                           Delivery   Payments   E-commerce   Logistics?    Payments?
                                                  Hailing                                         Hailing

         Traveloka                                          Tokopedia                                     The Redwood Group                       Bigo
 China Investors:                             China Investor:                                   China Investor:                      China Investor:
 HQ: Jakarta                                  HQ: Jakarta                                       HQ: Singapore                        HQ: Singapore
 Travel Search Engine                         E-commerce Marketplace                            Logistics Real Estate Services       Online Video Broadcasting
 Valuation: $1.0B in July 2017                Investment: $1.1B in Aug. 2017                    Investment: $306M in May 2018        Investment: $272M in June 2018

               Note: 1) Potential expansion efforts for Lazada operations under the control of Alibaba.
               Source: S&P Capital IQ, PitchBook, Reuters, Forbes, TechCrunch and SVB analysis.                                         State of the Markets: Q3’18     26
Developing Pathways to New Market Opportunities
To ensure growth beyond opportunities in Southeast Asia, China is laying the groundwork to be a
more prominent regional player. The Belt and Road Initiative will establish modern trade routes for
goods from China to reach future generations of consumers in Southeast Asia and beyond.

Belt and Road Initiative Infrastructure and Construction Investment by Country: Oct. 2013–June 2018

Legend:   $10B+
           $2B+

                                                                      $24B
                                                                  Russia
                                                                                               $8B
                                                                                         Kazakhstan

                                                                      $8B
                                               $12B                Iraq           $13B         $40B
                                            Israel
                               $6B                                            Iran        Pakistan                                                             $9B
                           Kuwait
                                                                                                                                                                                Total to Date:
                                                                                                                                                        S. Korea
                                     $17B

                                                                                                                                                                                     $420B
                                                                                                                                                $18B
                                Egypt
                                                                                                                                             Laos
                                                     $9B
                                                                                                                                                     $7B
                                             Saudi Arabia
                                                                                                                                             Vietnam
                                                                                                                                                                   $7B
                                                            $9B            $18B          $9B
                                                                                                                                                           Philippines
                                                     Ethiopia                                              $21B
                                                                     UAE             India
                                                                                                      Bangladesh            $7B                         $31B
                                                                                               $9B                                                  Malaysia
                                                                                                                   $7B Cambodia
                                                                                         Sri Lanka
                                                                                                            Thailand              $28B        $25B
                                                                                                                           Singapore     Indonesia

           Source: China Global Investment Tracker, with data compiled by The American Enterprise Institute
           and The Heritage Foundation and SVB analysis.                                                                                                                 State of the Markets: Q3’18   27
Appendix
           State of the Markets: Q3’18   28
Report Authors

                          Bob Blee                                                          Steven Pipp, CFA
                          Head of Corporate Finance                                         VP, Research
                          bblee@svb.com                                                     spipp@svb.com

Bob Blee heads Silicon Valley Bank’s Corporate Finance Group,      Steven Pipp is a Vice President, Research, based in San Francisco,
which leads SVB's relationships with public and late stage         CA, responsible for capital markets research and data-driven analysis
private companies in the Innovation sector throughout North        of the innovation economies that SVB serves globally.
America, providing a full suite of lending and banking products,
as well as guidance as a trusted partner helping our clients       Prior to his research role, Steven managed advisory and valuation
succeed and quickly scale.                                         engagements for venture-backed technology companies as part of
                                                                   SVB Analytics. Before joining SVB, Steven worked in Minneapolis,
Previously, Bob held a variety of roles in SVB’s California and    MN, as a consultant and entrepreneur in clean energy technology.
Midwest geographies, including heading seed, early and mid-
stage Infrastructure, Hardware, Consumer Internet and Fintech      Steven earned a Master of Science in Finance from Boston College and
banking in the Bay Area and Southern California, as well as        a Bachelor of Science Business from the University of Minnesota. In
responsibility for SVB’s Mezzanine Lending and Loan                addition, he holds the Chartered Financial Analyst (CFA) designation.
Syndications practices.

Bob sits on the nonprofit board of the Network for Teaching
Entrepreneurship (NFTE) and the Silicon Valley Advisory
Council of the Commonwealth Club. He is also active with his
alma mater, the University of Illinois.

                                                                                                          State of the Markets: Q3’18   29
About Silicon Valley Bank
For more than 35 years, Silicon Valley Bank has helped innovative
companies and their investors move bold ideas forward, fast. SVB
provides targeted financial services and expertise through its
offices in innovation centers around the world. With commercial,
international and private banking services, SVB helps address the
unique needs of innovators.

This material including, without limitation, to the statistical information herein, is provided for informational purposes only. The material is based in part on information from third-party
sources that we believe to be reliable but which have not been independently verified by us, and for this reason, we do not represent that the information is accurate or complete. The
information should not be viewed as tax, investment, legal or other advice, nor is it to be relied on in making an investment or other decision. You should obtain relevant and specific
professional advice before making any investment decision. Nothing relating to the material should be construed as a solicitation, offer or recommendation to acquire or dispose of any
investment or to engage in any other transaction.
Silicon Valley Bank is registered in England and Wales at Alphabeta, 14-18 Finsbury Square, London EC2A 1BR, UK under No. FC029579. Silicon Valley Bank is authorised and regulated by
the California Department of Business Oversight and the United States Federal Reserve Bank; authorised by the Prudential Regulation Authority with number 577295; and subject to
regulation by the Financial Conduct Authority and limited regulation by the Prudential Regulation Authority. Details about the extent of our regulation by the Prudential Regulation
Authority are available from us on request.
Silicon Valley Bank is not authorized to undertake regulated activity in Canada and provides banking services from its regulated entities in the United States and the United Kingdom.
© 2018 SVB Financial Group. All rights reserved. SVB, SVB FINANCIAL GROUP, SILICON VALLEY BANK, MAKE NEXT HAPPEN NOW and the chevron device are trademarks of SVB Financial
Group, used under license. Silicon Valley Bank is a member of the FDIC and the Federal Reserve System. Silicon Valley Bank is the California bank subsidiary of SVB Financial Group
(Nasdaq: SIVB).
You can also read