Globalization Report 2020 - How do developing countries and emerging markets perform? - Bertelsmann Stiftung
←
→
Page content transcription
If your browser does not render page correctly, please read the page content below

Globalization Report 2020 –
How do developing countries and
  emerging markets perform?

Globalization Report 2020 –
How do developing countries and emerg-
        ing markets perform?

           Thieß Petersen and Hauke Hartmann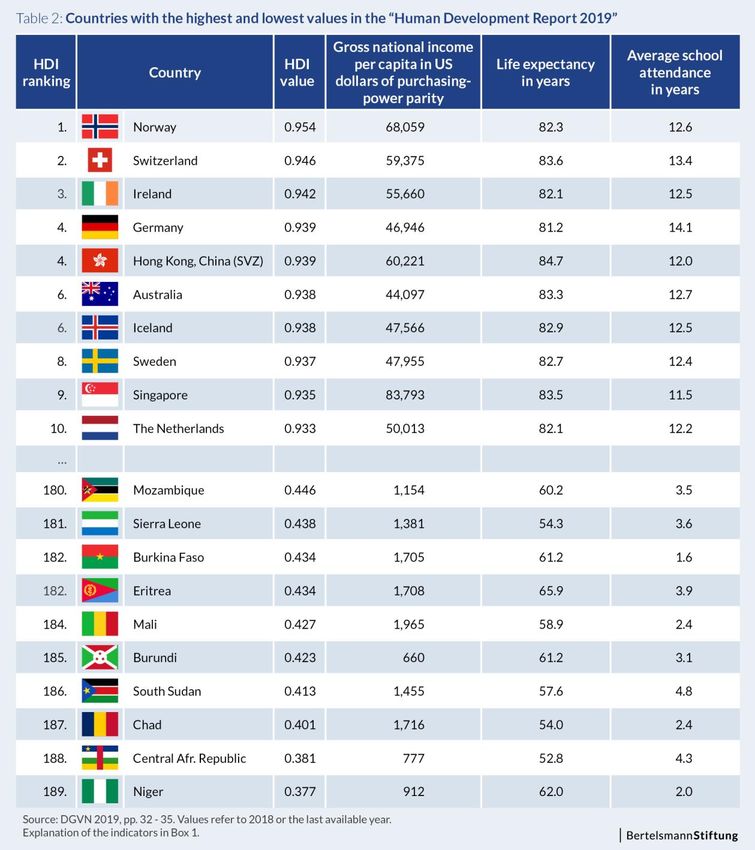
Globalization Report 2020 – How do developing countries and emerging markets perform? | Page 3

Contents
1      Introduction ...................................................................................................... 4

2      Globalization development between 1990 and 2018 .................................... 4

3      Globalization, growth, and prosperity ........................................................... 9

4      Empirical research on the connection between globalization and
       GDP growth .................................................................................................... 13

5      Development of absolute differences in real GDP per capita
       between industrialized countries and emerging markets ......................... 16

6      Globalization and the developing countries ............................................... 19

7      Implications for economic policy ................................................................. 21

Literature ................................................................................................................ 22
Page 4 | Globalization Report 2020 – How do developing countries and emerging markets perform?

    1 Introduction
    Every two years, the Globalization Report examines how well individual countries have benefited from the pro-
    gressing globalization since 1990. The influence of changes of the respective degree of globalization on the real
    gross domestic product per capita of the country is calculated for 45 industrialized countries and emerging
    markets. 22 of the countries considered in the “Globalization Report 2020” are also assessed by the Bertelsmann
    Stiftung’s Transformation Index (BTI).

    The reports published since 2014 reflect that the emerging markets examined show the smallest increases in real
    gross domestic product (hereinafter: GDP) as a result of globalization in absolute figures (i.e. calculated in euros).
    These countries achieve some of the highest globalization-induced gains, however, if the same GDP gains are
    placed in relation to the GDP per capita in 1990 – the first year of the examination period. For the emerging mar-
    kets, the advancing globalization is, therefore, a way to increase material prosperity. At the same time, however,
    the real GDP per capita between emerging markets and developed countries continues to diverge between 1990
    and 2018.

    For reasons of data availability, the developing countries are not included in the Globalization Report. However,
    a look at other sources shows that the degree of globalization in these countries is very low and generally still be-
    low that of most emerging markets. Their real GDP per capita is also lower than that of the emerging markets,
    which means that only small increases in GDP induced by globalization are possible. The gap between develop-
    ing countries and highly developed economies in terms of real GDP per capita is growing not only in absolute, but
    also in relative terms.

    2 Globalization development between 1990 and 2018
    The “Globalization Report 2020” covers the world’s 45 most important industrialized countries and emerging mar-
    kets. The countries of Indonesia, Luxembourg, and Nigeria are included in the study for the first time. 22 of the
    countries analyzed also are included in the BTI. They comprise eleven Eastern European countries and eleven
    countries from other regions (Tab. 1).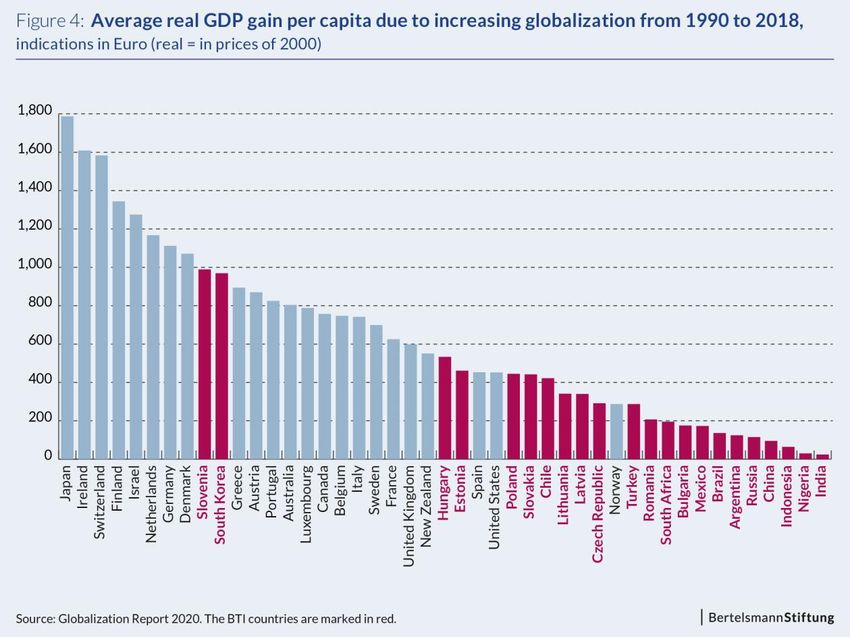
Globalization Report 2020 – How do developing countries and emerging markets perform? | Page 5

The scope of a country’s integration with the rest of the world is measured by an index that is very closely aligned
with the established KOF Globalization Index of the Eidgenössische Technische Hochschule Zürich (Dreher
2006). It includes indicators of economic integration (e.g. data on border-crossing trade in goods and services,
trade barriers, and capital controls), social globalization (e.g. international tourism, degree of distribution of infor-
mation and ideas, and share of the foreign population in the total population), and indicators on the political
integration of a country in the world (e.g. data on membership in international organizations, foreign embassies,
and international treaties). Since the economic effects of globalization are at the focus of the Globalization Re-
ports, economic globalization makes up 60 percent of the globalization index. The other two aspects contribute to
the index at 20 percent each (for further methodological details: Bertelsmann Stiftung 2020).

The period under observation in the “Globalization Report 2020” is from 1990 to 2018. The data available from
this allow for the development of a Globalization Index for each country and year. Index values can range from 0
Page 6 | Globalization Report 2020 – How do developing countries and emerging markets perform?

    to 100. The higher the index value, the greater the integration of the respective country with the rest of the world.
    Three basic trends can be found when globalization is measured in this manner (Fig. 1):

    •   Small, highly developed economies such as the Netherlands, Ireland, Belgium, Switzerland, and Luxembourg
         show the highest degree of globalization. This is caused, among other things, by the small internal markets of
         these countries. As a consequence, cross-border trade is more important for them than for larger countries.
    •   Industrialized nations with large domestic markets, such as Germany, Japan, and the USA, only achieve aver-
         age values in the Globalization Index.
    •   Emerging markets such as China, India, Argentina, Brazil, and Nigeria have the lowest index values of all
         45 countries. Economic restrictions such as capital controls and trade restrictions are one reason for this. In
         addition, the economic indicators considered are set in relation to the country’s GDP for the sake of interna-
         tional comparison. For example, export champion China is one of the lowest-ranking countries in terms of
         exports in relation to GDP – just like the USA.

    The countries marked in red in figure 1 are also assessed by the BTI. With the exception of a few Eastern Euro-
    pean countries, the BTI countries show the lowest degree of international integration in the Globalization
    Report. These countries still have considerable potential to increase their economic, social, and political globali-
    zation.

    The “Transformation Index BTI 2020” essentially confirms this trend as far as the liberalization of foreign trade
    and increase of global economic ties are concerned. Accordingly, most countries with a large domestic market as
    in Argentina, Brazil, India, Indonesia, and Nigeria score less than eight points on a scale of ten in this indicator.
    The maximum value of ten points is reached mainly by the East-Central European EU members, as well as by
    Mexico, which is part of the North American Free Trade Agreement NAFTA, and Chile, which is characterized by
    economic liberalism.
Globalization Report 2020 – How do developing countries and emerging markets perform? | Page 7

However, the countries are ranked somewhat differently in the BTI for political globalization, which is weighted
lower in the Globalization Report. Based on the criterion of “international cooperation”, the Transformation Index
assesses the extent to which developing and transformation countries can benefit from external support to imple-
ment their own development agendas, how credibly and reliably their governments act on the international stage
(e.g., in complying with international treaties), and how strongly political decision-makers strive for regional coop-
eration. Unsurprisingly, the autocracies of China, Russia, and Turkey are ascribed little credibility and regional
willingness to cooperate. Democracies with strong authoritarian tendencies and corrupt networks, such as those
in Hungary, Nigeria, and Romania, also receive poor ratings. Looking only at willingness to cooperate internation-
ally (which is a subordinate aspect in the Globalization Report), Chile and Estonia significantly outperform
Hungary and Romania, as they show a strong political openness and achieve the full scores in all three indicators
named, just as in liberalization of foreign trade.

A look at the changes of international integration of the 45 countries with the rest of the world from 1990 to 2018
shows that the BTI countries were able to achieve above-average globalization growth (Fig. 2). A comparison of
the degree of international integration measured by the Globalization Index from 1990 to 2018 shows that the
greatest increases among all 45 countries were found in eight Eastern European countries. The strongest
growth was observed in Romania. The Globalization Index value there rose from 22.7 points in 1990 to
59.9 points in 2018. This increase by more than 37 points clearly exceeds the Globalization Index median (the
index value of the country that ranks 23rd in each case and is, therefore, in the middle of the ranking of all
45 countries), which gained around 21 points (from around 42 to around 63 points) in the period. However, the
BTI also regards Romania as an illustrative example that increased international integration will not necessarily
increase openness or willingness to cooperate. The country’s degree of globalization certainly is much higher to-
day than it was in the largely isolated Romania under head of state Nicolae Ceaușescu in the late 1980s (in
particular due to political and economic reforms after the dictator’s fall and during the EU accession process).
However, Romania’s willingness to cooperate internationally has declined significantly in the last decade, with
only Brazil, Hungary, and Turkey losing a similar amount of willingness to cooperate internationally among the 22
BTI countries examined here. Only Hungary, Turkey, and Russia have shown an even more confrontational and
unreliable behavior. The report on Romania of the “BTI 2020” shows that in particular rampant corruption, lack of
prosecution of office abuse, and erosion of the separation of powers led the government “on a collision course
with the European institutions, in particular the European Commission, and other foreign partners”. Some of the
market-economy qualities that promote globalization were also reduced in the same period, among them factors
of competition law and the protection of private property.
Page 8 | Globalization Report 2020 – How do developing countries and emerging markets perform?

    There are two central reasons for the above-average increase of international integration between Eastern Eu-
    rope and the rest of the world: the fall of the Iron Curtain and the EU expansion to the East. Ten countries
    joined the EU in 2004, with Estonia, Latvia, Lithuania, Poland, Slovakia, Slovenia, the Czech Republic, and Hun-
    gary among them. 2007 saw the accession of Bulgaria and Romania. Both events intensified integration of most
    Eastern European countries into the world economy. Russia, on the other hand, was only able to advance its
    globalization through the fall of the Iron Curtain.

    Only the four BTI countries India, Mexico, Brazil, and Argentina show less progress in globalization than Russia
    does. The Globalization Index score for Argentina in 2018 was only four points above the one from 1990 – the
    third lowest value of all 45 countries under consideration.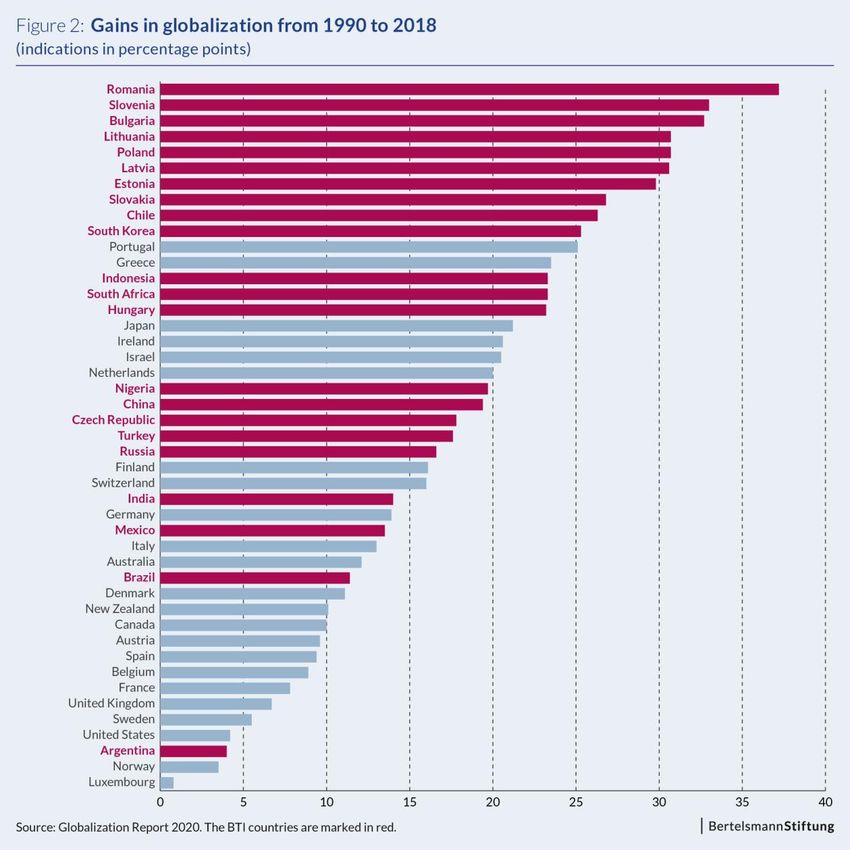
Globalization Report 2020 – How do developing countries and emerging markets perform? | Page 9

3 Globalization, growth, and prosperity
The study on the influence of advancing globalization on real GDP is based on the conviction that intensified eco-
nomic, social, and political globalization increases an economy’s GDP per capita. The GDP corresponds to the
value of all goods and services produced in a country within one year. It provides information on a country’s eco-
nomic performance. This indicator undeniably has several severe deficits:

•   One central point of criticism refers to the fact that GDP only covers goods and services that are exchanged
    for prices on markets. Economic activities that take place within a household or are supplied without mone-
    tary compensation are not considered. Hence, the GDP underestimates the actual economic performance of
    a country if self-sufficiency plays a major role in its society. This underestimation increases further if the offi-
    cial statistical coverage of economic activities is incomplete as well.
•   The second major weakness is caused by external effects. These are economically relevant costs or benefits
    not included in market prices. A negative external effect (e.g. pollution) means that the GDP does not fully
    capture the production costs to society as a whole. In this case, the value of the environment or natural re-
    sources would have to be depreciated. Consequently, GDP overestimates the level of economic value
    creation.

In spite of these and other deficits, there are good reasons why the GDP remains a key indicator of economic pol-
icy. For one thing, growing real GDP per capita tends to improve most people’s intangible living conditions.
Growing real GDP per capita is generally accompanied by, among other things, the following improvements of the
average living conditions (Fig. 3):

•   Medical care and the state of people’s health improve, infant mortality drops, and life expectancy increases.
•   The economic need for involving children in economic production processes as part of the workforce de-
    creases. This reduces the opportunity costs for school education, raising the level of education and
    increasing opportunities for better access to the labor market.
•   Productivity gains reduce the required working time, giving people more time for self-determined activities.
    People’s time prosperity increases.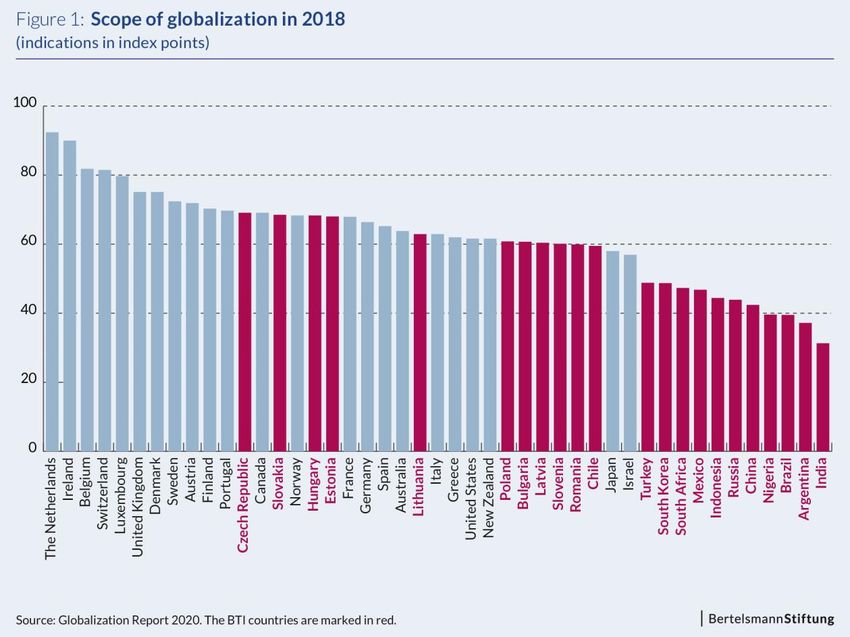
Page 10 | Globalization Report 2020 – How do developing countries and emerging markets perform?

    Selected data and countries examples from the United Nations “Human Development Report 2019” underscore
    that these interrelationships are not just theoretical (box 1). It confirms that people in countries with high gross
    national incomes per capita generally have a higher average life expectancy and can enjoy longer periods of edu-
    cation (Tab. 2).

    Box: Human Development Report and Human Development Index

    The United Nations has compiled a “Human Development Index” (HDI). This index measures average pro-
    gress in three elementary dimensions of human development for around 190 countries: material living
    standards, long and healthy lives, and the area of knowledge or education. The index of human development
    derived from this may assume values between zero and one. The higher a country’s value, the greater the
    level of human development there is. Material living standards are not expressed in terms of GDP, but in
    gross national income (GNI). A country’s GNI is the total of the income accruing to a country, less the income
    the country pays to the rest of the world. Purchasing-power parity considers the fact that one US dollar can
    buy fewer goods in countries with high price levels than in those with low ones. The average duration of
    school attendance indicates the average number of years of schooling received by people who are at least
    25 years old in a country at the time of data collection (for more details: DGVN 2019).
Globalization Report 2020 – How do developing countries and emerging markets perform? | Page 11
Globalization may increase the real GDP level of an economy through various channels. Some of the most im-
portant ones are the following (Bertelsmann Stiftung 2019a, p. 37):
• International mobility of labor and capital leads to production factors available around the world being used
where they contribute the most to overall economic value creation. For the world as a whole, this means that
a greater quantity of goods and services is available to consumers at a lower price.
• Intensification of trade between countries increases competitive pressure, and as a result the need to reduce
production costs through innovation and technical progress in order to remain internationally competitive.
Cost reduction by technical progress implies increased productivity, and as a result a higher GDP.
• When a company produces for the global market, its production is expanded considerably. The benefits of
mass production can often be used for this. This corresponds to an increase in productivity, which in-
creases GDP.
• The political agreement on mutual recognition of product standards facilitates cross-border trade, which also
promotes economic growth and gives consumers greater choice.Page 12 | Globalization Report 2020 – How do developing countries and emerging markets perform?
All in all, this supports the conviction described initially: Increase of a country’s economic, social, and political in-
tegration with the rest of the world increases the entire economy’s real GDP. When looking at the average, this
means that the real GDP per capita is growing. However, whether this also improves the socioeconomic situation
of a considerable part of the population in turn depends greatly on fair distribution and, as a result, on economic
and socio-political decisions of the respective government. All four Asian countries assessed by the Globalization
Report and the BTI, for example, have enjoyed stable to high growth rates in the last ten years. Their HDI ratings
have also grown continually. In contrast, the level of socio-economic development assessed in the BTI remained
at a high level in South Korea (9 out of 10 points), stagnated at a lower level in China (5 points), and dropped by
one point each in India (4 points) and Indonesia (5 points). This is mainly because a – partially considerable –
reduction of the absolute poverty rate was accompanied by greater inequality of distribution, often coupled with
marked regional disparities and a growing urban-rural gap. Essential social exclusion mechanisms remained in
place even during times of rising per capita GDP.Globalization Report 2020 – How do developing countries and emerging markets perform? | Page 13 4 Empirical research on the connection between globalization and GDP growth Past Globalization Reports showed that advancing globalization does, indeed, promote economic growth. All industrialized and emerging countries analyzed were able to record globalization-related GDP growth since 1990. The absolute average GDP gains per capita per year, expressed in euros, over the period under consideration is calculated in order to determine which country was able to gain the greatest economic benefits from increasing globalization since 1990. The indicator chosen is GDP per capita, which is more indicative for the prosperity of citizens than the economy’s total GDP. Three steps are necessary to calculate the effect of globalization on real GDP per capita: 1. First, the international integration of the 45 countries analyzed from 1990 to 2018 is measured by the Globali- zation Index, as already explained. 2. Subsequently, statistical methods are applied to determine whether a systematic correlation can be found be- tween the change in the Globalization Index and the growth rate of the real GDP per capita, and if so, how strong this correlation is. The calculations reflect the following result for the 45 economies under considera- tion in the period from 1990 to 2018: If the Globalization Index rises by one point, the growth rate of real GDP per capita increases by about 0.3 percentage points. 3. Finally, a hypothetical development is calculated in which the value of the Globalization Index for all 45 coun- tries remains at the 1990 level between 1990 and 2018. This means that the globalization-induced growth gains resulting from the actual progress of globalization are deducted. The increases in GDP that a country can achieve from 1990 to 2018 due to globalization are totaled up and then distributed evenly across all 28 years of the period in question. The resulting figure indicates a country’s absolute average annual GDP gain per capita – i.e. expressed in euros – due to globalization. The values for the globalization-related average annual gains in real GDP per capita vary considerably among the 45 countries (Fig. 4): The largest average income gains per capita and year are recorded in Japan (around 1,790 euros), Ireland (around 1,610 euros), and Switzerland (around 1,580 euros). The large emerging mar- kets are clustered at the lower end of the scale when measuring globalization gains like this. The average globalization-induced GDP growth per year and capita in Nigeria, for example, is only around 30 euros, and the one in India is at no more than 24 euros. The overwhelming majority of BTI countries only make it to the lower half of the ranking of the largest GDP growth rates compiled in this manner.
Page 14 | Globalization Report 2020 – How do developing countries and emerging markets perform?
There are three main reasons for these differences:
1. The starting level of GDP per capita: At an initial value of only 2,000 euros (corresponding roughly to the
value of Romania in 1990), even a ten percent globalization-induced increase in income merely leads to a
growth of 200 euros. An increase of only two percent at a GDP per capita of 40,000 euros (Switzerland’s
starting point) means a higher absolute growth of 800 euros.
2. The extent to which globalization has changed over the period under consideration: The stronger the glob-
alization index rises over time, the greater the growth gains due to globalization. Countries that started out at
a high index score in 1990 have little space remaining for further globalization gains. This also means that the
GDP increases caused by progressing globalization remain relatively small. This is why countries such as
Belgium and Luxembourg are not among the top ten nations in terms of this indicator.
3. The timing of the Globalization Index gains: If a country’s index value grows only in the last year of the pe-
riod under consideration, it can only achieve a globalization-induced growth increase in that one year. On the
other hand, a country that increases its globalization in the first year of the period analyzed raises its GDP per
capita to a higher level that is maintained through all subsequent years, generating an increase in income in-
duced by globalization for each and every year.
However, the fact that the absolute globalization-induced GDP growth of most BTI countries is relatively low by
international standards does not mean that globalization is irrelevant for these countries. Quite the opposite: If
GDP gains expressed in euros are put in relation to the starting levels of the respective real GDP per capita, the
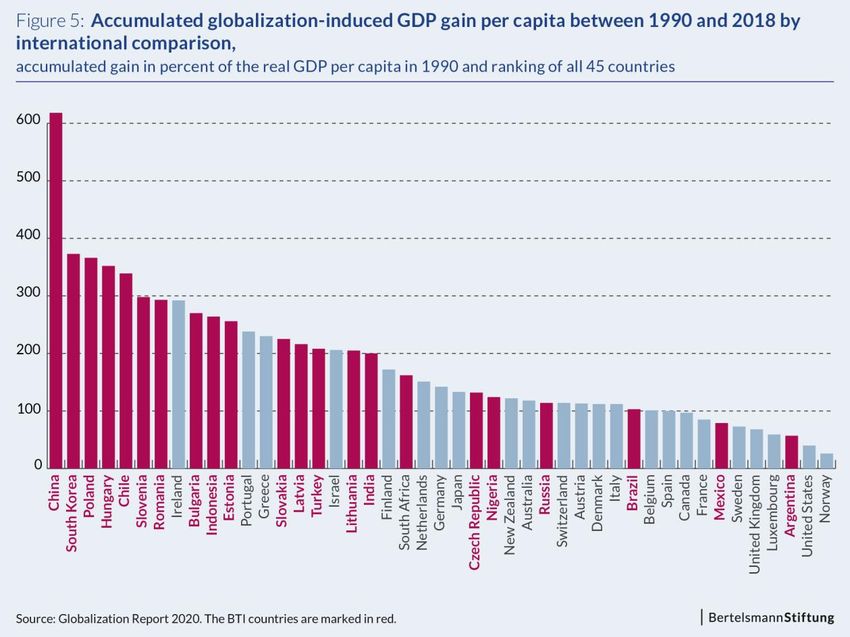
ranking of the countries with the highest growth rates changes drastically (Fig. 5). This can be illustrated using the
example of China:
• China’s cumulative globalization-induced real GDP gains per capita between 1990 and 2018 amount to
around EUR 2,660. China thus makes only 42nd place when compared to all 45 countries.Globalization Report 2020 – How do developing countries and emerging markets perform? | Page 15
• However, if the same amount is compared to China’s real GDP per capita in 1990 – which was 430 euros –
this cumulative monetary benefit from globalization represents nearly 620 percent of the 1990 GDP level.
This is by far the highest value of all 45 countries. South Korea follows in second place with around 370 per
cent.
Nine BTI countries are among the top ten countries in figure 5. 16 out of 22 countries are ranked in the upper half
of this ranking, illustrating the importance of advancing globalization for these countries. Brazil, Mexico, and in
particular Argentina are in the last third of the ranking. This has several reasons. For Argentina, it is mainly be-
cause the country was only able to increase its integration with the rest of the world very slightly during the period
under consideration (Fig. 2). This means that only small increases in GDP induced by globalization are achieved
there. Brazil also remains below average in its integration into the global economy. In addition, globalization has
stagnated there at a low level since 2005. Although Mexico saw a globalization surge from 2004 to 2015, its per
capita income growth remains low due to its late globalization development.Page 16 | Globalization Report 2020 – How do developing countries and emerging markets perform?
5 Development of absolute differences in real GDP per capita be-
tween industrialized countries and emerging markets
A look at the growth of real GDP per capita in the 45 countries from 1990 to 2018 shows that the growth rates
were above average in the vast majority of BTI countries. China’s real GDP per capita increased more than ten-
fold. The 20 countries with the strongest increases in percent include 17 BTI countries (Tab. 3).Globalization Report 2020 – How do developing countries and emerging markets perform? | Page 17
Page 18 | Globalization Report 2020 – How do developing countries and emerging markets perform?
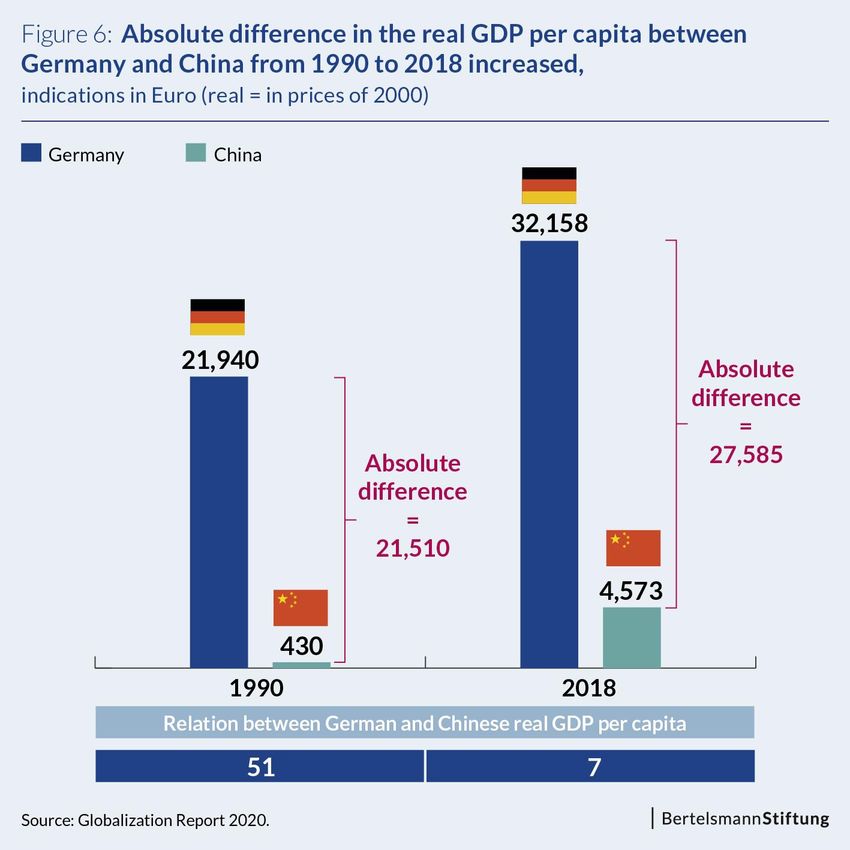
Although most percentage increases in the BTI countries are significantly higher than those in the developed in-
dustrial nations, the absolute gaps have enlarged. Once again, this is because of the high starting level of the
GDP per capita in the developed economies. One example for this is the comparison between the German and
Chinese real GDP per capita (Fig. 6):
• In 1990, the difference between the real GDP per capita of Germany and China respectively was around
21,500 euros.
• China’s GDP per capita in 2018 was around 960 percent higher than in 1990. Germany only achieved an in-
crease by just under 50 percent. In spite of China’s much greater growth, the absolute difference climbed to
27,585 euros and the absolute income gap widened.
• However, the relative difference decreased due to the strong growth of the Chinese economy. Germany’s
GDP per capita was 51 times greater than China’s in 1990. In 2018 it was only seven times higher.Globalization Report 2020 – How do developing countries and emerging markets perform? | Page 19 6 Globalization and the developing countries Only 22 out of the 137 BTI countries are among the economies examined in the “Globalization Report 2020”. De- veloping countries are not included due to a lack of data availability. However, alternative sources confirm the basic findings of the Globalization Report. The Eidgenössische Technische Hochschule Zürich calculates the annual KOF Globalization Index referred to above for about 200 countries. The latest results were published in October 2019 (ETH Zürich). Since this index is calculated slightly differently than the Globalization Report, comprises a larger number of countries, and covers a different period (1970 to 2017), the index values of the two analyses differ. However, their basic trend is the same here: The highest degree of international integration is found in small, highly developed industrialized countries, while the less developed economies show low Globalization Index values (Fig. 7). The low level of integration into the world economy permits only small increases in material prosperity induced by globalization. Developing countries and advanced economies also show a widening gap in real GDP per capita over time. A glance at real GDP per capita in US dollars shows, for example, that the absolute difference between the world’s seven most important industrial nations (G7 countries) and the rest of the world grew from 1970 (a year chosen because the corresponding data were first available in 1970 – in contrast to those of the Globalization Report) to 2018 (Fig. 8). While the absolute difference in real GDP per capita between the G7 countries and Asia grew from around USD 18,200 in 1970 to just above USD 41,000 in 2018, the relative gap narrowed: The average real GDP per capita was 14 times higher in the G7 countries than in Asia in 1970. By 2018, the difference had dropped to seven times (Tab. 4).
Page 20 | Globalization Report 2020 – How do developing countries and emerging markets perform?

    This is different for the region of Sub-Saharan Africa: The gap between this region and the G7 countries not only
    widened in absolute, but also in relative terms: The average real GDP per capita in the G7 countries was 15 times
    higher than in Sub-Saharan Africa in 1970. In 2018, it was even 29 times higher.
Globalization Report 2020 – How do developing countries and emerging markets perform? | Page 21 7 Implications for economic policy As described initially, advancing globalization has a positive impact on the material prosperity of people as meas- ured by real GDP (at least on average and without consideration of intra-societal distributional issues). However, certain standards and principles must be considered in the further design of the legal framework for the border- crossing exchange of goods, services, production factors, and technologies to allow globalization to actually take its growth- and welfare-enhancing effect, most of all through international division of labor and the associated in- ternational trade. This includes, among other things, reduction of import restrictions that only protect domestic companies (discriminatory trade barriers) for clientelist reasons, without generally ruling out import restrictions to protect emerging and not yet competitive sectors of the economy (see below). In turn, restrictions that serve to protect only the domestic consumers should be preserved. In order to prevent a “race to the bottom”, labor, so- cial, and other protection standards achieved (e.g. working time regulations, prohibition of forced and child labor, protection from wrongful dismissal, occupational health and safety, and environmental protection requirements) must not be abandoned for the sake of intensifying international trade (Bertelsmann Stiftung 2019b, p. 17). Fair distribution of the increased global material wealth produced by globalization between countries is essential as well. Like its predecessor studies, the “Globalization Report 2020” has shown that the developed industrialized nations have benefited the most from globalization so far in absolute terms of real GDP per capita as an indicator. In order to ensure that the promotion of international trade allows emerging markets and developing countries a greater share of the economic benefits of the international division of labor, it would be helpful, for example, if in- dustrialized countries opened their markets to processed products from developing countries without demanding the same in return (since developing countries are generally unable to enter competition with industri- alized countries on equal terms). Industrialized countries should also reduce, or even discontinue, their subsidies for agricultural products in order to eliminate the distortion of competition towards developing countries depending heavily on agriculture. A fairer distribution of trade profits could also be achieved by expanding the financial sup- port (debt relief, favorable credit conditions, budget support) of rich industrialized countries for less developed economies to enable these countries to afford the required infrastructure, education, and production facilities (Bertelsmann Stiftung 2019b, p. 18). Such steps taken by highly developed industrialized countries should not, however, lead to the governments of emerging markets and developing countries being relieved of their obligations. Foreign direct investment is an essential prerequisite for improving integration of these economies, as it has an important share in financing in- vestments fostering an improved economic performance. However, foreign investors need legal certainty in the respective country targeted for investment. In this respect, private- and market-economy structures that enable free and fair competition in the sense of inclusive economic development must be distinguished from state-diri- giste, market-distorting, or patronage-based structures that merely adopt certain aspects of the capitalist economy in order to realize efficiency gains in the service of a closed political system (Hartmann 2020). When combining the four indicators of the BTI Transformation Index on market organization, competition policy, property rights, and the private sector, only 15 out of 137 governments analyzed are found to guarantee open, inclusive and legally secure market and competition environments comprehensively and with few restrictions. Apart from nine East-Central and South-Eastern European EU members, this includes Chile and South Korea from the country sample examined here. These countries score at least eight out of ten points in each of the four indicators. A somewhat sufficient guarantee of a market-economy framework also applies to the patronage sys- tems in Hungary and South Africa, which, however, demonstrate more severe deficiencies in terms of uneven competition and preferable treatment. Brazil and India already fall into the gray area encompassing the transition to market and competition conditions that are no longer sufficiently free and fair. Both of these countries have pro- tected economic segments in which widespread violations of market and competition principles are allowed, along with rampant corruption and very large informal sectors. Distortion of competition and legal uncertainty are particularly severe in Nigeria and Russia.
Page 22 | Globalization Report 2020 – How do developing countries and emerging markets perform?

    In 99 out of 137 developing countries and emerging markets examined in the BTI 2020, uncertain market rules
    and distorted competition are accompanied by insufficient prosecution of office abuse and poor or no action to
    fight corruption. In the country sample examined here, this applies to China, Hungary, India, Indonesia, and Tur-
    key, and in particular to Mexico, Nigeria, and Russia.

    In this respect, fairer distribution mechanisms of globalization gains between industrialized and developing coun-
    tries on an international level must be addressed as well as a legally secure and inclusive competition on a
    national level. Many countries show a pattern of discrimination, distortion and concentration of power caused by
    deficient or manipulative market and competition organization, as well as by socio-economic exclusion, prevent-
    ing more comprehensive participation in globalization gains.

    Literature
    Bertelsmann Stiftung (ed.) (2020). Globalization Report 2020. Gütersloh.

    Bertelsmann Stiftung (ed.) (2019a). “The Bigger Picture – Wie Globalisierung, Digitalisierung und demografischer
    Wandel uns herausfordern”. Megatrend-Report #1. Gütersloh.

    Bertelsmann Stiftung (ed.) (2019b). “Roadmap 2030 – Deutschlands Erfolg in der globalisierten Welt”. GED
    Focus Paper. Gütersloh.

    DGVN (Deutsche Gesellschaft für die Vereinten Nationen e.V.) (2019). Bericht über die menschliche Entwicklung
    2019 – Überblick. Berlin.

    Turner, Axel (2006). “Does Globalization Affect Growth? Empirical Evidence from a new Index”. Applied Econo-
    mics (38). 1.091–1.110.

    ETH Zürich (Eidgenössische Technische Hochschule Zürich). “KOF Globalisierungsindex: Schwächerer Welthan-
    del bremst Globalisierung”. Medieninformation of October 23rd, 2019. Zürich.

    Hartmann, Hauke (2020). BTI 2020: Global Uncertainty – Economy Report. Gütersloh: Bertelsmann Stiftung.
    https://www.bti-project.org/content/en/reports/global-report-e/global_findings_economy_2020_EN.pdf
Globalization Report 2020 – How do developing countries and emerging markets perform? | Page 23
Imprint
© 2020
Bertelsmann Stiftung
Carl-Bertelsmann-Straße 256
D-33311 Gütersloh
www.bertelsmann-stiftung.de
Person responsible
Dr. Thieß Petersen
Authors
Dr. Thieß Petersen, Dr. Hauke Hartmann
Translation
Heilwagen Übersetzungen GmbH & Co. KG,
Heidelberg
Graphics
Jürgen Schultheiß, Bielefeld
Cover image
© adibz820/Pixabay – Pixabay License,
https://pixabay.com/de/service/license/Address | Contact Bertelsmann Stiftung Carl-Bertelsmann-Straße 256 D-33311 Gütersloh Phone +49 5241 81-0 GED team Program Megatrends Phone +49 5241 81-81353 ged@bertelsmann-stiftung.de www.ged-project.de www.bertelsmann-stiftung.de
You can also read