APPENDIX 22-A COMMERCIAL FISHERIES TECHNICAL REPORT
←
→
Page content transcription
If your browser does not render page correctly, please read the page content below
ABERDEEN HARBOUR
 EXPANSION PROJECT
 November 2015

 Volume 3:
 Technical
 Appendices

Appendix 22-A COMMERCIAL FISHERIES
 TECHNICAL REPORT
FUGRO EMU LIMITED

 ABERDEEN HARBOUR EXPANSION PROJECT:
 BASELINE ASSESSMENT FOR COMMERCIAL
 FISHERIES

 Report No: 14/J/3/06/2582/1774

Prepared for: Aberdeen Harbour Board

 16 Regent Quay,
 Aberdeen,
 AB11 5SS

Client Reference Number: J/3/06/2582

 1 Draft TRM JSD PAE 24/03/2015
 2 FINAL TRM AMA AMA 14/08/2015
 3 FINAL V2 TRM AMA AMA 21/08/2015
 Rev. Description Prepared Checked Approved Date

This Project has received funding from the European Union: The Content of the Document does not necessarily reflect the views or opinions of
the EU Commission and that the Commission is not responsible for any use made by any party of the information contained within it.

Fugro EMU Limited
Trafalgar Wharf (Unit 16), Hamilton Road, Portchester, Portsmouth PO6 4PX
Registered Address: Fugro House, Hithercroft Road, Wallingford, OX10 9RB, UK
ABERDEEN HARBOUR EXPANSION PROJECT:
BASELINE ASSESSMENT FOR COMMERCIAL FISHERIES

SIGN OFF PAGE

 Document Release and Authorisation Record

 Fugro EMU Document No. 14/J/3/06/2582/1774

 Issue Number 3

 Issued To Aberdeen Harbour Board

 Date Issued 19/08/2015
 This Version
 Name Date Signature
 Authorised By
 Author Tom Morris 21/08/2015

 Technical Checker Justine Davies
 21/08/2015
 QA Proof Reader Andy Addleton

 Paul English
 Group Manager/Director 21/08/2015
 Andy Addleton

Contact Details
Fugro EMU Limited
Trafalgar Wharf (Unit 16),
Hamilton Road,
Portchester,
Portsmouth
PO6 4PX
United Kingdom
www.fugroemu.com

Report No. 14/J/3/06/2582/1774 Page i
ABERDEEN HARBOUR EXPANSION PROJECT:
BASELINE ASSESSMENT FOR COMMERCIAL FISHERIES

 TABLE OF CONTENTS

1. INTRODUCTION 4
1.1 Project background 4
1.2 Aims and objectives 4

2. METHODOLOGY 4
2.1 Desk based review of existing data 4
2.2 Consultation 5

3. DESK BASED REVIEW OF EXISTING DATA 8
3.1 Key species 8
 3.1.1 ICES Rectangle 43E7 key species by value 8
 3.1.2 ICES Rectangle 43E7 key species by weight 9
 3.1.3 ICES Rectangle 43E8 key species by value 10
 3.1.4 ICES Rectangle 43E8 key species by weight 11
3.2 Temporal trends in landed catch 12
 3.2.1 Five year temporal trends for ICES Rectangle 43E7 12
 3.2.2 Seasonality of ICES Rectangle 43E7 13
 3.2.3 Five year temporal trends for ICES Rectangle 43E8 14
 3.2.4 Seasonality of ICES Rectangle 43E8 15
3.3 Gear types and ports 15
3.4 Spatial trends in activity 17
3.5 Salmon and sea trout 21

4. CONSULTATION 23

5. CALCULATION OF FISHING VALUE 24
5.1 Methodology: Calculation of fishing value 24
 5.1.1 Value based on ICES landings data and VMS tracking 24
 5.1.2 Value based on ScotMap inshore fisheries data 24
5.2 Calculation 24
 5.2.1 Value based on ICES landings data and VMS tracking 24
 5.2.2 Value based on ScotMap inshore fisheries data 28

6. OVERVIEW OF POTENTIAL IMPACTS 31
6.1 Implications for fisheries during the construction phase 31
6.2 Implications for fisheries during operational phase 31
6.3 Adverse impacts on commercially exploited fish and shellfish populations 31

7. CONCLUSIONS 31

8. REFERENCES 32

APPENDIX A 33

Report No. 14/J/3/06/2582/1774 Page 2
ABERDEEN HARBOUR EXPANSION PROJECT:
BASELINE ASSESSMENT FOR COMMERCIAL FISHERIES

 TABLES

Table 3.1 Ten highest value species for ICES Rectangle 43E7 (2009-2013) 9
Table 3.2 Ten highest landed weight species for ICES Rectangle 43E7 (2009-2013) 9
Table 3.3 Ten highest landed value species for ICES Rectangle 43E8 (2009-2013) 11
Table 3.4 Ten highest landed weight species for ICES Rectangle 43E8 (2009-2013) 12
Table 3.5 Vessel number, type and size for Scottish East Coast ports (Marine Scotland, 2014) 16
Table 3.6 Number of wild salmon, grilse and sea trout caught and retained for the north east salmon fishery
region during 2013 by method 22
Table 3.7 Number of wild salmon, grilse and sea trout caught and retained for the north east salmon fishery
region during 2013 by district 22
Table 3.8 Number of wild salmon, grilse and sea trout caught and released for the north east salmon fishery
region from rod and line fisheries during 2013 by district 23

 FIGURES

Figure 2.1 ICES rectangles used to define minimum area of study (ICES rectangles 43E7 and 43E8) 6
Figure 3.1 ICES Rectangle 43E7 five highest value species yearly landings 2009-2013 8
Figure 3.2 ICES Rectangle 43E7 five highest landed weight species from yearly landings 2009-2013 10
Figure 3.3 ICES Rectangle 43E8 five highest value species yearly landings 2009-2013 11
Figure 3.4 ICES Rectangle 43E8 five highest landed weight species from yearly landings 2009-2013 12
Figure 3.5 Yearly landed value of ICES Rectangle 43E7 (2009-2013) 13
Figure 3.6 Seasonality of catch in ICES Rectangle 43E7 (2009-2013 total monthly value). The value for
undisclosed months (total yearly value minus value for disclosed months) is spread evenly across those months
 14
Figure 3.7 Yearly landed value of ICES Rectangle 43E8 (2009-2013) 14
Figure 3.8 Seasonality of catch in ICES Rectangle 43E8 (2009-2013 total monthly value). The value for
undisclosed months (total yearly value minus value for disclosed months) is spread evenly across those months
 15
Figure 3.9 VMS fishing intensity (vessel / day / km 2) for Nephrops mobile gear, scallops fishing, and squid
fishing based upon amalgamated layer for 2009 -2013 (Marine Scotland, 2015) 18
Figure 3.10 VMS fishing intensity (vessel / day / km2) for demersal mobile gear, herring fishing, and
mackerel; fishing based upon amalgamated layer for 2009 -2013 (Marine Scotland, 2015) 19
Figure 3.11 ScotMap fishing value of catch for other species trawls from small vessels (2007-2011) 20
Figure 3.12 ScotMap fishing value of catch for lobster pots from small vessels (2007-2011) 20
Figure 3.13 ScotMap fishing value of catch for other mackerel lines from small vessels (2007-2011) 21
Figure 5.1 Areas used in the calculation of fishing value based upon ICES landings and VMS tracking data
 26
Figure 5.2 Identification of area impacted by new shipping routes 27
Figure 5.3 Overview of ScotMap cells and Marine Licence Boundary 30

Report No. 14/J/3/06/2582/1774 Page 3
ABERDEEN HARBOUR EXPANSION PROJECT: BASELINE ASSESSMENT FOR COMMERCIAL FISHERIES 1. INTRODUCTION 1.1 Project background Aberdeen Harbour Board (AHB) proposes expansion of current harbour operations through development of Nigg Bay, a shallow water, sediment embayment located directly south of Aberdeen. To achieve this, a series of technical environmental studies have been commissioned to support the necessary consent applications and associated Environmental Statement (ES). Information derived from these studies will be used to inform the Environmental Impact Assessment (EIA), with respect to predicted effects of the construction, operation and decommissioning of the new port facilities and to assist in the development of mitigation measures where agreed and appropriate. This will aid in the development of the ES in support of the consent application. To address these aspects, Fugro EMU Limited (Fugro EMU) was commissioned to undertake a desk based review of the commercial fishing in the proposed development area and local surrounds. Accordingly this document presents the data collected and gives a characterisation of the fishing conditions within and around the harbour proposals in terms of the spatial and temporal distributions of the typical gear types, the locations and extents of any critical fish habitat and the occurrence and use of the area by important species. 1.2 Aims and objectives The aim of this report is to provide baseline characterisation of commercial fisheries activities that will support the EIA process for the Aberdeen Harbour Expansion Project. 2. METHODOLOGY 2.1 Desk based review of existing data The aim of the desk based review of existing data is to collect sufficient data to allow impacts on commercial fishing to be assessed in a robust and defensible manner. The following data sets have been collected, analysed interpreted and then described in the environmental baseline for commercial fishing: Marine fisheries statistical data from Marine Scotland, which are recorded according to activity / catches from relevant International Council for the Exploration of the Sea (ICES) rectangles according to fishery type, species, values and other variables; ScotMap (
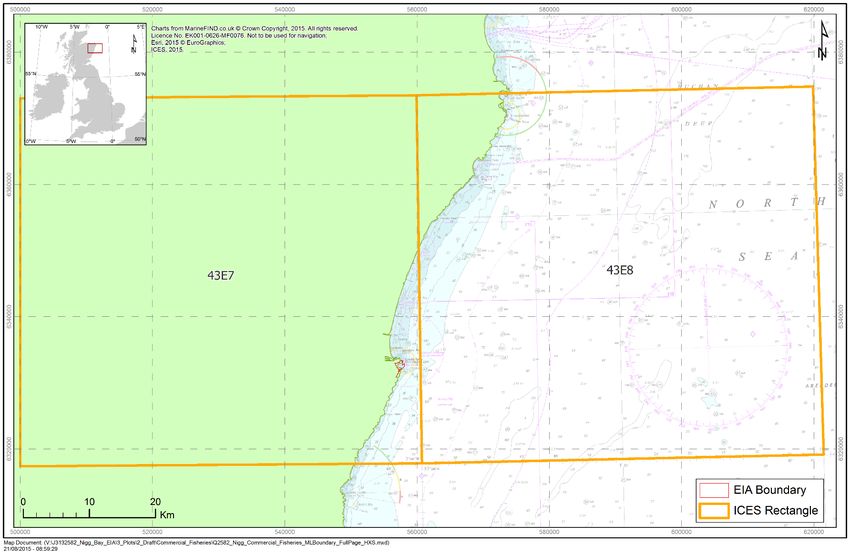
ABERDEEN HARBOUR EXPANSION PROJECT: BASELINE ASSESSMENT FOR COMMERCIAL FISHERIES Freshwater fisheries statistical data, specifically salmon and trout catch statistics (Marine Scotland, 2013; Scotland’s Marine Atlas: Information for the National Marine Plan (Baxter et al., 2011); Other published information and technical reports associated with nearby developments, such as Beatrice Offshore Wind Farm; ICES fish landings data. Other principal data sources include the following as a minimum: Benthic ecology survey and desk based assessment (information on benthic communities and their support of commercial fishing stocks); Fish ecology desk based assessment (information on the likely presence of ecological impacts on commercial fish species which could impact stocks); ICES; EU Fisheries Committee publications and datasets (Europa and Eurolex); Marine Scotland; Seafish; Scottish Fishermen’s Federation; Dee District Salmon Fishery Board; Association of Salmon Fishery Boards; Salmon Net Fishing Association of Scotland; Atlantic Salmon Trust; East of Scotland Inshore Fisheries Group; Other regional affiliated fishermen’s associations and producers organisations, such as the Aberdeen Fish Producers Organisation; Local port merchants and agents; Aberdeen Harbour Board Harbour Masters; Non-UK National Fisheries Datasets (if available). 2.2 Consultation Spatial fishing intensity data has been collected and plotted, however, due to the limitations of these datasets it is necessary to supplement these with consultation with fishing groups and individuals known to be active in the development area, and the adjacent area which could be disrupted through a change to shipping patterns. The study area has been defined as ICES rectangles 43E7 and 43E8 as shown in Figure 2.1. Report No. 14/J/3/06/2582/1774 Page 5
ABERDEEN HARBOUR EXPANSION PROJECT:
BASELINE ASSESSMENT FOR COMMERCIAL FISHERIES

 Figure 2.1 ICES rectangles used to define minimum area of study (ICES rectangles 43E7 and 43E8)

Report No. 14/J/3/06/2582/1774 Page 6
ABERDEEN HARBOUR EXPANSION PROJECT: BASELINE ASSESSMENT FOR COMMERCIAL FISHERIES The consultation was designed as a two part process, undertaken through a local fisheries liaison. Having a local and respected fisheries liaison officer encourages positive engagement from the fishing community and increases the effectiveness and value of the information collected. A questionnaire was circulated to known fishing groups active in the region (Questionnaire is shown in Appendix A); the aim of this questionnaire was to collect preliminary information about the types of vessels potentially impacted by the development and to gauge the requirement for further consultation and mitigation. Information collected in the questionnaire has been used in the characterisation of the fishing effort and to validate the more quantitative data collected through vessel tracking and landings data, and detailed throughout. The questionnaire was distributed through the following groups: The Scottish Fishermen’s Federation; Scottish White Fish Producers Association; East Coast Inshore Fishery Group; The Scallop Association; Aberdeen Fish Producers Association; The Aberdeen Salmon Fishery Board; Other regional affiliated fishermen’s associations and producers organisations, such as the Aberdeen Fish Producers Organisation; Local port merchants and agents; Aberdeen Harbour Board Local Harbour Master. Further, distribution was also undertaken, through contacts of the Fisheries Liaison to ensure, as best as reasonably practical, that all fishing vessels concerned were included even where not affiliated to a federation or organisation. This was considered especially important for local shellfish creel fishermen who operate in this region. Consultation was, and will continue to be, recorded through the use of a project specific register of local fishermen’s groups, associations and individuals contacted. It was understood a second stage of consultation may have been undertaken during the writing of the Environmental Statement dependent upon the level of response to the questionnaire. As the number of interested parties was low and it was considered sufficient information was gathered during the first consultation, the second stage of consultation was not carried out. Report No. 14/J/3/06/2582/1774 Page 7
ABERDEEN HARBOUR EXPANSION PROJECT:
BASELINE ASSESSMENT FOR COMMERCIAL FISHERIES

3. DESK BASED REVIEW OF EXISTING DATA

3.1 Key species
 This section provides an overview of key species by value and weight to characterise the commercial
 fishing undertaken in the project area.

3.1.1 ICES Rectangle 43E7 key species by value
 ICES landings data for the period 2009 – 2013 (Table 3.1) showed that the most valuable species in
 43E7 are crabs followed by lobsters, with squid and scallops of similar price ranked third and fourth
 most valuable species. Below these species, the value drops off dramatically suggesting these four
 species are the predominant target species for the wider development area. This is consistent with
 consultation responses which identify the area as important for creel potting for lobster and crab.

 Figure 3.1 show the trends for catch value of the top five species over the previous five years for
 which statistics were available. Crab and lobsters are consistently the two most valuable catches with
 scallop and squid more variable year to year. Mackerel is the fifth most value catch but is consistently
 the least valuable of the top five. Squid and scallop have a significant peak for catch value in 2011.

 90000

 80000

 70000

 60000

 50000
 Value (£)

 40000

 30000

 20000

 10000

 0
 2009 2010 2011 2012 2013
 Year
 Crabs (C.P.Mixed Sexes) Lobsters Squid Scallops Mackerel

 Figure 3.1 ICES Rectangle 43E7 five highest value species yearly landings 2009-2013

Report No. 14/J/3/06/2582/1774 Page 8
ABERDEEN HARBOUR EXPANSION PROJECT:
BASELINE ASSESSMENT FOR COMMERCIAL FISHERIES

 Table 3.1 Ten highest value species for ICES Rectangle 43E7 (2009-2013)
 Species 2009-2013 Value (£)
 Crabs (C.P.Mixed Sexes) 307,679
 Lobsters 229,086
 Squid 133,188
 Scallops 112,947
 Mackerel 21,416
 Haddock 16,344
 Nephrops (Norway Lobster) 11,686
 Crabs - Velvet (Swim) 11,499
 Plaice 6,545
 Lemon Sole 5,084
 Note:
 Numbers rounded nearest UK pound.

3.1.2 ICES Rectangle 43E7 key species by weight
 Crabs are by far the largest catch landed by weight (Table 3.2) with almost five times the tonnage over
 the five year period as scallops, the second most landed catch by weight. Squid and lobsters have a
 similar caught weight over the five years (Figure 3.2) of around 25 tonnes, however their difference in
 market price is evident in the landed value.

 The yearly trends show that although mackerel is consistently the lowest value of the top five species,
 in terms of landed weight it is often similar to lobster, squid and for 2012 and 2013 scallops.

 Table 3.2 Ten highest landed weight species for ICES Rectangle 43E7 (2009-2013)
 Species 2009-2013 Landed Weight
 (tonnes)
 Crabs (C.P.Mixed Sexes) 259.55
 Scallops 64.71
 Squid 26.20
 Lobsters 24.21
 Mackerel 19.66
 Haddock 14.36
 Crabs - Velvet (Swim) 5.66
 Plaice 5.48
 Nephrops (Norway Lobster) 3.65
 Cod 2.00

Report No. 14/J/3/06/2582/1774 Page 9
ABERDEEN HARBOUR EXPANSION PROJECT:
BASELINE ASSESSMENT FOR COMMERCIAL FISHERIES

 70

 60

 50
 Weight (tonnes)

 40

 30

 20

 10

 0
 2009 2010 2011 2012 2013
 Year
 Crabs (C.P.Mixed Sexes) Scallops Squid Lobsters Mackerel

 Figure 3.2 ICES Rectangle 43E7 five highest landed weight species from yearly landings
 2009-2013

3.1.3 ICES Rectangle 43E8 key species by value
 Rectangle 43E8 covers an area further offshore than 43E7 within which the development sits;
 however, it gives a good indication of the species that are important surrounding the shipping routes.

 In this area scallops (£4,777,100) are the most valuable species; twice as valuable as the second
 most species, herring (£1,839,361) (see Table 3.3). The other species landed were valued at less
 than £1M during the five year period 2009 - 2013.

 Figure 3.3 shows the yearly trends for the top five species by value. Scallops are consistently the most
 valuable catch; however, they do show a particularly large value in 2013 of over £1.3 million.

Report No. 14/J/3/06/2582/1774 Page 10
ABERDEEN HARBOUR EXPANSION PROJECT:
BASELINE ASSESSMENT FOR COMMERCIAL FISHERIES

 Table 3.3 Ten highest landed value species for ICES Rectangle 43E8 (2009-2013)
 Species 2009-2013 Value (£)
 Scallops 4,777,100
 Herring 1,839,361
 Crabs (C.P.Mixed Sexes) 974,123
 Haddock 967,469
 Mackerel 645,381
 Lobsters 552,717
 Nephrops (Norway Lobster) 193,346
 Crabs - Velvet (Swim) 189,765
 Squid 182,236
 Horse Mackerel 136,998
 Note:
 Numbers rounded nearest UK pound.

 1400000

 1200000

 1000000

 800000
 Value (£)

 600000

 400000

 200000

 0
 2009 2010 2011 2012 2013
 Year

 Scallops Herring Crabs (C.P.Mixed Sexes) Haddock Mackerel

 Figure 3.3 ICES Rectangle 43E8 five highest value species yearly landings 2009-2013

3.1.4 ICES Rectangle 43E8 key species by weight
 Despite being the most valuable species in ICES rectangle 43E8, scallops were only landed in just
 over half (2,607 tonnes) the weight of herring (4,760 tonnes). Figure 3.4 shows the yearly trends of
 landings by weight where scallops are consistently the second largest catch by weight. It is notable
 that whilst the weight of herring landed in 2012 than 2013 remained relatively similar, there was
 significant drop in value that can be seen in Figure 3.3.

Report No. 14/J/3/06/2582/1774 Page 11
ABERDEEN HARBOUR EXPANSION PROJECT:
BASELINE ASSESSMENT FOR COMMERCIAL FISHERIES

 Table 3.4 Ten highest landed weight species for ICES Rectangle 43E8 (2009-2013)
 Species 2009-2014 Landed Weight
 (tonnes)
 Herring 4760.49
 Scallops 2607.03
 Haddock 1025.42
 Crabs (C.P.Mixed Sexes) 849.72
 Mackerel 609.03
 Horse Mackerel 169.13
 Crabs - Velvet (Swim) 95.61
 Whiting 62.54
 Nephrops (Norway Lobster) 56.74
 Lobsters 52.59

 2000

 1800

 1600

 1400

 1200
 Weight (tonnes)

 1000

 800

 600

 400

 200

 0
 2009 2010 2011 2012 2013
 Year

 Herring Scallops Haddock Crabs (C.P.Mixed Sexes) Mackerel

 Figure 3.4 ICES Rectangle 43E8 five highest landed weight species from yearly landings
 2009-2013

3.2 Temporal trends in landed catch

3.2.1 Five year temporal trends for ICES Rectangle 43E7
 Figure 3.5 shows the landed value of catch from ICES rectangle 43E7 for five years from 2009 to 2013
 for all species. Overall there is a general trend of increasing values but within the variance of years
 this is not significant. The value of catch for 2011 stands out as being particularly high and a doubling

Report No. 14/J/3/06/2582/1774 Page 12
ABERDEEN HARBOUR EXPANSION PROJECT:
BASELINE ASSESSMENT FOR COMMERCIAL FISHERIES

 of the value of the previous year. This increase can be attributed to comparatively increased landed
 catches of squid, lobster and scallop (Figure 3.1).

 300,000

 250,000

 200,000
 Landed Value (£)

 150,000

 100,000

 50,000

 0
 2009 2010 2011 2012 2013
 Year

 Figure 3.5 Yearly landed value of ICES Rectangle 43E7 (2009-2013)

3.2.2 Seasonality of ICES Rectangle 43E7
 To enable a detailed assessment of seasonality, monthly data is assessed; however it is
 acknowledged there are limitations in the datasets, as where less than five vessels contribute to the
 statistics these are undisclosed.

 Due to the suppression of this data much of the monthly data for total value of catch is unavailable.
 Values are shown for months where more than five vessels contribute and the remaining yearly value
 distributed evenly across the remaining months in Figure 3.6. This shows that the key months for
 fishing activity are June to September with the peak in August. However, without species specific data
 it is impossible to tell which fishery this is attributable to and whether all species follow a similar trend.

 The consultation data indicated that within the development area, fishing activity targeting lobster and
 crab with creel pots is undertaken all year round.

Report No. 14/J/3/06/2582/1774 Page 13
ABERDEEN HARBOUR EXPANSION PROJECT:
BASELINE ASSESSMENT FOR COMMERCIAL FISHERIES

 200,000
 180,000
 Landed Value 2009-2013 (£)

 160,000
 140,000
 120,000
 100,000
 80,000
 60,000
 40,000
 20,000
 0
 1 2 3 4 5 6 7 8 9 10 11 12
 Month

 Figure 3.6 Seasonality of catch in ICES Rectangle 43E7 (2009-2013 total monthly value). The
 value for undisclosed months (total yearly value minus value for disclosed months) is spread
 evenly across those months

3.2.3 Five year temporal trends for ICES Rectangle 43E8
 ICES rectangle 43E8 has shown a steady rise in yearly landed value from £1,284,653 in 2009 to
 £2,721,739 in 2013, as can be seen in Figure 3.7. Cross referencing to Figure 3.3, this increase can
 be attributed to increases in value of landed catch of scallops and herring, the two most valuable
 species in ICES rectangle 43E8.

 3,000,000

 2,500,000
 Landed Value (£)

 2,000,000

 1,500,000

 1,000,000

 500,000

 0
 2009 2010 2011 2012 2013
 Year
 Figure 3.7 Yearly landed value of ICES Rectangle 43E8 (2009-2013)

Report No. 14/J/3/06/2582/1774 Page 14
ABERDEEN HARBOUR EXPANSION PROJECT:
BASELINE ASSESSMENT FOR COMMERCIAL FISHERIES

3.2.4 Seasonality of ICES Rectangle 43E8
 Within ICES rectangle 43E8 a greater number of vessels contribute to the statistics and therefore
 there are less months undisclosed, presenting a more accurate overview of activity throughout the
 year. Largely it is the summer months that see the highest value of catch with peaks in May and
 August. However, without data for individual species it is not possible to conclude whether this is a
 trend across all species or whether the values are being dominated by the higher value catches.

 3,500,000

 3,000,000
 Landed Value 2009-2013 (£)

 2,500,000

 2,000,000

 1,500,000

 1,000,000

 500,000

 0
 1 2 3 4 5 6 7 8 9 10 11 12
 Month

 Figure 3.8 Seasonality of catch in ICES Rectangle 43E8 (2009-2013 total monthly value). The
 value for undisclosed months (total yearly value minus value for disclosed months) is spread
 evenly across those months

3.3 Gear types and ports
 Table 3.5 presents the numbers and size classes of commercial fishing vessels utilising home ports
 within the study area, according to the Marine Scotland (2014) data.

 According to consultation responses the dominant gear type used within and around Nigg Bay is creel
 fishing; a type of basket pot used to catch crab and lobster. These are typically deployed from smaller
 vessels ( 10m in length) are typically either
 Nephrops trawlers or demersal trawlers.

Report No. 14/J/3/06/2582/1774 Page 15
ABERDEEN HARBOUR EXPANSION PROJECT:
BASELINE ASSESSMENT FOR COMMERCIAL FISHERIES

 Table 3.5 Number of active Scottish based vessels by main fishing method (1) as at 31st December: 2004 to 2013 (Scottish
 Government, 2014)
 10m & under Pelagic (>10m) Demersal (>10m) Shellfish (>10m) Over
 Nephrops Creel Other2 Total Purse Pelagic Other Total Trawl3 Seine Lines Other4 Total Nephrops Creel Other Total 10 m Total
District trawls fishing seine trawl trawls fishing Total
Aberdeen 2 75 1 78 - - - - - - - - - 4 3 1 8 8 86
Anstruther 8 83 - 91 - - - - - - - - - 11 1 - 12 12 103
Buckie 9 37 4 50 - - - - 12 3 1 - 16 3 2 5 10 26 76
Eyemouth 10 75 4 89 - - - - 5 1 - - 6 11 3 - 14 20 109
Fraserburgh 1 75 20 96 1 9 - 10 48 5 - 1 54 33 1 2 36 100 196
Peterhead 1 48 2 51 2 2 - 4 32 4 - - 36 5 - 1 6 46 97
Scrabster 1 81 - 82 - - - - 1 2 - - 3 - 6 1 7 10 92
Total – East Coast 32 474 31 537 3 11 - 14 98 15 1 1 115 67 16 10 93 222 759

Report No. 14/J/3/06/2582/1774 Page 16
ABERDEEN HARBOUR EXPANSION PROJECT:
BASELINE ASSESSMENT FOR COMMERCIAL FISHERIES

3.4 Spatial trends in activity
 Data used to inform a spatial activity includes VMS tracking. Boats over 15 m in length are required to
 carry a VMS tracker to record their position. As a result there are limitations to interpreting the data set
 as it can’t be assumed that small boat activity mirrors that of larger vessels. The VMS data used in this
 report has been supplied by Marine Scotland (2009-2013) based upon work done by Marine Scotland
 Science staff (Kafas, A., Jones, G., Watret, R., Davies, I., Scott, B., 2012). In the treatment of the data
 a gaussian kernel density estimation with a data-driven bandwidth selection approach (smoothed
 cross-validation) had been used to produce high quality contour maps with the aim to form a better
 estimate of the spatial extent of fishing activity and intensity. However, in this process of smoothing
 the data some of the finer resolution is lost.

 The VMS data show Nigg Bay is average or above average for the region in terms of fishing intensity
 from VMS data for Nephrops, scallops and squid as shown in Figure 3.9. The Nigg Bay development
 area has below average VMS intensity for demersal mobile gear and there are no recordings for
 herring and mackerel (Figure 3.10). However, for both Nephrops and Demersal gear it is not possible
 to draw conclusion about the activity relative to its immediate surroundings.

 ScotMap is a Marine Scotland project which provides spatial information on the fishing activity of
 Scottish-registered commercial fishing vessels under 15 m in overall length. The data was collected
 during face-to-face interviews with individual vessel owners and operators and relates to fishing
 activity for the period 2007 to 2011. The data is aggregated and analysed to provide information on
 the monetary value, relative importance (relative value) and the usage (number of fishing vessels and
 crew) of seas around Scotland. However, the data has limitations in that not all of the targeted
 fishermen were able to contribute and not all chose to disclose earnings.

 The ScotMap cells within which Nigg Bay sits are above average for other species trawls (Figure
 3.11), lobster and crab pots (Figure 3.12) and mackerel lines (Figure 3.13). However, of these three
 the highest values are lobster and crab pots which are recorded as up to £5,000 per annum per cell
 where other species and mackerel are recorded in the region of hundreds of pounds rather than
 thousands. This correlates with consultation responses where at least two local vessels are reported
 to fish with creel type pots.

Report No. 14/J/3/06/2582/1774 Page 17
ABERDEEN HARBOUR EXPANSION PROJECT:
BASELINE ASSESSMENT FOR COMMERCIAL FISHERIES

 Figure 3.9 VMS fishing intensity (vessel / day / km2) for Nephrops mobile gear, scallops
 fishing, and squid fishing based upon amalgamated layer for 2009-2013 (provided by Marine
 Scotland based upon Kafas et al, 2012).

Report No. 14/J/3/06/2582/1774 Page 18
ABERDEEN HARBOUR EXPANSION PROJECT:
BASELINE ASSESSMENT FOR COMMERCIAL FISHERIES

 Figure 3.10 VMS fishing intensity (vessel / day / km2) for demersal mobile gear, herring
 fishing, and mackerel; fishing based upon amalgamated layer for 2009 -2013 (provided by
 Marine Scotland based upon Kafas et al, 2012)

Report No. 14/J/3/06/2582/1774 Page 19
ABERDEEN HARBOUR EXPANSION PROJECT:
BASELINE ASSESSMENT FOR COMMERCIAL FISHERIES

 Figure 3.11 ScotMap fishing value of catch for other species trawls from small vessels (2007-
 2011)

 Figure 3.12 ScotMap fishing value of catch for lobster pots from small vessels (2007-2011)

Report No. 14/J/3/06/2582/1774 Page 20
ABERDEEN HARBOUR EXPANSION PROJECT: BASELINE ASSESSMENT FOR COMMERCIAL FISHERIES Figure 3.13 ScotMap fishing value of catch for other mackerel lines from small vessels (2007- 2011) 3.5 Salmon and sea trout Atlantic salmon and sea trout are both anadromous migratory species which live in both freshwater and marine habitats during their life cycle. Salmon and sea trout fisheries target these species principally in river environments and also in some coastal areas known to be present in the area. The main methods for catching salmon and sea trout in Scotland are (Marine Scotland, 2012): Rod and line catch (retained) – generally not used at sea and only within rivers; Rod and line catch (released, or catch and release) – generally not used at sea and only within rivers; Fixed engine (bag and stake nets) – restricted to coastal areas, not permitted in estuary limits; Net and coble – generally used in lower estuaries but sometimes in coastal areas. The most recent catch records are those for 2013 and recorded by Marine Scotland with the data for the north east region, as presented in Table 3.6 to Table 3.8. In the north east region the majority of salmon caught and retained is from fixed engine in the May – December season, with 4,942 caught from all methods in 2013. A further 6,423 grilse (salmon that have returned to fresh water after a single winter at sea) are caught taking the total to 11,365. Comparatively few sea trout are caught and retained at only 1,719 with the majority of these being targeted with net and cobble (749) followed by rod and line (596). Report No. 14/J/3/06/2582/1774 Page 21
ABERDEEN HARBOUR EXPANSION PROJECT:
BASELINE ASSESSMENT FOR COMMERCIAL FISHERIES

 Nigg Bay is located within the Dee (Aberdeenshire) district. Table 3.7 shows that the Dee is relatively
 less important for caught and retained salmon and sea trout making up just 0.74% and 3.6%
 respectively of the region’s total. In contrast the Dee is extremely important for the salmon and sea
 trout caught and returned making up 63% and 56.6% respectively of the regions total in 2013.

 Table 3.6 Number of wild salmon, grilse and sea trout caught and retained for the north
 east salmon fishery region during 2013 by method
 Method Jan-Apr May-Dec Annual Grilse Salmon + Sea Trout
 Grilse
 Rod and Line 53 471 524 391 915 596
 Net and Coble 992 992 1,635 2,627 749
 Fixed Engine 81 3,345 3,426 4,397 7,823 374
 All Methods 134 4,808 4,942 6,423 11,365 1,719
 Note:
 The data used in this table are Crown copyright, used with the permission of Marine Scotland
 Science. Marine Scotland is not responsible for interpretation of these data by third parties

 Table 3.7 Number of wild salmon, grilse and sea trout caught and retained for the north
 east salmon fishery region during 2013 by district
 District Jan-Apr May-Dec Annual Grilse Salmon Sea
 + Grilse Trout
 South Esk 6 3,143 3,149 4,136 7,285 198
 North Esk and Bervie 100 1,331 1,431 2,021 3,452 1,009
 Dee (Aberdeenshire) 10 44 54 31 85 62
 Don 16 85 101 71 172 20
 Ythan 1 165 166 128 294 350
 Ugie 1 40 41 36 77 80
 Totals 134 4,808 4,942 6,423 11,365 1,719
 Note:
 The data used in this table are Crown copyright, used with the permission of Marine Scotland
 Science. Marine Scotland is not responsible for interpretation of these data by third parties

Report No. 14/J/3/06/2582/1774 Page 22
ABERDEEN HARBOUR EXPANSION PROJECT: BASELINE ASSESSMENT FOR COMMERCIAL FISHERIES Table 3.8 Number of wild salmon, grilse and sea trout caught and released for the north east salmon fishery region from rod and line fisheries during 2013 by district Salmon Sea District Jan-Apr May-Dec Annual Grilse + Grilse Trout South Esk 77 243 320 104 424 194 North Esk and Bervie 205 747 952 307 1259 157 Dee (Aberdeenshire) 945 2924 3869 993 4862 845 Don 172 525 697 336 1033 107 Ythan 1 88 89 39 128 168 Ugie 3 3 20 Totals 1400 4527 5927 1782 7709 1491 Note:The data used in this table are Crown copyright, used with the permission of Marine Scotland Science. Marine Scotland is not responsible for interpretation of these data by third parties 4. CONSULTATION The consultation was undertaken between and 10 December 2014 and 12 January 2015. Project details and a response questionnaire were circulated by Fisheries Liaison Office Jennifer Moat of Agire Consultancy. The following organisations were contacted in addition to individual members known to operate from Aberdeen Harbour: The Scottish Fishermen’s Federation; Scottish White Fish Producers Association; East Coast Inshore Fishery Group; The Scallop Association; Aberdeen Fish Producers Association; The Aberdeen Salmon Fishery Board. Responses of ‘no comment’ were received from the Scottish White Fish Producers Association, The Scallop Association and The Scottish Fishermen’s Federation who had in turn passed the communication on to their constituent associations. In addition a number of individual fishermen were contacted who were known to use the development area. One response was received from a local fisherman reporting the use of the area by his and one other vessel. Both vessels target lobster and crab with creel pots, with up to 600 pots set along the coast between Aberdeen and Newtonhill. Their fishery is targeted on a year round basis. Of specific interest were rock areas at the north and south of Nigg Bay. It was also stated that the area could be an important nursery and breeding ground for lobster and crab. There was also belief that grounds further offshore could be affected by increased vessel traffic. The consultation responses agree with VMS, ScotMap and ICES landings statistics that the development area is targeted for crab and lobster by smaller vessels. Report No. 14/J/3/06/2582/1774 Page 23
ABERDEEN HARBOUR EXPANSION PROJECT:
BASELINE ASSESSMENT FOR COMMERCIAL FISHERIES

5. CALCULATION OF FISHING VALUE

5.1 Methodology: Calculation of fishing value

5.1.1 Value based on ICES landings data and VMS tracking
 The landings and VMS recording and sightings data, enable the interpretation of how different
 fisheries operate within the study area. Compiling an accurate economic evaluation is limited due to
 the nature of fishing activities, but by using VMS and surveillance data to show a spatial distribution of
 effort this can be used in collaboration with landings data to produce effort as a proxy for landed value.
 This is known as the effort as a proxy for landed value technique as detailed in Seafish’s Best Practice
 Guidance for Fishing Industry Financial and Economic Impact Assessments (2012) and requires 5
 years of landings data. It is a recommended approach of Seafish; however, it can be constrained by
 the accuracy and coverage of VMS data.

 The calculations assign a value estimation to the development area by taking the effort (expressed as
 vessels per day) for the full ICES Rectangle, and the effort for the development area, and calculating
 the proportional value of the development. As this methodology uses the proportional effort (based on
 VMS data) rather than the proportional area it is not skewed by the land based area of the ICES
 rectangle.

 Nigg Bay is located totally within ICES Rectangle 43E7 from which landings are used to estimate
 value. (as shown in Figure 2.1). The estimated value of the project development area will therefore be
 calculated as the value of landings from the area weighted by effort to give a calculated value for the
 development. These can then be used in conjunction with data gathered through other sources,
 including consultation.

5.1.2 Value based on ScotMap inshore fisheries data
 ScotMap inshore fisheries data layers are based upon consultation with inshore fishing fleets in
 Scottish waters. Based upon reported value of catch taken from known fishing grounds a GIS data
 layer is produced in 4.21 km 2 cells.

 The Marine EIA boundary area straddles two cells, therefore its value can be estimated from its
 proportion contribution to the total fishable area in each cell.

5.2 Calculation

5.2.1 Value based on ICES landings data and VMS tracking
 The average annual value of landings from ICES rectangle 43E7, within which the development is
 located, is £173,848.78 for the years 2009 – 2013.

 The Marine Licence Boundary covers an area of 0.77 km2 (Figure 5.1) within ICES rectangle 43E7
 (3,361 km2). Using the standard methodology outlined above of multiplying these areas by the
 average intensities within each gives a ‘vessels per day’, or effort value. The effort within the Marine
 Licence Boundary area is 0.026 vessels / day whilst the effort for the wider 43E7 area is 6.478 vessels
 /day. By proportioning out the total value of ICES rectangle 43E7 (£173,848.78) by the relative effort

Report No. 14/J/3/06/2582/1774 Page 24
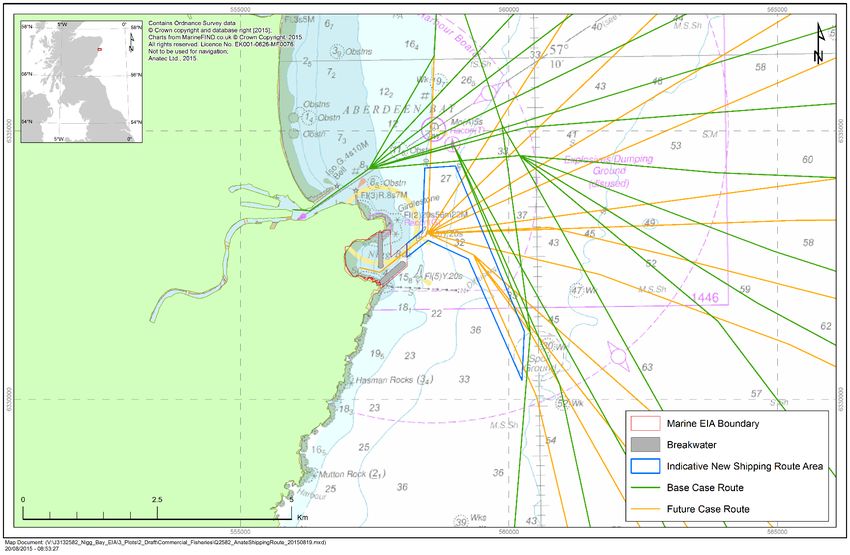
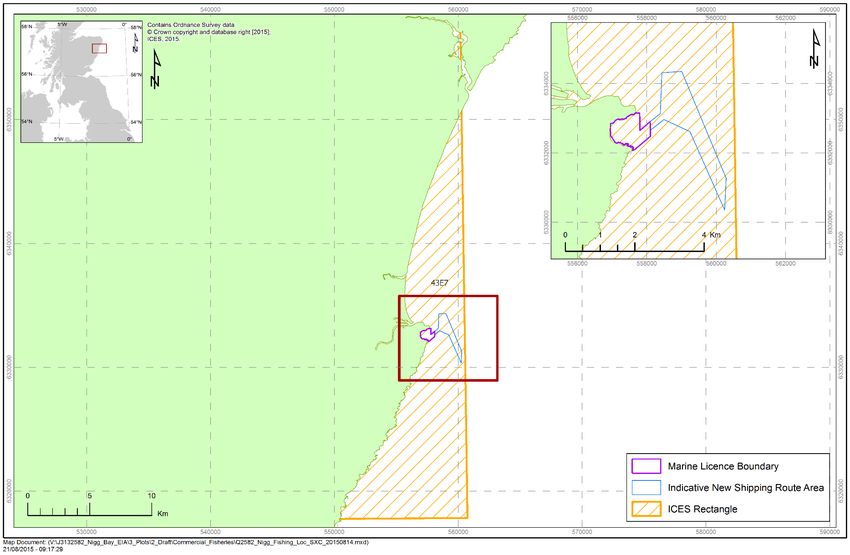
ABERDEEN HARBOUR EXPANSION PROJECT:
BASELINE ASSESSMENT FOR COMMERCIAL FISHERIES

 an estimation for value of £693.18 per annum for the Marine Licence Boundary area is made. This
 calculation is provided below.

 VNigg = Value of Nigg bay Marine Licence Area

 V43E7 = Mean annual value of ICES rectangle 43E7

 ENigg = Effort within Nigg Bay Marine Licence Area (vessels /day)

 E43E7 = Effort within ICES Rectangle 43E7 (vessels / day)

 43 7
 = ( ) ×
 43 7

 £173,848.78
 = × 0.026 = £693.18
 6.478

 Therefore using Seafish’s Best Practice Guidance for Fishing Industry Financial and Economic Impact
 Assessments (2012) and using 5 years of landings data, the intensity weighted annual value of the
 development area to the commercial fishing fleet is £693.18.

 Additional effects may be felt outside of the Marine Licence Boundary area where new shipping routes
 transit out of the new harbour. Baseline shipping routes from the existing harbour and predicted future
 shipping routes from the new harbour identified from ES Appendix 21-A: Shipping and Navigation are
 displayed in Figure 5.2. This additional are covers 2.4 km2 (Figure 5.2) within ICES rectangle 43E7
 (3,361 km2). Using the same methodology outlined above, the effort within the transit routes area is
 0.101 vessels / day, whilst the effort for the wider 43E7 area is 6.478 vessels /day. By proportioning
 out the total value of ICES rectangle 43E7 (£173,848.78) by the relative effort an estimation for value
 of £2,863.11 for the additional area covered by transit routes which may be subject to secondary
 effects. This calculation is provided below.

 Vroutes = Value of the area covered by new routes

 V43E7 = Mean annual value of ICES rectangle 43E7

 Eroutes = Effort within the area covered by new routes (vessels /day)

 E43E7 = Effort within ICES Rectangle 43E7 (vessels / day)

 43 7
 = ( ) ×
 43 7

 £173,848.78
 = × 0.107 = £2,863.11
 6.478

Report No. 14/J/3/06/2582/1774 Page 25
ABERDEEN HARBOUR EXPANSION PROJECT:
BASELINE ASSESSMENT FOR COMMERCIAL FISHERIES

 Figure 5.1 Areas used in the calculation of fishing value based upon ICES landings and VMS tracking data

Report No. 14/J/3/06/2582/1774 Page 26
ABERDEEN HARBOUR EXPANSION PROJECT:
BASELINE ASSESSMENT FOR COMMERCIAL FISHERIES

 Figure 5.2 Identification of area impacted by new shipping routes

Report No. 14/J/3/06/2582/1774 Page 27
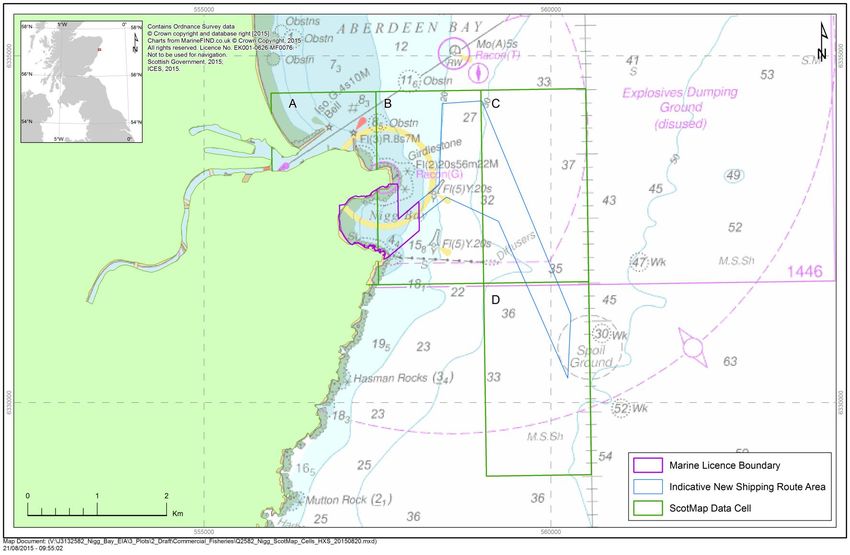
ABERDEEN HARBOUR EXPANSION PROJECT:
BASELINE ASSESSMENT FOR COMMERCIAL FISHERIES

5.2.2 Value based on ScotMap inshore fisheries data
 The Marine Licence Boundary area sits within two cells of the ScotMap data (Figure 5.3, a and b). The
 western of the two cells has a value of £2,055.32 and a sea area of 1.47 km 2, of which 0.36km 2 is
 within the Marine Licence Boundary area. The eastern of the two cells has a value of £5,985.50 and a
 sea area of 4.16km2, of which 0.41km 2 is within the Marine Licence Boundary area. Proportioning the
 value of each ScotMap cell by the amount of its fishable area covered by the Marine Licence
 Boundary area gives an estimation of value for the fishing of £1,097.52. This calculation is provided
 below.

 VNigg = Value of Nigg Bay Marine Licence Area

 Va = Value of ScotMap western cell

 Vb = Value of ScotMap eastern cell

 Aa = Fishable area of western ScotMap cell

 Ab = Fishable area of eastern ScotMap cell

 ANigga = Area of Nigg Bay Marine Licence area within western ScotMap cell

 ANiggb = Area of Nigg Bay Marine Licence area within eastern ScotMap cell

 = ( × ) + ( × )

 £2,055.32 £5,985.50
 = ( × 0.36 2 ) + ( × 0.41 2 ) = £1,097.52
 1.47 2 4.16 2

 Additional effects may be felt outside of the Marine Licence Boundary area where new shipping routes
 transit out of the new harbour. This additional are covers 2.4 km2 (Figure 5.2) over three cells of the
 ScotMap data (Figure 5.3, b, c and d). Cell b has a value of £5,985,48 and a sea area of 4.16 km2, of
 which 0.95 km2 is within the new shipping routes area. Cell C has a value of £2,735.35 and a sea area
 of 4.21km2, of which 1.03km 2 is within the new shipping routes area. Cell D has a value of £5,921.15
 and a sea area of 4.21km 2, of which 0.42km2 is within the new shipping routes area.

 Proportioning the value of each ScotMap cell by the amount of its fishable area covered by the new
 shipping routes area gives an estimation of value for the fishing of £2,626.81. This calculation is
 provided below.

 VRoute = Value of new shipping routes area

 Vb = Value of ScotMap cell b

Report No. 14/J/3/06/2582/1774 Page 28
ABERDEEN HARBOUR EXPANSION PROJECT:
BASELINE ASSESSMENT FOR COMMERCIAL FISHERIES

 Vc = Value of ScotMap cell c

 Vd = Value of ScotMap cell d

 Ab = Fishable area of ScotMap cell b

 Ac = Fishable area of ScotMap cell c

 Ad = Fishable area of ScotMap cell d

 ARouteb = Area of new shipping routes area within ScotMap cell b

 ARoutec = Area of new shipping routes area within ScotMap cell c

 ARouted = Area of new shipping routes area within ScotMap cell d

 = ( × ) + ( × ) + ( × )

 £5,985.50 £2,735.35 £5,921.15
 = ( 2
 × 0.95 2 ) + ( 2
 × 1.03 2 ) + ( × 0.42 2 ) = £2,626.81
 4.16 4.21 4.21 2

Report No. 14/J/3/06/2582/1774 Page 29
ABERDEEN HARBOUR EXPANSION PROJECT:
BASELINE ASSESSMENT FOR COMMERCIAL FISHERIES

 Figure 5.3 Overview of ScotMap cells and Marine Licence Boundary

Report No. 14/J/3/06/2582/1774 Page 30
ABERDEEN HARBOUR EXPANSION PROJECT:
BASELINE ASSESSMENT FOR COMMERCIAL FISHERIES

6. OVERVIEW OF POTENTIAL IMPACTS

6.1 Implications for fisheries during the construction phase
 During the construction phase fishing vessels will be displaced from the development area. This has
 the potential to impact upon adjacent fishing grounds as local vessels will be forced to use other
 areas, where space allows. The magnitude of the impact is considered to be low as the displacement
 area is small. The sensitivity of receptor is considered to be low as comparatively few vessels target
 the area and there are similar grounds located along the coast to the south. Ongoing dialogue is
 recommended with the consultation respondents to mitigate any likely impacts on their activity as a
 direct result of the development.

 Indirect impacts may arise where there is potential for key fish and shellfish habitats to be impacted.
 Consultation responses indicated that the stony reefs in the North and South of the Bay are key
 breeding grounds for lobster and crab. The EIA will ensure that a thorough assessment of likely
 impacts on these grounds is undertaken.

 The navigational safety and indirect impacts on commercial fishing resource will be considered in the
 ES in context of the findings of the navigation and shipping assessment.

6.2 Implications for fisheries during operational phase
 Post construction, exclusion areas may be instigated by AHB to ensure navigational safety within the
 harbour and on the approach to the harbour. Additionally, the physical changes may impact on the
 baseline activity, specifically the potting focusing on lobsters and crabs which target the rock bottom
 where the increase in the number of vessels utilising the area and routes out of the harbour has the
 potential to produce a physical barrier to fishing activity. This will cause a loss of fishing resource and
 increased pressure on other similar areas. The magnitude of the impact is low as the area lost is small
 in comparison to the available grounds. The value of the commercial fishing in the area is low in
 context of the wider region and therefore the sensitivity of the receptor is low. However ongoing
 consultation with local fishermen is recommended to identify any specific concerns.

6.3 Adverse impacts on commercially exploited fish and shellfish populations
 This technical report considers the direct impact on commercial fishing activity. Indirect impact from
 effects on commercial fish populations will be considered in relation to the fish ecology impact
 assessment as part of the ES. Salmon and sea trout are not fished directly within the development
 area and therefore there will be no direct impact; however, the possible indirect impact will be
 considered in reference to the fish and shellfish ecology impact assessment within the ES.

7. CONCLUSIONS
 The area of the development is small and contributes to inshore fisheries targeting lobsters and crabs
 using creel gear; however, similar grounds are available in the vicinity. The offshore commercial
 fishing fleets do not target the development area. The value of the area is low and therefore the
 majority of impacts are considered to be minor, impacting upon a few local vessels.

Report No. 14/J/3/06/2582/1774 Page 31
ABERDEEN HARBOUR EXPANSION PROJECT:
BASELINE ASSESSMENT FOR COMMERCIAL FISHERIES

8. REFERENCES
 Baxter, J.M., Boyd, I.L., Cox, M., Donald, A.E., Malcolm, S.J., Miles, H., Miller, B., Moffat, C.F.,
 (Editors) (2011) Scotland's Marine Atlas: Information for the national marine plan. Marine Scotland,
 Edinburgh. pp. 191.

 Brown & May Marine Ltd (2011a) Neart Na Gaoithe Offshore Wind Farm Commercial Fisheries
 Assessment. Produced for Mainstream Renewable Power Ltd. Ref: NnG Comm.Fish March 2011.

 Brown & May Marine Ltd (2011b) Neart Na Gaoithe Offshore Wind Farm Salmon and Sea Trout
 Fisheries Technical Report. Produced for Mainstream Renewable Power Ltd. Ref: NnG-SSTFA-02,
 October 2011.

 EMU (EMU Limited) (2012) Neart na Gaoithe Offshore Wind Farm Environmental Statement.
 Produced for Mainstream Renewable Power Ltd, Ref: 12/J/1/06/1664/1354.

 ICES (International Council for the Exploration of the Sea) (2003) Report of the Working Group on
 Nephrops Stocks. ICES CM 2003/ACFM:18 (mimeo).

 Kafas, A., Jones, G., Watret, R., Davies, I., Scott, B., (2012). Representation of the use of marine
 space by commercial fisheries in marine spatial planning. ICES CM I:23

 Marine Scotland (2013) Collecting the Marine Scotland salmon and sea trout fishery statistics. Topic
 Sheet no. 67 V3 2013.

 Marine Scotland (2013) Salmon and Sea Trout Catch Statistics. Rod catch (retained), rod catch
 (released), fixed engine, and net and coble datasets.

 Scottish Government (2014) 2013 Vessel and Employment Table [online]. Available from:
 http://www.gov.scot/Topics/Statistics/Browse/Agriculture-Fisheries/PubFisheries/2013vesselemploy

 Scottish Government (2014) Fishing Effort and Quantity and Value of Landings by ICES Rectangle,
 years 2009 to 2013 [online]. Available from:
 http://www.scotland.gov.uk/Topics/Statistics/Browse/Agriculture-Fisheries/RectangleData.

 Seafish (2012). Best Practice Guide for Fishing Industry Financial and Economic Assessments
 [online]. Available from:
 http://www.seafish.org/media/634910/ukfen%20ia%20best%20practice%20guidance.pdf

Report No. 14/J/3/06/2582/1774 Page 32
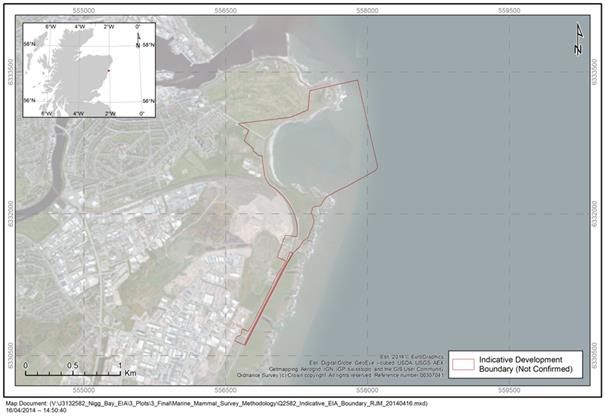
ABERDEEN HARBOUR EXPANSION PROJECT: BASELINE ASSESSMENT FOR COMMERCIAL FISHERIES APPENDIX A Nigg Bay – Aberdeen Harbour Development Background Due to a rapid expansion of activities in and around Aberdeen Harbour the Harbour Board is looking to expand its capacity and facilities. The proposed Aberdeen Harbour Development (AHD) would occupy a large proportion of Nigg Bay, comprising approximately 1400m of new quays (13-14 new berths). The indicative site boundary of the AHD, including for the extent of plant and associated operational areas, is illustrated below. The facility will be designed to accommodate the following: Offshore construction/decommissioning/dive support vessels of up to 145m in length; Platform support vessels in excess of 90m in length; Cruise vessels; Passenger and vehicle ferries – new generation ferries; Liquid bulk vessels – primarily small product carriers of fuels up to 10,000 dwt; General cargo vessels. This is an important stage of the project whereby we are looking to gather as much information as possible from you regarding your activities in and around this area. This will all feed into the planning process. Please email back your responses by the 12th January 2015. Report No. 14/J/3/06/2582/1774 Page 33
ABERDEEN HARBOUR EXPANSION PROJECT:
BASELINE ASSESSMENT FOR COMMERCIAL FISHERIES

Name

Vessel Name and number

Contact Details (phone and email)

Question 1

Can you please describe any commercial fishing activity which you undertake in the proposed
development area? (please feel free to mark on the map above)

Question 2

Can you please indicate as to whether this proposed development will hinder your access to
areas where you currently fish?

Report No. 14/J/3/06/2582/1774 Page 34
ABERDEEN HARBOUR EXPANSION PROJECT:
BASELINE ASSESSMENT FOR COMMERCIAL FISHERIES

Question 3

Can you please indicate which species you currently fish for and at which times of year?

Question 4

Can you please indicate any other effect which you believe this development could have on your
commercial activities?

Question 5

Is there anyone else that you believe should be contacted regarding their commercial fishing
activities in this area?

Report No. 14/J/3/06/2582/1774 Page 35
ABERDEEN HARBOUR EXPANSION PROJECT:
BASELINE ASSESSMENT FOR COMMERCIAL FISHERIES

Question 6
We are interested to know how you could like to be kept informed regarding progress with this
development? Please tick which you prefer?

By Letter

Open Meeting

By phone

Thank you for completing the questionnaire.

Report No. 14/J/3/06/2582/1774 Page 36
You can also read