Monitoring river discharge with remotely sensed imagery using river island area as an indicator
←
→
Page content transcription
If your browser does not render page correctly, please read the page content below
Monitoring river discharge with
               remotely sensed imagery using river
               island area as an indicator

               Feng Ling
               Xiaobin Cai
               Wenbo Li
               Fei Xiao
               Xiaodong Li
               Yun Du

Downloaded From: http://remotesensing.spiedigitallibrary.org/ on 09/12/2012 Terms of Use: http://spiedl.org/terms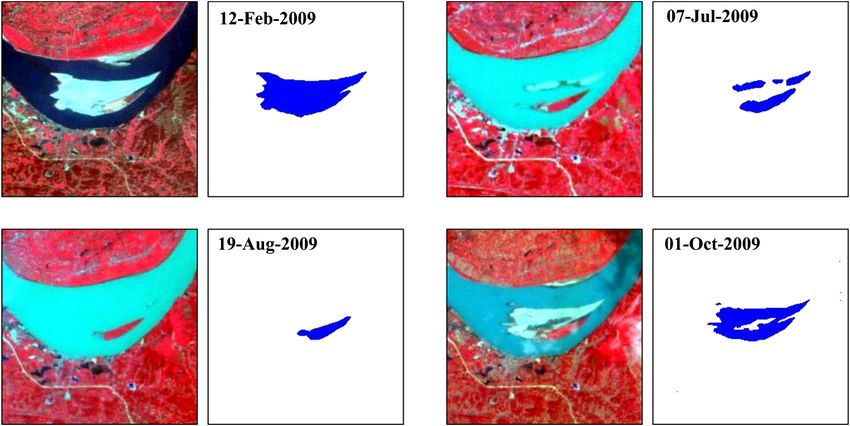
Monitoring river discharge with remotely sensed
                                      imagery using river island area as an indicator

                                     Feng Ling,a Xiaobin Cai,a Wenbo Li,b Fei Xiao,a Xiaodong Li,a and
                                                                 Yun Dua
                                a
                                    Institute of Geodesy and Geophysics, Chinese Academy of Sciences, Key Laboratory for
                                     Environment and Disaster Monitoring and Evaluation, Hubei Province, Wuhan, China
                                                                         duyun@whigg.ac.cn
                                          b
                                           Institute of Intelligent Machines, Chinese Academy of Sciences, Hefei, China

                              Abstract. River discharge is an important parameter in understanding water cycles, and con-
                              sistent long-term discharge records are necessary for related research. In practice, discharge
                              records based on in situ measurement are often limited because of technological, economic,
                              and institutional obstacles. Satellite remote sensing provides an attractive alternative way to mea-
                              sure river discharge by constructing an empirical rating curve between the parameter provided by
                              remote sensing techniques and simultaneous ground discharge data. River width is a popular
                              parameter for constructing the empirical curve, since change in river discharge can be repre-
                              sented by a change in river width. In some rectangular channels, however, river width does
                              not change significantly with river discharge, so an alternative parameter is necessary. We ana-
                              lyze a novel technique using river island area as an indicator of discharge. A river island often has
                              a flat terrain, and its area decreases with higher discharge. This technique is validated by three
                              river islands in the Yangtze River in China. All 61 remotely sensed images acquired by the
                              HuanJing (HJ) satellites from 2009 to 2010 were correlated with corresponding in situ discharge
                              of the nearby Zhicheng hydrological station. The performance of fitted curves for inferring river
                              discharge is validated using 36 HJ images taken in 2011, and the influence of remotely sensed
                              imagery and river islands is discussed. All three river islands can be used as indicators of river
                              discharge, although their performances are much different. For the river island with the best
                              result, the mean accuracy of the estimates is less than 10% of the observed discharge,
                              and all relative errors are within 20%, validating the effectiveness of the proposed method.
                              © 2012 Society of Photo-Optical Instrumentation Engineers (SPIE). [DOI: 10.1117/1.JRS.6.063564]

                              Keywords: river discharge; remote sensing; river islands; HuanJing satellite.
                              Paper 12091 received Apr. 4, 2012; revised manuscript received Jul. 6, 2012; accepted for pub-
                              lication Jul. 25, 2012; published online Sep. 12, 2012.

                              1 Introduction
                              River discharge, which has been widely used for flood hazard mitigation, water resource man-
                              agement, and relative hydrology studies, is an important and basic parameter in understanding
                              water cycles.1–5 River discharge is often measured through in situ gauging stations run by local
                              governments. Although the importance of river discharge measurement has been widely recog-
                              nized, consistent long-term in situ river discharge records are still limited for large areas, due to
                              technological, economic, and institutional obstacles. This makes it hard for discharge records to
                              satisfy practical needs.2
                                  In contrast to traditional in situ measurements, satellite remote sensing provides an attractive
                              alternative technique for obtaining river discharge records.2,5–7 Using various satellite remote sen-
                              sing data, worldwide river discharges can be inferred on an efficient and economical basis.
                              Although this technique is still not as accurate as in situ measurements, it has several important
                              advantages. For example, it can be applied to rivers that cross international borders, where obtain-
                              ing in situ records are often difficult because of national policy issues. Moreover, remote sensing

                              0091-3286/2012/$25.00 © 2012 SPIE

                              Journal of Applied Remote Sensing                 063564-1                               Vol. 6, 2012

Downloaded From: http://remotesensing.spiedigitallibrary.org/ on 09/12/2012 Terms of Use: http://spiedl.org/terms
Ling et al.: Monitoring river discharge with remotely sensed imagery using river island area : : :
can be applied to some areas that are difficult to reach or where in situ measurement is impossible.
Given the potential advantages of satellite remote sensing for river discharge measurement, this
technique has been greatly developed recently, and several big projects are under way, such as the
Surface Water and Ocean Topography mission proposed by the National Aeronautics and Space
Administration (NASA) and the Centre National d'Etudes Spatiales (CNES).2,8,9
Generally, measuring river discharge directly by satellite is impossible, because remote sen-
sing techniques still cannot access bathymetric information in most cases,10–12 and in situ cross-
sectional technologies are still needed to provide this information.5,13 Thus, a popular approach
at present is extracting useful hydrologic parameters using remote sensing technologies and then
correlating these parameters with simultaneous ground discharge data to construct an empirical
rating curve.6,14 This process is conceptually similar to the traditional method used in permanent
gauging stations, except that a parameter derived by remote sensing replaces the in situ measured
parameter. To calibrate the coefficients effectively using simultaneous in situ measurements, a
suitable parameter has to be provided by remote sensing to compare with discharge measure-
ments. At present, with different remote sensing data, various kinds of parameters are used, such
as water levels from altimetry and inundation areas from remote sensing images.6,13–30
River width (or surface water area) is one of the most popular available parameters for infer-
ring river discharge provided by remote sensing. Previous research demonstrated that river width
is a useful indicator of river discharge, and it is nearly as robust as stage-based (water level)
discharge estimation in some areas.17,26,27 Theoretically, the basic concept of this technique
is that river width generally increases with increasing river discharge, and this technique is
often suited to large rivers where the change in river width caused by discharge fluctuation
can be extracted precisely by remote sensing images. In nearly rectangular channels, however,
river width may change very little with the fluctuation in discharge. Although the subtle change
could be monitored by very high-resolution remote sensing images, using river width to infer the
discharge in this case is difficult, due to the high cost and low temporal resolution of very high-
resolution remote sensing images.30 This condition, which may be common at many locations in
large rivers, suggests that other parameters should be used to infer river discharge from space,
particularly for rivers where width variation with discharge is not pronounced.
Most rivers possess various features sensitive to relatively small discharge changes, such as
sidebars and islands.18 In general, a river island area often shows significant changes as the river
rises, even if the river width does not change due to the presence of vertical embankment. The
objective of this work is to investigate the application of remotely sensed data for discharge esti-
mation using river island area as an alternative to river width in monitoring discharge in a river with
embankment. The technique described in this study was validated in the Yangtze River in China.
2 Methodology
2.1 Study Area
The Yangtze River (Changjiang), which is more than 6,300 km long, is the largest and longest
river in China and the third-longest river in the world. The source of the Yangtze River lies in the
Qinghai–Tibetan Plateau in southwestern China. The river flows from west to east and empties
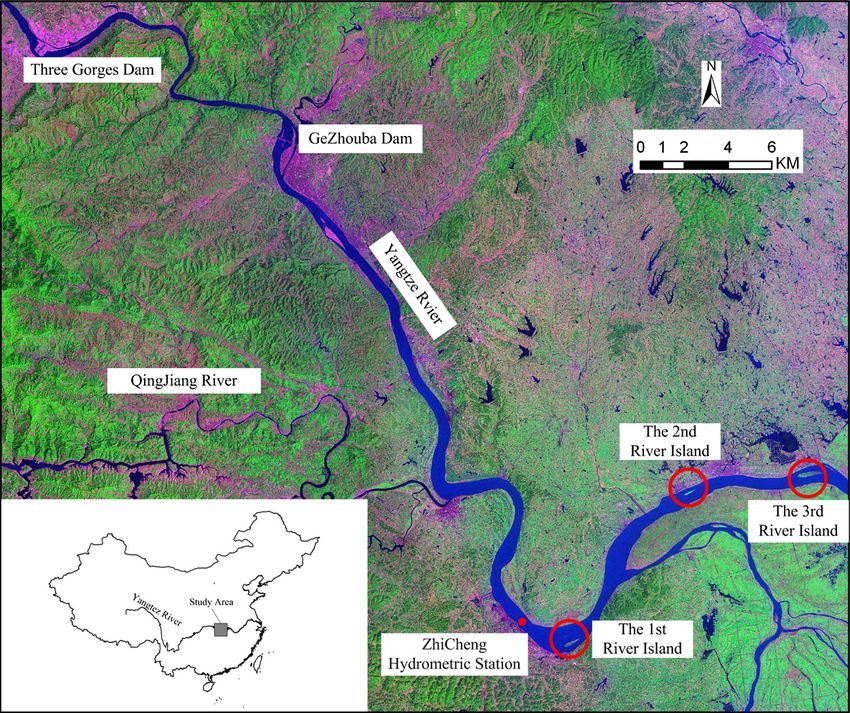
into the East China Sea. Three river islands in the middle reach of the Yangtze River, indicated by
red circles in Fig. 1, have been studied to validate the proposed method. The first river island is
located approximately 105 km downstream of the famous Three Gorges Dam and 67 km down-
stream of the Gezhouba Dam. From the Three Gorges Dam to the island, the Yangtze River is a
single-channel system, and the riverbank in this section has been controlled to prevent flooding.
The other two river islands are located 18 km and 30 km downstream of the first river island.
There is a branched tributary, whose width is about a tenth of the main channel width of the
Yangtze River, between the first and second river islands.
The Zhicheng hydrological station is located near the first river island, offering the possibility
of validating the proposed method with in situ discharge records. Since 1937, the highest dis-
charge value in this hydrological station has been 71; 900 m3 ∕s, the lowest discharge has been
2; 720 m3 ∕s, and the average discharge has been 14; 700 m3 ∕s. At present, the flow discharge in
Journal of Applied Remote Sensing 063564-2 Vol. 6, 2012
Downloaded From: http://remotesensing.spiedigitallibrary.org/ on 09/12/2012 Terms of Use: http://spiedl.org/terms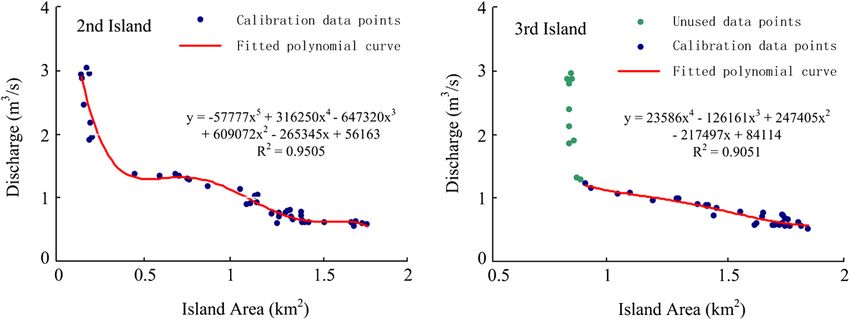
Ling et al.: Monitoring river discharge with remotely sensed imagery using river island area : : :

                              Fig. 1 Location map of the study site. The river islands under study are marked by the red circles,
                              and the Zhicheng hydrometric station is indicated by the red point.

                              the area being studied is mainly controlled by the operation of both reservoirs and the discharge
                              of the QingJiang River, a large tributary of the Yangtze River located approximately 25 km
                              upstream.

                              2.2 Remotely Sensed Imagery
                              The primary data source for the study is a series of HuanJing (HJ)-1A/1B satellite images. The
                              HJ-1A and HJ-1B satellites are China’s two small environment satellites launched in September
                              2008. HJ-1A includes a multi-spectral imager and an interferometric imaging spectrometer. HJ-
                              1B includes an infrared scanner and the same multi-spectral imager that HJ-1A carries. The two
                              sun-synchronous circular-orbit satellites have an orbital altitude of 649 km, and a constellation
                              provides an observation revisit cycle every two days. The single CCD imagery width is 360 km,
                              and the nadir ground resolution is 30 m. Their spectra range from 430 to 900 nm with four
                              spectral bands similar to the first four bands of the landsat thematic mapper (TM) and Enhanced
                              TM Plus (ETMþ) satellites. At present, the satellite imaging area can cover large parts of China,
                              India, Pakistan, Kazakhstan, Mongolia, South Korea, North Korea, Japan, the Philippines, and
                              Thailand. Since HJ-1A and HJ-1B have the same 30-m spatial resolution as Landsat TM∕ETMþ
                              imagery but higher temporal resolution, they have played an important role in environmental
                              protection and disaster assessment.31,32
                                 The multi-spectral CCD imagery, which covers the extent of the area of interest from 2009 to
                              2011, was used as the input data set. We selected and downloaded scenes when the island under
                              study was not covered by clouds. The resulting data set comprised 97 full scenes, including 28
                              scenes in 2009, 33 scenes in 2010, and 36 scenes in 2011. All images were Level 2 products,
                              which have been radiometrically and geometrically corrected using a systematic model without
                              ground control points in the GeoTIFF format. They are in the UTM Zone 49N projection and
                              WGS_84 datum.

                              2.3 Discharge Estimation Method
                              A common way to predict the discharge using parameters acquired by remotely sensed images
                              (e.g., river width or inundation areas) is to correlate these parameters with the simultaneous

                              Journal of Applied Remote Sensing                  063564-3                                        Vol. 6, 2012

Downloaded From: http://remotesensing.spiedigitallibrary.org/ on 09/12/2012 Terms of Use: http://spiedl.org/terms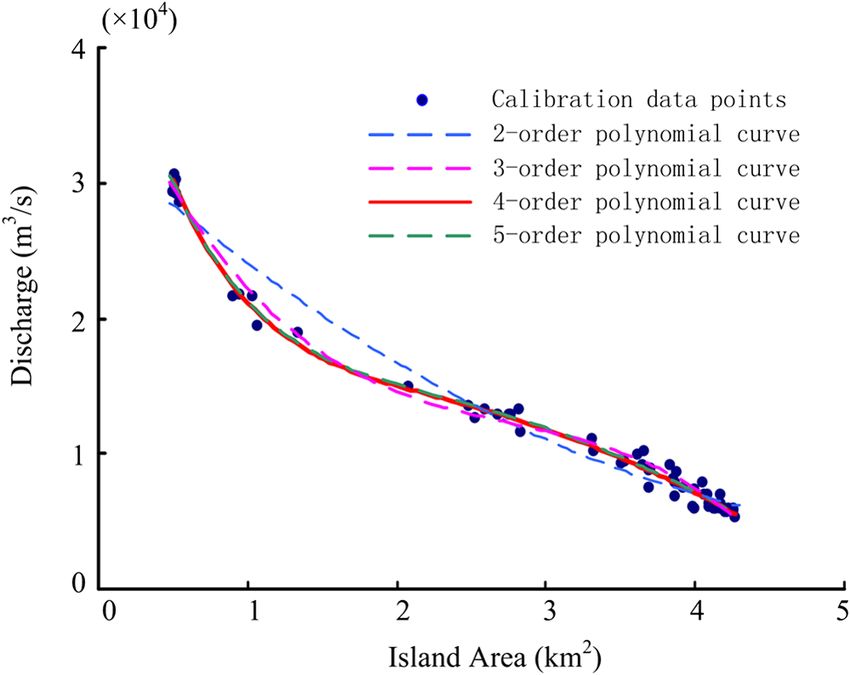
Ling et al.: Monitoring river discharge with remotely sensed imagery using river island area : : :

                              Fig. 2 Four HJ images and extracted water bodies in the area under study acquired at different
                              dates.

                              discharge records at or near a gauging station. The basis of this technique is finding a parameter
                              that can be provided easily and precisely by remotely sensed imagery and is sensitive to the
                              change in river discharge. In the study area, the river channel is controlled by manmade banking,
                              and the river width, a widely used parameter, changes only slightly, even with a highly fluc-
                              tuating water level or discharge. This slight change can hardly be detected by remotely sensed
                              imagery with medium spatial resolution, such as the HJ imagery; thus, predicting exactly the
                              river discharge using the river width is impossible.
                                  The river island area is sensitive to fluctuations in river water level. In general, when the water
                              level increases, more island area is submerged under water, and the island area monitored by
                              remote sensing decreases accordingly. As the island often has a flat terrain, a little increase in
                              water level can induce a remarkable decrease in the island area above the water. Four HJ images
                              acquired at different dates in the study area are shown in Fig. 2. Obviously, the river width is
                              basically unchanged during these four periods, although several small point bars appear out of
                              the water. By contrast, the island area above the water changes sharply, showing that it is more
                              sensitive to the change in water stage than the river width.
                                  Therefore, the island area is considered an indicator of river discharge that can be monitored
                              with remote sensing imagery. Since the island area is always determined by the water stage, and
                              the river stage is closely related to river discharge, the river island area can be used to predict river
                              discharge. To convert the island area acquired by remote sensing imagery to river discharge, we
                              first need to establish the relationship between the island area and the river discharge. With the
                              island area extracted by remote sensing imagery and the corresponding ground measurements of
                              discharge, correlations between the island area and river discharge can be determined. Once this
                              “remote” relationship at the monitoring site has been established, it can be used to estimate
                              directly the river discharge from satellite data.

                              2.4 Island Area Extraction
                              To establish the relationship between the island area and river discharge, extracting precisely the
                              island area from remotely sensed imagery is a crucial step.
                                  The multi-spectral images acquired by the HJ-1A and HJ-1B satellites were geometrically
                              corrected using only a systematic model, and large geometric error exists. Then all images have
                              to be registered prior to the extraction of the island area. A Landsat TM image downloaded from
                              the Global Land Cover Facility Website (http://glcf.umiacs.umd.edu/), which has been precision-
                              and terrain-corrected, was used as the reference. Points of control were manually selected for the
                              registration, and the nearest neighbor technique was adopted for the interpolation to preserve the
                              original digital values of the images. All root mean square error (RMSE) values were within
                              one pixel (30 × 30 m), using a second-degree polynomial. A subset area was then selected

                              Journal of Applied Remote Sensing                 063564-4                                        Vol. 6, 2012

Downloaded From: http://remotesensing.spiedigitallibrary.org/ on 09/12/2012 Terms of Use: http://spiedl.org/terms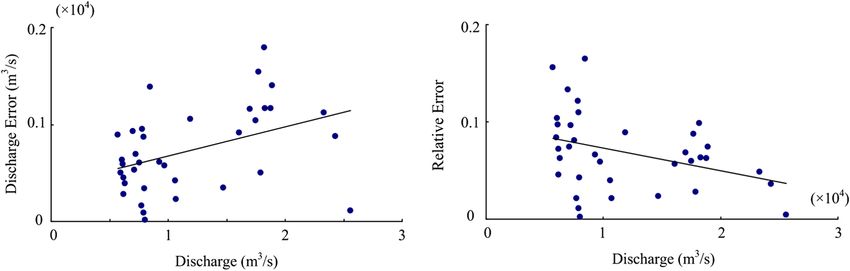
Ling et al.: Monitoring river discharge with remotely sensed imagery using river island area : : :

                              in the scene encompassing the island being studied and adjacent water areas to simplify the
                              island extraction procedure.
                                  To enhance the difference between the island (vegetation/soil) and the surrounding water, the
                              normalized difference water index (NDWI) was calculated31 by
                                                                                           ρGreen − ρNIR
                                                                            NDWI ¼                       ;                                     (1)
                                                                                           ρGreen þ ρNIR

                              where ρGreen and ρNIR are the green and the near-infrared bands in the remote sensing imagery,
                              respectively. They correspond to bands 2 and 4 on the HJ multi-spectral images. Each calculated
                              NDWI image was then thresholded to sort out land from water pixels. To mitigate the effects of
                              temporally varying conditions, the threshold was computed for each scene using the Otsu method,
                              a dynamic threshold method using the rule of maximum between-class variance and minimum
                              within-class variance to determine the threshold value.31,33,34 This process produced a binary island
                              map for each scene, as shown in Fig. 2, and was used to calculate the island area.

                              3 Results and Discussion

                              3.1 Discharge Prediction with the First River Island

                              3.1.1 Area-discharge curve fitting
                              The first river island was used to validate the proposed method. To establish the relationship
                              between the island area and river discharge, two-year data sets from 2009 and 2010, including
                              61 remotely sensed images, were used in fitting the area-discharge curve. Although a power-law
                              curve is widely used to fit the relationship between water depth and discharge, this kind of curve
                              is not suitable for directly fitting the relationship between the island area and discharge, because
                              the geomorphological features of the island are often complex. The polynomial equation was
                              used to fit this relationship. Table 1 shows the results fitted by polynomial equations with dif-
                              ferent orders, including the fitting equation, R-squared, and RMSE.
                                   From the results shown in Table 1, the discharge is shown to be highly correlated with the
                              island area. Even with a simple second-order polynomial equation, the value of R-squared
                              reaches 0.972, showing the existence of an area-discharge relationship. A detailed comparison
                              of the fitted polynomial equations with different orders reveals that the fourth-order polynomial
                              equation shows a good performance, as it has the lowest RMSE and an R-squared value of
                              0.9935, only 0.0001 less than that of the fifth-order polynomial equation. All fitted polynomial
                              curves are shown in Fig. 3, and the fourth-order polynomial curve is considered as the resulting
                              fitted curve.

                              3.1.2 Discharge prediction
                              From the fitted polynomial equation, the river discharge can be inferred using the island area
                              extracted from HJ CCD imagery. In this study, all 36 scenes from 2011 were used to validate the

                              Table 1 Fitted polynomial equations using island areas extracted by HJ satellites and the
                              corresponding observed discharges from the Zhicheng hydrological station in the period from
                              2009 to 2010.

                              Fitted polynomial equation with different orders                                               R-squared      RMSE

                              y ¼ 827.5 × x 2 − 9767 × x þ 32180                                                              0.9722        1253

                              y ¼ −1011 × x 3 þ 8419 × x 2 − 25790 × x þ 40470                                                0.9904        743.9

                              y ¼ 367.68 × x 4 − 4622.2 × x 3 þ 20363 × x 2 − 40726 × x þ 45847                               0.9935        616.4

                              y ¼ −81.82 ×   x5   þ 1367.2 ×   x4   − 9098.2 ×   x3   þ 29252 ×   x2   − 48196 × x þ 47906    0.9936        618.7

                              Journal of Applied Remote Sensing                          063564-5                                      Vol. 6, 2012

Downloaded From: http://remotesensing.spiedigitallibrary.org/ on 09/12/2012 Terms of Use: http://spiedl.org/terms
Ling et al.: Monitoring river discharge with remotely sensed imagery using river island area : : :
Fig. 3 Fitted polynomial curves with different orders using the calibration data points for 2009 and
2010 for the first river island.
Fig. 4 Predicted discharge plotted against observed discharge for the validation data set using the
fitted fourth-order polynomial equation with HJ and MODIS imagery from 2011 for the first river
island.
performance of the fitted area-discharge curve. The prediction discharge was compared with the
in situ measurement, and the results are shown in Fig. 4 and Table 2. A good result was obtained
with the proposed method, and the predicted and the observed discharges had a high correlation
(R2 ¼ 0.981). Quantitative analysis showed that the largest difference between the observed and
the predicted discharges was −1;794 m3 ∕s on July 29, whose in situ discharge measurement was
18; 200 m3 ∕s. Generally, all relative errors were less than 20%. The highest relative error was
16.43% on November 25, and the lowest relative error was −0.2% on April 26. The mean accu-
racy of the estimates was less than 10% of the observed discharge, showing the effectiveness of
the proposed model.
The discharge and relative errors versus the discharge values are shown in Fig. 5. The dis-
charge error increases with the increase in the discharge values, mainly because of the feature of
the fitted curve (Fig. 3), which is related to the local geomorphology of the island terrain. The
curve is steeper for higher discharge values, meaning that the error in the extracted island area
could lead to a larger error in the predicted discharge. By contrast, larger discharges correspond
to lower relative error, because the variance in the discharge error is less than that in the discharge
Journal of Applied Remote Sensing 063564-6 Vol. 6, 2012
Downloaded From: http://remotesensing.spiedigitallibrary.org/ on 09/12/2012 Terms of Use: http://spiedl.org/termsLing et al.: Monitoring river discharge with remotely sensed imagery using river island area : : :
Table 2 Dates of HJ and MODIS image captures over the first river island, derived island areas,
and corresponding predictions. A short line means that the image was covered by clouds.
HJ imagery MODIS imagery
Measured Island Calculated Discharge Island Calculated Discharge
discharge area discharge error Relative area discharge error Relative
Date (m3 ∕s) (km2 ) (m3 ∕s) (m3 ∕s) error (km2 ) (m3 ∕s) (m3 ∕s) error
12-Jan-2011 6970 3.85 7900 930 13.34% – – – –
24-Jan-2011 7960 3.90 7620 −340 −4.27% – – – –
3-Feb-2011 6300 4.07 6694 394 6.25% 4.59 4149 −2151 −34.14%
4-Feb-2011 6090 4.06 6724 634 10.40% 4.38 5069 −1021 −16.77%
6-Feb-2011 5700 4.08 6590 890 15.61% 3.90 7639 1939 34.02%
20-Feb-2011 6210 4.07 6660 450 7.24% 4.70 3791 −2419 −38.95%
24-Feb-2011 5970 4.11 6472 502 8.40% 4.22 5880 −90 −1.51%
8-Mar-2011 6140 4.06 6734 594 9.68% 4.48 4580 −1560 −25.40%
12-Mar-2011 6200 4.10 6481 281 4.54% 4.06 6749 549 8.85%
27-Mar-2011 7910 3.86 7825 −85 −1.08% – – – –
29-Mar-2011 7730 3.91 7565 −165 −2.14% 4.64 3960 −3770 −48.77%
18-Apr-2011 7520 3.81 8128 608 8.09% 4.22 5880 −1640 −21.81%
24-Apr-2011 7210 3.85 7905 695 9.63% 2.99 11961 4751 65.90%
26-Apr-2011 8030 3.83 8014 −16 −0.20% – – – –
28-Apr-2011 7120 3.89 7648 528 7.42% 4.80 3522 −3598 −50.53%
18-May-2011 9280 3.47 9893 613 6.61% 4.22 5880 −3400 −36.64%
27-May-2011 10700 3.25 10929 229 2.14% 3.36 10418 −282 −2.63%
29-May-2011 10600 3.41 10182 −418 −3.95% 3.58 9369 −1231 −11.61%
28-Jun-2011 24300 0.74 25181 881 3.62% 0.64 26966 2666 10.97%
4-Jul-2011 17000 1.70 15839 −1161 −6.83% 0.80 24076 7076 41.62%
6-Jul-2011 14700 2.14 14350 −350 −2.38% 2.40 13694 −1006 −6.85%
8-Jul-2011 25600 0.72 25487 −113 −0.44% – – – –
20-Jul-2011 17700 1.63 16158 −1542 −8.71% 1.81 15366 −2334 −13.19%
24-Jul-2011 18300 1.45 17136 −1164 −6.36% – – – –
26-Jul-2011 17500 1.57 16463 −1037 −5.93% 3.74 8521 −8979 −51.31%
28-Jul-2011 17900 1.41 17395 −505 −2.82% 2.83 12504 −5396 −30.14%
29-Jul-2011 18200 1.58 16406 −1794 −9.86% 1.81 15366 −2834 −15.57%
12-Aug-2011 23300 0.78 24422 1122 4.82% 0.85 23238 −62 −0.27%
14-Aug-2011 16100 1.47 17013 913 5.67% 2.51 13421 −2679 −16.64%
18-Aug-2011 18900 1.08 20302 1402 7.42% 1.17 19320 420 2.22%
23-Sep-2011 18800 1.38 17632 −1168 −6.21% 2.03 14671 −4129 −21.96%
27-Sep-2011 11900 2.68 12958 1058 8.89% 1.71 15791 3891 32.70%
7-Oct-2011 7820 3.69 8770 950 12.14% 3.58 9369 1549 19.81%
9-Oct-2011 7920 3.69 8789 869 10.97% 3.95 7342 −578 −7.30%
19-Nov-2011 9710 3.39 10284 574 5.91% 4.16 6165 −3545 −36.51%
25-Nov-2011 8460 3.48 9850 1390 16.43% 3.90 7639 −821 −9.70%
Journal of Applied Remote Sensing 063564-7 Vol. 6, 2012
Downloaded From: http://remotesensing.spiedigitallibrary.org/ on 09/12/2012 Terms of Use: http://spiedl.org/termsLing et al.: Monitoring river discharge with remotely sensed imagery using river island area : : :
Fig. 5 Predicted discharge and relative errors plotted against observed discharge for the
validation data set using the fitted fourth-order polynomial equation and HJ imagery for the
first river island.
values. From Table 2, a similar trend shows that higher relative errors often occur in days with
lower discharge, and lower relative error values occur in days with higher discharge. For exam-
ple, relative errors larger than 10% all have discharges lower than 8; 500 m3 ∕s. By contrast,
when the discharge values are larger than 10; 000 m3 ∕s, all relative errors are less than 10%.
3.1.3 Error sources
The error in the extracted island area is the main cause of the error in the predicted discharge
values. In this study, the island boundary was extracted using NDWI with a threshold value.
Considering the complexity of land cover classes, a threshold value alone is not always precise
enough to distinguish the island from the surrounding water. Another factor is the spatial resolu-
tion of the remote sensing imagery. The HJ pixel resolution is 30 m × 30 m, and the pixels
located in the water and land boundaries are often mixed pixels. This indicates that the boundary
pixels contain water and land simultaneously, and merely assigning them to either water or land
is inaccurate.
Another error comes from the in situ observation discharge value. On the one hand, the daily
discharge values used in this study were estimated from a stage discharge rating curve, and the
uncertainty involved in this method inevitably affects the result. On the other hand, the island
area and the discharge need to be coincident with respect to time under ideal conditions. In this
study, however, only the discharge measured at 8:00 a.m. is available, while the passing time
of the HJ satellites is approximately 10:30 a.m. The daily fluctuation of the discharge in the
Zhicheng hydrological station can reach about 10%, based on the Three Gorges hydropower
station operation. This inconsistency not only affects the fitted area-discharge curve but also
brings uncertainty to the validation result.
3.2 Comparison of Different Remotely Sensed Imagery
In the aforementioned analysis, only multi-spectral images acquired by the HJ satellites were
used to extract the island area. In practice, more satellite images can be selected and used. For
example, some medium-resolution remotely sensed imagery, such as Landsat TM∕ETMþ,
advanced spaceborne thermal emission and reflection radiometer (ASTER), and advanced syn-
thetic aperture radar (ASAR) images, can be used to produce a comprehensive data set with high
temporal resolution.35 The moderate resolution imaging spectroradiometer (MODIS) imagery is
a possible data source, as well. Although MODIS has a spatial resolution of only 250 m for the
red and near infrared bands (841 to 875 nm), it can provide two images of a given region per day
for the whole globe freely. The short revisiting period of MODIS will increase the practicability
of the proposed method to a large extent, once the prediction errors caused by the low spatial
resolution are in control.
In order to analyze the differences between HJ and MODIS images for island area and river
discharge estimation caused by their different spatial resolutions, the proposed method was
applied to MODIS imagery in 2011. Compared with HJ imagery, more cloud-free MODIS images
Journal of Applied Remote Sensing 063564-8 Vol. 6, 2012
Downloaded From: http://remotesensing.spiedigitallibrary.org/ on 09/12/2012 Terms of Use: http://spiedl.org/termsLing et al.: Monitoring river discharge with remotely sensed imagery using river island area : : :
covering the first island are available, meaning that MODIS can provide a higher temporal
resolution result. In this study, however, only MODIS scenes acquired in the days in which
cloud-free HJ images are available were analyzed for comparison. The MODIS surface-
reflectance product (MOD09) generated from data of Terra were downloaded from https://
lpdaac.usgs.gov/. The near infrared band data were thresholded to extract the island area.13
Using the fitted fourth-order polynomial curve, the river discharge is then predicted with the
estimated island area.
Island areas and river discharges estimated with MODIS imagery are shown in Fig. 4 and
Table 2. Overall, although the MODIS results were worse than those of HJ images, the correla-
tion coefficient between the predicted and observed discharges still reached 0.7562. Quantitative
analysis showed that the largest difference between the observed and predicted discharges was
−8; 979 m3 ∕s on July 26, because the estimated island area of MODIS was larger than twice of
that of the HJ images. Relative errors were mostly less than 50%, except those from April 24,
April 28, and July 26, showing the effectiveness of MODIS imagery. Large discharge prediction
errors are due to the coarse spatial resolution and the image distortion caused by the bowtie
effect, which made the island areas estimated from MODIS much different from the HJ esti-
mates. In practice, there are two potential approaches to overcoming this shortcoming. The
first one is using spectral unmixing to estimate the island area at the sub-pixel scale and reduce
the error of predicted discharge caused by island area error.36 The second method is using not
actual island areas, but the surface reflectance itself to predict the river discharge directly, as that
can provide more sensitive measurements.18,37
3.3 Comparison of Different River Islands
In addition to the first river island, the second and the third river islands were studied to further
validate the performance of the proposed method. For each river island, the area-discharge curve
was first fitted using two-year data sets in 2009 and 2010. River discharges in 2011 were then
predicted with island areas extracted from HJ images by using the fitted curve. For both islands,
the fitted curves are shown in Fig. 6, and the prediction results are shown in Table 3 and Fig. 7,
respectively.
For the second river island, the fifth-order polynomial curve was considered as the final fitted
curve by comparing the performance of polynomial equations with different orders. The results for
the second island were worse than those for the first island, although the correlation coefficient
between the predicted and observed discharges reached 0.9606. Most of relative errors were larger
than 10%, and the highest relative error was 51.73%. Moreover, when measured discharges were
larger than 10; 000 m3 ∕s, all predicted discharges were overestimated, and the relative errors ran-
ged from 8.35% to 23.63%. This bias is caused mainly by the fitted polynomial curve, as shown in
Fig. 6. The used calibration data points have different change trends due to the geomorphological
feature of the second island. When the island area was larger than 0.3 km2 , the island area
decreased slowly with the increase in the discharge values. By contrast, when the island area
was less than 0.3 km2 , it had only little change with the increase in the discharge values.
Fig. 6 Fitted polynomial curves using the calibration data points in 2009 and 2010 for the second
and third river islands.
Journal of Applied Remote Sensing 063564-9 Vol. 6, 2012
Downloaded From: http://remotesensing.spiedigitallibrary.org/ on 09/12/2012 Terms of Use: http://spiedl.org/termsLing et al.: Monitoring river discharge with remotely sensed imagery using river island area : : :
Table 3 Dates of HJ image captures over the second and third river islands, derived island areas,
and corresponding predictions. A short line means that the image was covered by clouds. A cross
means that the discharge was not predicted, because the third river island cannot be used as an
indicator for river discharge when its area is less than 0.9 Km2 .
Second island Third island
Measured Island Calculated Discharge Island Calculated Discharge
discharge area discharge error Relative area discharge error Relative
Date (m3 ∕s) (km2 ) (m3 ∕s) (m3 ∕s) error (km2 ) (m3 ∕s) (m3 ∕s) error
12-Jan-2011 6970 1.17 8639 1669 23.95% 1.66 6820 −150 −2.15%
24-Jan-2011 7960 1.22 8045 85 1.07% 1.59 7388 −572 −7.19%
3-Feb-2011 6300 1.29 7232 932 14.80% 1.66 6825 525 8.33%
4-Feb-2011 6090 1.28 7265 1175 19.30% 1.80 6032 −58 −0.95%
6-Feb-2011 5700 1.30 7098 1398 24.52% 1.70 6508 808 14.18%
20-Feb-2011 6210 1.12 9422 3212 51.73% 1.69 6570 360 5.80%
24-Feb-2011 5970 1.35 6672 702 11.75% 1.77 6145 175 2.93%
8-Mar-2011 6140 1.38 6474 334 5.44% 1.61 7240 1040 16.77%
12-Mar-2011 6200 1.30 7086 886 14.28% 1.75 6219 −1691 −21.38%
27-Mar-2011 7910 1.23 7811 −99 −1.25% 1.70 6534 −1196 −15.47%
29-Mar-2011 7730 1.24 7720 −10 −0.12% 1.59 7379 −141 −1.87%
18-Apr-2011 7520 1.27 7358 −162 −2.15% 1.78 6109 −1101 −15.27%
24-Apr-2011 7210 1.33 6878 −332 −4.61% 1.65 6897 −1133 −14.11%
26-Apr-2011 8030 1.22 7941 −89 −1.10% 1.74 6293 −827 −11.62%
28-Apr-2011 7120 1.28 7348 228 3.20% 1.31 9627 347 3.74%
18-May-2011 9280 0.93 11879 2599 28.00% 0.96 11751 −349 −2.88%
27-May-2011 10700 0.80 12885 2185 20.42% 1.24 10023 −677 −6.33%
29-May-2011 10600 0.87 12465 1865 17.59% – – – –
28-Jun-2011 24300 – – – – – – – –
4-Jul-2011 17000 – – – – 0.89 × × ×
6-Jul-2011 14700 – – – – – – – –
8-Jul-2011 25600 – – – – 0.92 12109 −13491 −52.70%
20-Jul-2011 17700 0.21 21883 4183 23.63% 0.85 × × ×
24-Jul-2011 18300 0.21 21985 3685 20.14% 0.86 × × ×
26-Jul-2011 17500 0.23 20557 3057 17.47% 0.92 12065 −5435 −31.06%
28-Jul-2011 17900 0.22 21168 3268 18.25% 0.88 × × ×
29-Jul-2011 18200 0.21 21711 3511 19.29% 0.88 × × ×
12-Aug-2011 23300 0.15 27509 4209 18.06% 0.89 × × ×
14-Aug-2011 16100 0.24 19346 3246 20.16% 0.88 × × ×
18-Aug-2011 18900 0.21 22092 3192 16.89% 0.93 11950 −6950 −36.77%
23-Sep-2011 18800 – – – – – – – –
27-Sep-2011 11900 0.60 12894 994 8.35% – – – –
7-Oct-2011 7820 1.21 8092 272 3.48% 1.59 7406 −414 −5.30%
9-Oct-2011 7920 1.62 6159 −1761 −22.24% 1.67 6750 −1170 −14.77%
19-Nov-2011 9710 1.17 8711 −999 −10.29% 1.47 8391 −1319 −13.58%
25-Nov-2011 8460 1.25 7601 −859 −10.16% 1.32 9540 1080 12.76%
Journal of Applied Remote Sensing 063564-10 Vol. 6, 2012
Downloaded From: http://remotesensing.spiedigitallibrary.org/ on 09/12/2012 Terms of Use: http://spiedl.org/termsLing et al.: Monitoring river discharge with remotely sensed imagery using river island area : : :
Fig. 7 Predicted discharge plotted against observed discharge for the validation data set using
the fitted polynomial equations with HJ imagery from 2011 for the second and third river
islands.
Using the fitted polynomial curve, the calibration points with discharge of about 20; 000 m3 ∕s
were all overestimated, leading to the overestimated predicted discharge in this range.
For the third island, a change trend similar to that for the second island was noticed for the
area-discharge data points in 2009 and 2010 used for calibration. The third island has a steep
high ground with an area of about 0.9 km2 . When the discharge reaches about 12; 000 m3 ∕s, the
whole island is submerged except for this high ground. However, with the increase of discharge,
only a small part of the high ground is submerged, and this change cannot be detected by the
remotely sensed imagery used in this study. Thus, when the island area was larger than 0.9 km2 ,
the island area decreased slowly with the increase of the discharge value. When the island area
was less than 0.9 km2 , it remained about the same for different discharge values. As a result,
when the island area is less than 0.9 km2 , the island cannot be used as an indicator of river
discharge anymore. In this study, a fourth-order polynomial curve is fitted using data points
with an island area of larger than 0.9 km2 and then is used to predict the river discharge.
The result in Table 3 shows that the prediction has a high accuracy when the island area is
much larger than 0.9 km2 . By contrast, when the island area was close to 0.9 km2 , as it
was on July 8, July 26, and August 18, the relative error was high. This is mainly caused
by the uncertainty of the extracted island area.
Although the prediction results are not as good as those for the first river island, the second
and third river islands can be used to predict river discharge effectively with the proposed
method. Meanwhile, the results showed that choosing a suitable river island is important for
the application of the proposed technique in practice. The first factor is the change in the
river island. For all techniques to predict the discharge from a certain parameter extracted
by remotely sensed imagery, the relationship between discharge and the parameter must remain
stable. Thus, the island used for this needs to be permanent. Some early developed islands,
whose topographic features are heavily influenced by sediment discharge, are unsuitable for
application. The amount of sandbar classified as island area and the growth of the island,
which will increase the estimated island area, also needs attention. Secondly, the geomorpho-
logical feature is critical to the performance of the proposed method. The slope of terrain for the
river island should not be too steep to ensure island area change caused by discharge fluctuation
can be extracted precisely from remote sensing images. The island should not be completely
covered by water when the discharge is high enough; otherwise, the area-discharge relationship
loses its effectiveness. Finally, the island should be located spatially near the in situ site, in order
to ensure the change of island area corresponds to the change of river discharge, and in situ
measurements can be used to extract and validate the area-discharge curve.
Journal of Applied Remote Sensing 063564-11 Vol. 6, 2012
Downloaded From: http://remotesensing.spiedigitallibrary.org/ on 09/12/2012 Terms of Use: http://spiedl.org/termsLing et al.: Monitoring river discharge with remotely sensed imagery using river island area : : :
4 Conclusions
Remote sensing is a promising technology for inferring water discharge. The key concept of this
method is the selection of a suitable parameter that can be easily obtained from satellite imagery
to correlate with the measured discharge. As a common feature in many rivers, islands can be
employed as a useful indicator of the change in river discharge, since they have a flat terrain, and
the uncovered island area changes rapidly with the change in discharge. In the present study, a
river island area has been used as an indicator to monitor river discharge. The proposed technique
was validated by three islands in the Yangtze River in China. All 61 remotely sensed images
acquired by the HJ satellites from 2009 to 2010 were used to construct the empirical rating curve,
and the fitted curve was validated using 36 HJ images taken in 2011. The results showed that all
three islands can be used as an indicator of river discharge, although their performances are much
different. For the island with the best result, the mean accuracy of the estimates was less than
10% of the observed discharge, and all relative errors were less than 20% compared with in situ
measurements, showing the effectiveness of the proposed method.
Acknowledgments
This work was supported in part by the National Basic Research Program of China
(No. 2012CB417001) and the Knowledge Innovation Program of the Chinese Academy of
Sciences (No. kzcx2-yw-141).
References
1. D. E. Alsdorf and D. P. Lettenmaier, “Tracking fresh water from space,” Science 301(5639),
1485–1488 (2003), http://dx.doi.org/10.1126/science.1089802.
2. D. E. Alsdorf, E. Rodriguez, and D. P. Lettenmaier, “Measuring surface water from space,”
Rev. Geophys. 45(2), RG2002 (2007), http://dx.doi.org/10.1029/2006RG000197.
3. H. Middelkoop et al., “Impact of climate change on hydrological regimes and water
resources management in the rhine basin,” Climatic Change 49(1–2), 105–128 (2001),
http://dx.doi.org/10.1023/A:1010784727448.
4. B. Nijssen et al., “Predicting the discharge of global rivers,” J. Climate 14(15), 3307–3323
(2001), http://dx.doi.org/10.1175/1520-0442(2001)0142.0.CO;2.
5. L. C. Smith, “Satellite remote sensing of river inundation area, stage, and discharge: a
review,” Hydrolog. Process. 11(10), 1427–1439 (1997), http://dx.doi.org/10.1002/(ISSN)
1099-1085.
6. D. M. Bjerklie et al., “Estimating discharge in rivers using remotely sensed hydraulic infor-
mation,” J. Hydrol. 309(1–4), 191–209 (2005), http://dx.doi.org/10.1016/j.jhydrol.2004.11
.022.
7. Q. H. Tang et al., “Remote sensing: hydrology,” Progr. Phys. Geogr. 33(4), 490–509
(2009), http://dx.doi.org/10.1177/0309133309346650.
8. S. Biancamaria et al., “Preliminary characterization of SWOT hydrology error budget
and global capabilities,” IEEE J. Sel. Top. Appl. Earth Observ. Remote Sens. 3(1),
6–19 (2010), http://dx.doi.org/10.1109/JSTARS.2009.2034614.
9. M. Durand et al., “The surface water and ocean topography mission: observing terrestrial
surface water and oceanic submesoscale eddies,” Proc. IEEE 98(5), 766–779 (2010), http://
dx.doi.org/10.1109/JPROC.2010.2043031.
10. J. S. Bailly et al., “Geostatistical estimations of bathymetric LiDAR errors on rivers,” Earth
Surf. Process. Landf. 35(10), 1199–1210 (2010), http://dx.doi.org/10.1002/esp.v35:10.
11. P. J. Kinzel et al., “Evaluation of an experimental LiDAR for surveying a shallow, braided,
sand-bedded river,” J. Hydraul. Eng. 133(7), 838–842 (2007), http://dx.doi.org/10.1061/
(ASCE)0733-9429(2007)133:7(838).
12. C. K. Wang and W. D. Philpot, “Using airborne bathymetric lidar to detect bottom type
variation in shallow waters,” Rem. Sens. Environ. 106(1), 123–135 (2007), http://dx.doi
.org/10.1016/j.rse.2006.08.003.
Journal of Applied Remote Sensing 063564-12 Vol. 6, 2012
Downloaded From: http://remotesensing.spiedigitallibrary.org/ on 09/12/2012 Terms of Use: http://spiedl.org/termsLing et al.: Monitoring river discharge with remotely sensed imagery using river island area : : :
13. L. C. Smith and T. M. Pavelsky, “Estimation of river discharge, propagation speed, and
hydraulic geometry from space: Lena river, Siberia,” Water Resour. Res. 44(3),
W03427 (2008), http://dx.doi.org/10.1029/2007WR006133.
14. D. M. Bjerklie et al., “Evaluating the potential for measuring river discharge from space,”
J. Hydrol. 278(1–4), 17–38 (2003), http://dx.doi.org/10.1016/S0022-1694(03)00129-X.
15. D. Alsdorf et al., “Water level changes in a large Amazon lake measured with spaceborne
radar interferometry and altimetry,” Geophys. Res. Lett. 28(14), 2671–2674 (2001), http://
dx.doi.org/10.1029/2001GL012962.
16. D. E. Alsdorf, L. C. Smith, and J. M. Melack, “Amazon floodplain water level changes
measured with interferometric SIR-C radar,” IEEE Trans. Geosci. Rem. Sens. 39(2),
423–431 (2001), http://dx.doi.org/10.1109/36.905250.
17. P. Ashmore and E. Sauks, “Prediction of discharge from water surface width in a braided
river with implications for at-a-station hydraulic geometry,” Water Resour. Res. 42(3),
W03406 (2006), http://dx.doi.org/10.1029/2005WR003993.
18. G. R. Brakenridge et al., “Orbital microwave measurement of river discharge and ice status,”
Water Resour. Res. 43(4), W04405 (2007), http://dx.doi.org/10.1029/2006WR005238.
19. S. Calmant, F. Seyler, and J. F. Cretaux, “Monitoring continental surface waters by satellite
altimetry,” Surv. Geophys. 29(4–5), 247–269 (2008), http://dx.doi.org/10.1007/s10712
-008-9051-1.
20. M. Durand et al., “Estimating river depth from remote sensing Swath interferometry mea-
surements of river height, slope, and width,” IEEE J. Sel. Top. Appl. Earth Observ. Remote
Sens. 3(1), 20–31 (2010), http://dx.doi.org/10.1109/JSTARS.2009.2033453.
21. F. Frappart et al., “Interannual variations of river water storage from a multiple satellite
approach: a case study for the Rio Negro river basin,” J. Geophys. Res. Atm. 113(D21),
D21104 (2008), http://dx.doi.org/10.1029/2007JD009438.
22. J. Negrel, P. Kosuth, and N. Bercher, “Estimating river discharge from earth observation
measurements of river surface hydraulic variables,” Hydrol. Earth Syst. Sci. 15(6),
2049–2058 (2011), http://dx.doi.org/10.5194/hess-15-2049-2011.
23. F. Papa, C. Prigent, and W. B. Rossow, “Monitoring flood and discharge variations in the
large Siberian rivers from a multi-satellite technique,” Surv. Geophys. 29(4–5), 297–317
(2008), http://dx.doi.org/10.1007/s10712-008-9036-0.
24. T. M. Pavelsky and L. C. Smith, “Remote sensing of hydrologic recharge in the Peace-
Athabasca Delta, Canada,” Geophys. Res. Lett. 35(8) (2008), http://dx.doi.org/10.1029/
2008GL033268.
25. G. Schumann et al., “Progress in integration of remote sensing-derived flood extent and
stage data and hydraulic models,” Rev. Geophys. 47, RG4001 (2009), http://dx.doi.org/
10.1029/2008RG000274.
26. L. C. Smith et al., “Estimation of discharge from three braided rivers using synthetic aper-
ture radar satellite imagery: potential application to ungaged basins,” Water Resour. Res.
32(7), 2021–2034 (1996), http://dx.doi.org/10.1029/96WR00752.
27. L. C. Smith et al., “Estimation of discharge from braided glacial rivers using ERS-1 syn-
thetic-aperture radar—first results,” Water Resour. Res. 31(5), 1325–1329 (1995), http://dx
.doi.org/10.1029/95WR00145.
28. W. C. Sun, H. Ishidaira, and S. Bastola, “Towards improving river discharge estimation in
ungauged basins: calibration of rainfall-runoff models based on satellite observations of
river flow width at basin outlet,” Hydrol. Earth Syst. Sci. 14(10), 2011–2022 (2010),
http://dx.doi.org/10.5194/hess-14-2011-2010.
29. Q. H. Tang et al., “Satellite-based observations of hydrological processes,” Int. J. Remote
Sens. 31(14), 3661–3667 (2010), http://dx.doi.org/10.1080/01431161.2010.483496.
30. K. Q. Xu et al., “Estimating river discharge from very high-resolution satellite data: a case
study in the Yangtze river, China,” Hydrolog. Process. 18(10), 1927–1939 (2004), http://dx
.doi.org/10.1002/(ISSN)1099-1085.
31. S. L. Lu et al., “Water body mapping method with HJ-1A/B satellite imagery,” Int. J. Appl.
Earth Observ. Geoinfo. 13(3), 428–434 (2011), http://dx.doi.org/10.1016/j.jag.2010.09
.006.
Journal of Applied Remote Sensing 063564-13 Vol. 6, 2012
Downloaded From: http://remotesensing.spiedigitallibrary.org/ on 09/12/2012 Terms of Use: http://spiedl.org/termsLing et al.: Monitoring river discharge with remotely sensed imagery using river island area : : :
32. L. G. Zhou et al., “Atmospheric correction of HJ-1 CCD data for water imagery based on
dark object model,” Spectrosc. Spect. Anal. 31(8), 2238–2242 (2011), http://dx.doi.org/10
.3964/j.issn.1000-0593(2011)08-2238-05.
33. G. Schumann et al., “Near real-time flood wave approximation on large rivers from space:
application to the river Po, Italy,” Water Resour. Res. 46, W05601 (2010), http://dx.doi.org/
10.1029/2008WR007672.
34. N. Otsu, “A threshold selection method from gray-level histograms,” IEEE Trans. Syst. Man
Cybern. 9(1), 62–66 (1979), http://dx.doi.org/10.1109/TSMC.1979.4310076.
35. S. L. Powell et al., “Moderate resolution remote sensing alternatives: a review of Landsat-
like sensors and their applications,” J. Appl. Remote Sens. 1(1), 012506 (2007), http://dx.doi
.org/10.1117/1.2819342.
36. D. J. Weiss and R. L. Crabtree, “Percent surface water estimation from MODIS BRDF
16-day image composites,” Remote Sens. Environ. 115(8), 2035–2046 (2011), http://dx
.doi.org/10.1016/j.rse.2011.04.005.
37. G. Brakenridge et al., “Space-based measurement of river runoff,” Eos 86(19), 185–188
(2005), http://dx.doi.org/10.1029/2005EO190001.
Biographies and photographs of authors not available.
Journal of Applied Remote Sensing 063564-14 Vol. 6, 2012
Downloaded From: http://remotesensing.spiedigitallibrary.org/ on 09/12/2012 Terms of Use: http://spiedl.org/termsYou can also read