Experimental study of combined low salinity and surfactant flooding effect on oil recovery
←
→
Page content transcription
If your browser does not render page correctly, please read the page content below
Oil & Gas Science and Technology – Rev. IFP Energies nouvelles 76, 4 (2021)                                                   Available online at:
Ó A. Araz & F. Kamyabi, published by IFP Energies nouvelles, 2020                                                         ogst.ifpenergiesnouvelles.fr
https://doi.org/10.2516/ogst/2020085

    REGULAR ARTICLE

Experimental study of combined low salinity and surfactant
flooding effect on oil recovery
Abdulmecit Araz1 and Farad Kamyabi2,*
1
    Sabanci University, 34956 Istanbul, Turkey
2
    Baku Higher Oil School, AZ1025 Baku, Azerbaijan

             Received: 14 July 2020 / Accepted: 29 October 2020

            Abstract. A new generation improved oil recovery methods comes from combining techniques to make the
            overall process of oil recovery more efficient. One of the most promising methods is combined Low Salinity
            Surfactant (LSS) flooding. Low salinity brine injection has proven by numerous laboratory core flood experi-
            ments to give a moderate increase in oil recovery. Current research shows that this method may be further en-
            hanced by introduction of surfactants optimized for lowsal environment by reducing the interfacial tension.
            Researchers have suggested different mechanisms in the literature such as pH variation, fines migration, multi-
            component ionic exchange, interfacial tension reduction and wettability alteration for improved oil recovery
            during lowsal injection.
            In this study, surfactant solubility in lowsal brine was examined by bottle test experiments. A series of core
            displacement experiments was conducted on nine crude oil aged Berea core plugs that were designed to deter-
            mine the impact of brine composition, wettability alteration, Low Salinity Water (LSW) and LSS flooding on
            Enhancing Oil Recovery (EOR). Laboratory core flooding experiments were conducted on the samples in a
            heating cabinet at 60 °C using five different brine compositions with different concentrations of NaCl, CaCl2
            and MgCl2. The samples were first reached to initial water saturation, Swi, by injecting connate water (high
            salinity water). LSW injection followed by LSS flooding performed on the samples to obtain the irreducible
            oil saturation.
            The results showed a significant potential of oil recovery with maximum additional recovery of 7% Original Oil
            in Place (OOIP) by injection of LS water (10% LS brine and 90% distilled water) into water-wet cores com-
            pared to high salinity waterflooding. It is also concluded that oil recovery increases as wettability changes from
            water-wet to neutral-wet regardless of the salinity compositions. A reduction in residual oil saturation, Sor, by
            1.1–4.8% occurred for various brine compositions after LSS flooding in tertiary recovery mode. The absence of
            clay swelling and fine migration has been confirmed by the stable differential pressure recorded for both LSW
            and LSS flooding. Aging the samples at high temperature prevented the problem of fines production. Combined
            LSS flooding resulted in an additional oil recovery of 9.2% OOIP when applied after LSW flooding.
            Surfactants improved the oil recovery by reducing the oil-water interfacial tension. In addition, lowsal environ-
            ment decreased the surfactant retention, thus led to successful LSS flooding. The results showed that combined
            LSS flooding may be one of the most promising methods in EOR. This hybrid improved oil recovery method is
            economically more attractive and feasible compared to separate low salinity waterflooding or surfactant flood-
            ing.

1 Introduction                                                              trapped oil and increase the drainage efficiency, more effec-
                                                                            tive and advanced recovery methods must be implemented.
It is generally recognized that after the primary and sec-                      Water flooding is the most frequently applied secondary
ondary recovery mechanisms carried out in an oil reservoir,                 method in Enhanced Oil Recovery (EOR) after natural
up to two third of the crude oil remains trapped in the reser-              depletion to maintain the reservoir pressure and mobilize
voirs due to the dominating capillary forces or poor sweep                  the remained oil in the reservoir. In the past, little intention
efficiency of the injection fluid. In order to mobilize the                   has been given to the salinity and the ion composition of the
                                                                            injection water and on its effect on oil recovery. The first
                                                                            study carried on by Martin [1] on the effect of injection
* Corresponding author: faradk@bhos.edu.az                                  brine composition and showed that decreasing the salinity
This is an Open Access article distributed under the terms of the Creative Commons Attribution License (https://creativecommons.org/licenses/by/4.0),
              which permits unrestricted use, distribution, and reproduction in any medium, provided the original work is properly cited.
2            A. Araz and F. Kamyabi: Oil & Gas Science and Technology – Rev. IFP Energies nouvelles 76, 4 (2021)

leads to higher oil recovery due to migration of clay parti-       Table 1. Mineralogy of Berea sandstone samples.
cles. Almost a decade later, Bernard [2] performed a com-
prehensive study by implementing laboratory experiments            Sample Quartz (%) Alkali feldspar (%) Pyroxene (%)
on Berea sandstone cores showing improved oil recovery             1             93                  6                 <   1
by lowering salinity of the injection brine. Since then, there
                                                                   2             91                  8                 <   1
has been growing interest in understanding the Low Salin-
ity Water (LSW) flooding mechanism which announced to               3             92                  8                 <   1
be an emerging EOR method [3].                                     4             93                  7                 <   1
    In the last decades, it has been proven by both labora-        5             91                  8                 <   1
tory and field tests that reducing the salinity of the injected
water leads to higher oil recovery [4]. Jadhunandan and
Morrow [5] showed that wettability affects waterflooding            permeability and porosity measurements of the cores are
mechanism in Crude/Oil/Brine/Rock (COBR) systems.                  measured together with the study of the phase behavior
After carrying out wide-range of experiments based on              of the surfactant to provide better understanding of the
50 Berea sandstone cores and different salt concentrations,        concepts behind waterflooding.
they have concluded that adjustment of the injection brine
composition for mature waterflood offers a possible and eco-
nomically realistic method for improving oil recovery by           2 Experimental materials and setup
wettability alteration. Tang and Morrow [6–8] and Morrow
et al. [9] studied the effect of brine composition on oil recov-   Experiments were conducted on nine Berea sandstone core
ery extensively in series of displacement experiments using        plugs taken from the same block to ensure similar properties
different crude oils and Reservoir Brine (RB) diluted by fac-      for all cores used in the analysis. Core plugs were designated
tors of 10 and 100 where 12% reduction in residual oil sat-        as B1-B1, B2-B2, B3-B3, B4-B4, B5-B5, B5-B1, B5-B2,
uration (Sor) was established.                                     B5-B3, and B5-B4. These names were given according to
    Low Salinity Water was designated as an Improved Oil           the core saturation and LSW/LSS flooding order. For
Recovery (IOR) process at the SPE/DOE Symposium on                 example, in B5-B1, the first B indicates that the core is sat-
IOR, Tulsa, in 2006. Since that time, there has been a grow-       urated with brine 5, and the second B stands for LSW/LSS
ing interest in understanding the underlying mechanism             flooding done using brine 1. The samples were first drained
behind low salinity effect and extensive body of experimen-        with connate water (high salinity water) until initial water
tal works such as Single Well Tracer Tests (SWTT) and              saturation, Swi, is established. LSW injection followed by
Log-Inject-Log (LIL) techniques have been introduced.              LSS flooding performed on the samples to obtain the irre-
Many laboratory works performed prior to application of            ducible oil saturation. Both LSW and LSW flooding carried
LSW in field scale. However, most of them are not reported          out on the samples in a heating cabinet at 60 °C. For a bet-
in the public literature [10]. The mechanism of LSW flood-          ter understanding of the conducted LSW and LSS flooding
ing is not fully understood despite the growing research and       experiment rock and fluid analysis such as porosity, perme-
interest on LSE in reservoir conditions. Many outcrop sand-        ability, density measurements were carried out on the
stones meeting the conditions of LSW have not shown any            samples.
increase in oil recovery [11, 12]. Further research in both
laboratory and field scales is necessary for a better under-        2.1 Berea sandstone
standing of the basics behind the underlying mechanism
of low salinity effect. This will also encourage the investiga-    In core flooding analyses, Berea sandstones are considered
tion of other IOR methods such as surfactant and polymer           to be standard experimental material. The mineralogy of
flooding and their potential in low salinity environment            Berea plugs was characterized by X-Ray Diffraction
[13].                                                              (XRD) analysis carried out on the five samples taken from
    Surfactant flooding is a chemical EOR technique used to         block 6. It was assumed that the obtained mineralogy was
achieve higher oil recovery by reducing the Interfacial Ten-       representative for all the core samples. These samples
sion (IFT) between oil and water, thus mobilizing capillary        mostly contained quartz, alkali feldspar and pyroxene as
trapped oil. Salinity environment affects the efficiency of         given in Table 1.
surfactants. Surfactants efficiency in lowering the IFT
depends on several factors such as brine concentration.            2.2 Brine
Therefore, surfactants combined with low salinity flooding
implemented as a new hybrid model due to low cost and              Injection brines used in the experiments were made by dis-
commercial availability.                                           solving different salts in deionized water to prepare five dif-
    This paper studies the effect of combined low salinity         ferent compositions listed in Table 2. All brines were filtered
and surfactant injection on oil recovery using nine Berea          using a 0.45 lm vacuum filter in order to remove the parti-
sandstone cores. Low salinity waterflooding with different          cles and/or any undesired obstacles from the composition.
brine compositions applied to the samples as a secondary           Total Dissolved Solid (TDS) concentration in brine ranged
recovery method, followed by Low Salinity Surfactant               from 29 000 to 32 500 ppm. As typical formation water con-
(LSS) flooding at 60 °C. Throughout the experimental                tains both divalent and monovalent ions, high salinity
work, the density of the brine concentrations as well as           water was used to establish initial water saturation, while
A. Araz and F. Kamyabi: Oil & Gas Science and Technology – Rev. IFP Energies nouvelles 76, 4 (2021) 3
Table 2. Brine composition.
Brine Composition (%) NaCl CaCl2:2H2O MgCl2:2H2O Na+ Ca+ Mg+ Cl TDS
(g/L) (g/L) (g/L) (ppm) (ppm) (ppm) (ppm) (ppm)
B1 100 NaCl 32.50 – – 12 785 – – 19 715 32 500
B2 95 NaCl, 5 CaCl2 30.875 1.362 – 11 507 741.5 – 19 055 31 303
B3 95 NaCl, 5 MgCl2 30.875 – 1.885 11 507 – 450.7 19 058 31 015
B4 90 NaCl, 5 CaCl2, 5 29.250 1.362 1.885 10 228 741.5 450.7 18 398 29 818
MgCl2
B5 90 NaCl, 9 CaCl2, 1 29.250 2.210 0.305 10 228 1335.8 89.7 18 396 30 050
MgCl2
Key: LS water was obtained by 1/10 dilutions of the brines in the list.
low salinity brines were chosen to have 10% of the listed Table 3. Compositions and properties of crude oil A.
compositions added to 90% of distilled water. LSS was pre- Composition (%)
pared by adding sodium dodecyl benzene sulfonate to LSW
solution. 61.19 Saturates
32.42 Aromatics
2.3 Oil 4.93 Resins
During the drainage and flooding experiments, crude oil A 1.46 Alphaltenes
was used to establish the minimum value of initial water sat- AN (mg KOH/g) 1.08
uration, Swi, for all cores. Crude oil densities were measured BN (mg KOH/g) 1.16
at 15 °C and 60 °C while viscosities were obtained at 20 °C Density (g/cm3) 0.86 @ 15 °C
and 60 °C. The bulk composition obtained by SARA (Satu- 0.83 @ 60 °C
rates/Aromatics/Resins/Asphaltenes) analysis, Acid Num-
API gravity 33.4
ber (AN) and Base Number (BN) were analyzed. Crude
oil was also used in aging the cores before the main flooding Viscosity (cP) 19.90 @ 20 °C
experiment. Composition and some of the important proper- 4.07 @ 60 °C
ties of crude oil A are listed in Table 3 [14].
Oil viscosity at 60 °C was noticeably lower compared to
the correspondent viscosity at 20 °C. It should be noted with the lengths of approximately 10 cm and a diameter of
that the drainage process was carried out at room temper- 3.8 cm. Before starting to carry out any measurement, the
ature different from the flooding experiment performed at cores were cleaned with a brush to remove possible dust
60 °C. particles attached to the surface of the samples. Afterwards,
they were inserted inside Soxhlet apparatus to be extracted
2.4 Surfactant with methanol for 24 h.
After the samples were cleansed with methanol, they
Sodium Dodecyl Benzene Sulfonate (SDBS) was dissolved were placed in the heating cabinet at 60 °C for one week.
in brine to prepare low salinity surfactant. SDBS, a white Water drops removal was assured after this step. Following
anionic surfactant with powder density of 0.18 g/mL and the drying process, weight of each sample was measured
molecular formula of C18H29NaO3S. It is difficult to solve with a scale of 0.001 error sensitivity.
the surfactant in brine. Therefore, for each experiment,
the surfactant was mixed with low salinity brine only after 2.7 Permeability measurements
warming it up to 60 °C.
Permeability measurements were conducted based on
2.5 Bottle test Darcy equation which relates the absolute permeability of
the rock to the dimensions of the sample, viscosity of the
Precipitation of the surfactant is an undesired process dur- fluid and the pressure drop along the sample. Thus, the
ing combination of low salinity waterflooding with surfac- sample was inserted inside a coreholder under constant
tant injection. In order to examine the concentration pressure drop of 0.5 bar and the flow rate was recorded.
range in which the surfactant does not precipitate, brine Standard value for air viscosity was taken as 0.0179 cP.
solutions with 300, 500, 1000 and 3000 ppm were warmed In 1941, Klinkenberg concluded that the measured per-
up to 60 °C and mixed with the surfactant (SDBS). meability can be bigger than the true permeability of the
rock at low pressures when gases are used as flowing fluid.
2.6 Core preparation Thus, he suggested a procedure for calibration of permeabil-
ity data obtained from measurement device. According to
To avoid any experimental error, cores were prepared very the suggested formula, absolute permeability (Kabs) can
carefully. All cores were cut consistently in the same range be calculated by extrapolating the line to infinite mean4 A. Araz and F. Kamyabi: Oil & Gas Science and Technology – Rev. IFP Energies nouvelles 76, 4 (2021)
2000
Kair = -18.93Pmean-2 + 475.28Pmean-1 + 176.67
1500
Kair (mD)
1000
500
0
0.0 1.0 2.0 3.0 4.0 5.0 Fig. 2. Schematic diagram of helium porosimeter apparatus
1/Pmean (bar-1) [15].
Fig. 1. Klinkenberg permeability correction for B1-B1.
pressure in the plot of air permeability (Kair) versus inverse
mean core pressure. Figure 1 demonstrates that the value of
Kabs for B1-B1 sample is equal to 176.67 mD.
2.8 Porosity measurements
In this experiment, helium porosimeter, which takes the
advantage of Boyle’s law, was used to determine the poros-
ity of the core samples. To do so, bulk and grain volumes of
the samples were measured. Bulk volume was calculated
using the dimensions of the core while grain volume was
evaluated using the reference and final volumes of the cham-
bers (Fig. 2). Samples were inserted inside the chamber vol-
ume of 170 cm3, and helium was applied to the core until
the pressure caliber was regulated. The value of the applied
volume was reported and subtracted from the chamber vol- Fig. 3. Porous plate apparatus.
ume to get the grain volume. Measured porosity by Helium
porosimeter was ranged from 15.40 to 19.10%.
2.8 Cores saturation pressure (1). As initial water saturation was calculated
using the produced water volume of brine and the Pore
The Berea sandstone cores were saturated using a vacuum Volume (PV) of the core, a graduated cylinder (3) was
pump. Before inserting the sample inside the cap, the connected to the bottom of the coreholder (4) with plastic
machine was run for approximately 20 min to clean all pipe (2) to measure the produced volume of brine.
the lines (vacuum and drainage) and regulate the pressure.
The samples were placed inside the container carefully 2.10 Core aging
together with the porous plates. After the vacuum was
applied for about 30 min for the purpose of cleaning, warm- After the cores were flooded by crude oil, they were inserted
ing, pressure regulation and safety issues, the already pre- into the cells and placed in a heat cabin at 80 °C for three
pared brine samples were poured into the funnel. Both weeks in order to alter the wettability from strongly water-
the core and porous plate was drained thanks to gravity wet condition. The main reason behind using high temper-
and vacuum forces. ature was to enhance the Crude Oil-Brine-Rock (COBR)
interactions. Afterwards, the cores were taken from the cells
2.9 Initial water saturation directly to the coreholder for performing the flooding
experiment.
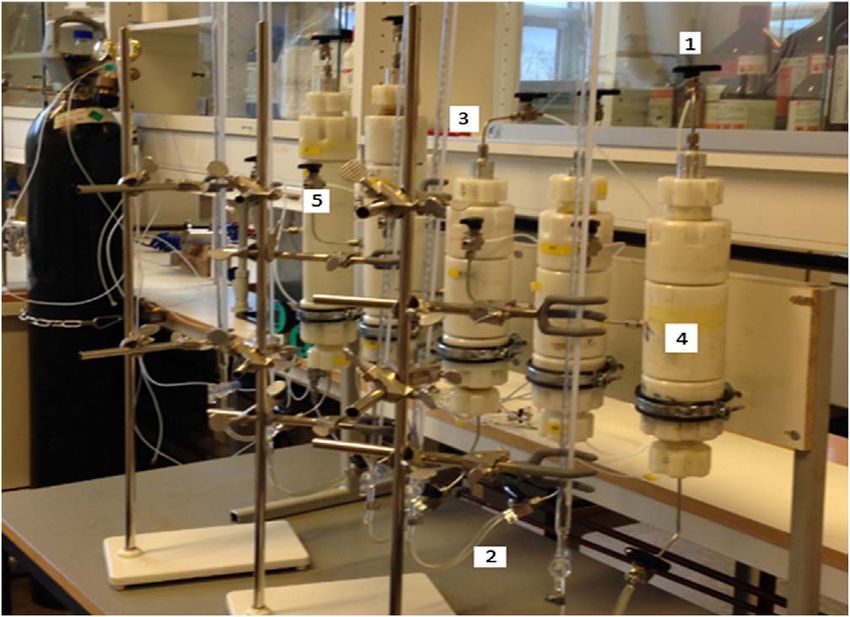
Initial water saturation was established at ambient temper-
ature using porous plate shown in Figure 3. To achieve 2.11 Flooding procedure
homogeneous saturation distribution, crude oil was injected
to the fully brine-saturated core sample inserted into the The flooding apparatus given in Figure 4 was used. The
coreholder. Beneath the sample, a small porous plate satu- tubes and coreholder were cleansed before starting the
rated with the same brine was placed. A sleeve pressure (5) flooding. Afterwards, the cores were taken from the aging
was applied and increased gradually. The displacement of cell and inserted inside the Hassler coreholder. The experi-
brine through the core occurred by introducing back ment was performed at 60 °C, and 20 bars sleeve pressureA. Araz and F. Kamyabi: Oil & Gas Science and Technology – Rev. IFP Energies nouvelles 76, 4 (2021) 5
1. Computer
2. Quizix pump
3. Low salinity brine reservoir
4. Low salinity surfactant reservoir
5. Oil reservoir
6. Heating cabinet
7. Hassler coreholder
8. Core plug
9. Differential pressure transmitter
10. Back pressure regulator
11. Effluent collector
12. High pressure nitrogen cylinder
13. Pump inlet
14. Check valve
15. Regular valve
Fig. 4. Schematic of coreflooding apparatus [16].
Table 4. Tests with same composition in injection and Table 5. Tests with different composition in injection
in-situ brines. and in-situ brine.
Test In-situ LSW LSS flooding Test In-situ LSW LSS flooding
brine flooding brine flooding
1-1 B1 (1/10) B1 Surfactant in (1/10) B1 2-1 B5 (1/10) B1 Surfactant in (1/10) B1
1-2 B2 (1/10) B2 Surfactant in (1/10) B2 2-2 B5 (1/10) B2 Surfactant in (1/10) B2
1-3 B3 (1/10) B3 Surfactant in (1/10) B3 2-3 B5 (1/10) B3 Surfactant in (1/10) B3
1-4 B4 (1/10) B4 Surfactant in (1/10) B4 2-4 B5 (1/10) B4 Surfactant in (1/10) B4
1-5 B5 (1/10) B5 Surfactant in (1/10) B5
was added gradually. The back pressure was set to 3 bar to 3.1 Bottle test results
avoid gas liberation and any back flow at high temperature.
The pump (positive displacement Quizix pump) was dis- The surfactant concentration should be as high as possible
placing fluid (brine, oil) from the reservoirs to the core plug to maximize the surfactant effect, but not too high to pre-
(number 8 in Fig. 4). To represent a typical reservoir veloc- vent surfactant precipitation. The observations of bottle
ity, flooding rate of 12 mL/h equivalent to interstitial veloc- test experiment performed at 60 °C to determine the opti-
ity range from 1.34 up to 1.66 m/day was chosen for mum concentration of the surfactant in LSS flooding are
flooding the core plugs. The pressure drop was monitored given in Table 6.
continuously during the injection by differential pressure As it can be seen from Table 6, brines B1 and B4
transmitter connected to the inlet and outlet of the Hassler showed no precipitation at any of the concentrations at
coreholder. Produced liquids were collected in 5 mL effluent the heating cabinet temperature. However, brines B2, B3
tubes at ambient temperature and atmospheric pressure. and B5 showed some cloudy solution or precipitation at
LSW and LSS floodings were performed sequentially for the concentrations of 1000 and/or 3000 ppm. Since, in this
15 h each. To ensure recovering all oil inside the core sam- study, using the same concentration for all brine composi-
ples, the injection continued for 2–3 PV after both flood- tions was preferred, the brine concentration of 500 ppm
ings, despite the stop in oil production. Tables 4 and 5 was selected for the flooding experiments.
provide summary of in-situ and injected brine compositions
for each test. 3.2 Core properties
For clear understanding of the impact of LSW and LSS on
3 Experimental results oil recovery, it is important to have similar core physical
properties in the experiment. Table 7 lists the properties of
Laboratory coreflooding experiments were conducted at the 9 cores selected out of total 23 cores taken from block 6.
60 °C using Berea sandstone coreplugs and five different As shown in Figure 3, five coreholders were used in the
brine compositions with various concentrations of NaCl, porous plate apparatus. The experiments to establish Swi
CaCl2 and MgCl2. were therefore conducted in two rounds. In the first round,6 A. Araz and F. Kamyabi: Oil & Gas Science and Technology – Rev. IFP Energies nouvelles 76, 4 (2021)
Table 6. Summary of bottle test experiment for different brines at 60 °C.
Brine SDBS (ppm) Waiting time in heating cabinet
1 day 2 days 3 days 7 days
B1 300 S, NP S, NP S, NP S, NP
500 S, NP S, NP S, NP S, NP
1000 S, NP S, NP S, NP S, NP
3000 S, NP S, NP S, NP S, NP
B2 300 S, NP S, NP S, NP S, NP
500 S, NP S, NP S, NP S, NP
1000 S, NP PB, NP PB, NP LP
3000 LC, NP C, NP C, NP P
B3 300 S, NP S, NP S, NP S, NP
500 S, NP S, NP S, NP S, NP
1000 S, NP S, NP C, NP C, NP
3000 S, NP LC, NP C, NP C, NP
B4 300 S, NP S, NP S, NP S, NP
500 S, NP S, NP S, NP S, NP
1000 S, NP S, NP S, NP S, NP
3000 S, NP S, NP S, NP S, NP
B5 300 S, NP S, NP S, NP S, NP
500 S, NP S, NP S, NP S, NP
1000 S, NP S, NP S, NP S, NP
3000 S, NP LC, NP PB, NP P, VLP
Key: S = Dissolved; NP = No precipitation; LC = Less cloudy; PB = Particles in the bottom; C = Cloudy;
P = Precipitation; LP = Low precipitation; VLP = Very low precipitation.
Table 7. Summary of cores properties.
Core ID Length (cm) Diameter (cm) Bulk volume (cm3) Kabs (mD) Porosity (%) Swi (%)
B1-B1 9.942 3.798 112.63 176.7 16.32 22.0
B2-B2 9.953 3.797 112.70 217.8 16.34 23.0
B3-B3 9.939 3.786 111.89 172.3 15.73 21.0
B4-B4 9.947 3.798 112.69 177.5 15.40 24.0
B5-B5 9.940 3.795 112.43 154.4 17.77 25.0
B5-B1 9.950 3.803 113.02 198.0 17.60 27.0
B5-B2 9.947 3.779 111.59 191.9 15.64 28.0
B5-B3 9.938 3.785 111.82 285.6 16.71 21.0
B5-B4 9.941 3.808 113.21 300.8 18.94 22.0
cores B1-B1, B2-B2, B5-B1, B5-B2, and B5-B5 were placed 3.3 Flooding experiments and production profiles
into the porous plate for 16 days. Due to the leakage in the
B5-B1 part of the porous plate, the measured saturation Each core was flooded with 10 PV of LSW followed by
values for this core showed some inconsistency. This unex- 10 PV of LSS. To ensure the recovery of all remaining oil,
pected experimental error also affected the results of core LSS injection has been extended for additional 2–3 PV.
B5-B2 which eventually caused variations in the results of Core flooding results are studied in terms of the injection
the other cores used in this round of experiment as sleeve brine and ultimate oil recovery. The recovery curves for
and injection pressures in the setup were connected to the the first and second rounds of the flooding experiment are
B5-B2 coreholder. In the second round, Swi values for cores plotted in Figures 5 and 6, respectively. To ease the inter-
B3-B3, B4-B4, B5-B3 and B5-B4 were determined. Fortu- pretation and focus on the key purpose of this study, oil
nately, no leakage was observed in this round of experi- recovery values up to 45% Original Oil in Place (OOIP),
ment, and, as Table 7 demonstrates, consistent Swi results which were practically identical for all the core samples,
were obtained. are not shown in the figures.A. Araz and F. Kamyabi: Oil & Gas Science and Technology – Rev. IFP Energies nouvelles 76, 4 (2021) 7
65 55
LSW_B1-B1 LSW_B3-B3
LSS_B1-B1 LSS_B3-B3
LSW_B2-B2 LSW_B4-B4
LSS_B2-B2 LSS_B4-B4
LSW_B5-B5 LSW_B5-B3
LSS_B5-B5 LSS_B5-B3
60 LSW_B5-B1
Oil recovery factor (%OOIP)
Oil recovery factor (%OOIP)
LSW_B5-B4
LSS_B5-B1 LSS_B5-B4
LSW_B5-B2
LSS_B5-B2
55 50
50
45 45
0 5 10 15 20 0 5 10 15 20
Injection (PV) Injection (PV)
Fig. 5. Recovery curves for cores in first round of flooding Fig. 6. Recovery curves for cores in second round of flooding
experiment. experiment.
As shown in the figures, the cores were first flooded with 100
various LSW (indicated by solid lines). Afterwards, in order 90
to further reduce residual oil saturation, the injection con- 80
Oil recovery factor (% OOIP)
46.72 42.15
tinued with LSS (indicated by dashed lines) only after 48.58 47.4 43.08
37.17
70
injecting 10 PV LSW. Therefore, after switching the flood- 48.84 49.28 49.63
ing process to LSS, due to the possible existing amount of 60
2.92 5.71 6.13
LSW in the pipes and production tubes and also for precise 50 1.42
9.23
5.94
determination of LSS flooding efficiency, the oil produced 40 2.33
2.17
3.00
from the first 0.15 PV LSS flooding was considered to be 30
a result of LSW flooding. 50.36 52.14
50.00
20 46.66 47.69 56.70
Lowsal water injection starting from initial water satu- 48.83
10 48.55
ration resulted in oil recovery ranged between 46% and 57% 47.37
OOIP. The highest oil recovery was achieved in B5-B1, 0
B1-B1 B2-B2
56.7% OOIP, where the core saturated with B5 (9% NaCl, B3-B3 B4-B4
0.9% CaCl2 and 0.1% MgCl2) and flooded with B1 (10% B5-B5
B5-B1 B5-B2
B5-B3
NaCl). Also, Swi, was the lowest (10.8%) for B5-B1 due to B5-B4
Core Sample ID
the leakage occurred during the establishment of initial
water saturations. LSW Recovery LSS Recovery Remaining Oil
Continuous injection of LSS solution resulted in high
incremental oil recovery ranged between 1.5% and 9.2% Fig. 7. Oil recovery from each flooding process for each core.
OOIP. The increment in oil recovery may be explained rea-
sonably on a basis of interactions between surfactant solu-
tion and rock surface, i.e., retention, which in turn is
closely associated with surfactant concentration [17]. The of the cores have shown consistency and varied around
highest oil recovery increments were observed in B2-B2, 2.1% OOIP. As listed in Table 8, more than 90% of LSW
B4-B4 and B5-B5, 5.71%, 5.94% and 9.2% OOIP respec- recovery was produced before Water Breakthrough
tively. A possible optimal oil recovery can be obtained by (WBT) which occurred in the first 0.30 to 0.44 PV injec-
LSW injection of B2 followed by LSS flooding using B5. tion. Further LSW injection after WBT led to small
As it can be seen from Figure 7, the highest oil recovery increase in the oil recovery ranged from 3% to 7% OOIP.
for LSS flooding was obtained by injecting B5, while injec- Change in permeability and residual oil saturations are also
tion of B2 resulted in the maximum oil production for LSW presented in Table 8.
flooding. For a better understanding of LSW impact on recovery
Generally, if the oil recovery result of B5-B1 is excluded factor, a comparison was made between the achieved results
due to the unreliable Swi value, the highest oil recoveries of LSW flooding and the traditional (high saline) water-
were obtained for the cores in which the same brine compo- flooding. As shown in Table 9, a maximum of 7% additional
sition is used for both saturating the core and flooding OOIP is expected to be produced as a result of LSW flood-
(B1-B1, B2-B2 and B3-B3). The oil recoveries for the rest ing for water-wet rocks.8 A. Araz and F. Kamyabi: Oil & Gas Science and Technology – Rev. IFP Energies nouvelles 76, 4 (2021)
Table 8. Summary of experiments.
Core ID B1-B1 B2-B2 B3-B3 B4-B4 B5-B5 B5-B1 B5-B2 B5-B3 B5-B4
Swi 0.22 0.23 0.21 0.24 0.25 0.27 0.28 0.21 0.22
Kabs (mD) 176.7 217.8 172.3 177.5 154.4 198.0 191.9 285.6 300.8
Vo (%OOIP) 13.51 13.40 13.90 13.93 12.84 12.83 12.75 15.10 13.50
Ko(Soi) (mD) 40.30 67.71 72.70 53.76 47.69 49.80 47.05 68.04 67.24
WBT (PV) 0.44 0.33 0.38 0.40 0.31 0.39 0.31 0.38 0.31
WBT recovery (%OOIP) 46.71 41.42 47.85 44.44 43.84 49.80 44.96 44.92 43.61
Time of WBT (min) 39.6 29.7 34.2 36 28.9 35.1 27.9 34.2 28.8
LSW recovery (%OOIP) 50.36 52.14 50.00 46.66 47.69 56.70 48.83 48.55 47.37
Sor-LSW 0.39 0.33 0.40 0.44 0.33 0.26 0.39 0.39 0.35
LSW Volume injected (PV) 10 10 10 10 10 10 10 10 10
Kw(Sor-LSW) (mD) 68 248 72 79 85 45 58 77 114
LSS recovery (%OOIP) 2.92 5.71 1.42 5.94 9.23 6.13 2.33 2.17 3.00
Sor-LSS 0.36 0.28 0.39 0.40 0.30 0.23 0.37 0.38 0.33
LSS Volume injected (PV) 10 10 10 10 10 10 10 10 10
Kw(Sor-LSS) (mD) 144 512 255 342 251 182 309 204 368
Aging (days) at 80 °C 21 26 21 25 30 25 28 23 26
Final recovery (%OOIP) 53.28 57.85 51.42 52.60 56.92 62.83 51.16 50.72 50.37
Table 9. Comparison of LSW and high saline waterflooding.
Injection type Injection brine Breakthrough recovery %OOIP Final recovery %OOIP
Traditional waterflooding High saline 44 49
LSW 10% High saline 50 56
Key: LS water was obtained by 1/10 dilutions of the brines in the list.
4 Conclusion LSS flooding has the highest efficiency when the salin-
ity is optimum and the reduction in interfacial tension
In this study, through laboratory coreflooding tests, the EOR between oil and water is maximum.
potential of LSW and LSS floodings have been investigated Based on the comparison study, injection of low salin-
using nine Berea sandstones core samples. The conclusions ity brine provides higher oil recovery than the tradi-
from this research study can be shortly presented as follows: tional waterflooding. The ultimate recovery increases
as the salinity of the injection brine decreases (incre-
Surfactant flooding in combination with low salinity mental recoveries up to 7% OOIP).
water is a new potentially promising hybrid EOR pro- During LSW stage, a significant amount of oil (around
cess. The success of this method depends on the 90–93% of lowsal recovery) was produced before the
selected brines and concentration of the injection water breakthrough.
brine. As none of the suggested theories describes all of the
None of the surfactant solutions was precipitated at observations made during low salinity injection, either
60 °C. Reduction in surfactant solubility was observed there are a number of mechanisms underlying the low
with decrease in temperature and increase in salin- salinity effect, or the right mechanism behind the low
ity concentration in the presence of divalent ions salinity effect has not yet discovered.
(Ca2+ and Mg2+).
LSS flooding improved the oil recovery up to 9.3%
OOIP where the best combination for LSS flooding Acknowledgments. The authors are grateful to Norwegian
was B5-B5. While, the highest oil recovery for LSW University of Science and Technology for providing the
injection (52% OOIP) was obtained in which B2 facilities to conduct this research study, and thank
(9.5% NaCl and 0.5% MgCl2) used for both saturation Professor Ole Torsaeter and Hamid Hosseinzade Khanamiri for
and coreflooding. their valuable insight and support.A. Araz and F. Kamyabi: Oil & Gas Science and Technology – Rev. IFP Energies nouvelles 76, 4 (2021) 9
References 9 Morrow N.R., Tang G., Valat M., Xie X. (1998) Prospects of
improved oil recovery related to wettability and brine
1 Martin J.C. (1959) The effects of clay on the displacement of composition, J. Pet. Sci. Eng. 20, 3–4, 267–276.
heavy oil by water, SPE-1411-G, in: Venezuelan Annual 10 Morrow N., Buckley J. (2011) Improved oil recovery by low-
Meeting, 14–16 October, Caracas, Venezuela, Society of salinity waterflooding, SPE JPT 63, 5, 106–112.
Petroleum Engineers. 11 Filoco P.R., Sharma M.M. (1998) Effect of brine salinity and
2 Bernard G.G. (1967) Effect of floodwater salinity on recovery crude oil properties on relative permeabilities and residual
of oil from cores containing clays, SPE, SPE-1725, in: 38 saturations, in: SPE Annual Technical Conference and
Annual SPE of AIME California Regular Meeting, 26 Exhibition, New Orleans, Louisiana, USA.
October 1967, Los Angeles, CA, USA. 12 Skrettingland K., Holt T., Tweheyo M.T., Skjevrak I. (2010)
3 Riisoen S. (2012) Effect of combined low salinity and Snorre low salinity water injection – core flooding experi-
surfactant injection on oil recovery in aged, Master Thesis, ments and single well field pilot, in: SPE Improved Oil
University of Bergen, Norway. Recovery Symposium, Tulsa, Oklahoma, USA.
4 Zolotukhin A.B., Ursin J.R. (2000) Introduction to petroleum 13 Alagic E. (2010) Combination of low salinity water flooding
reservoir engineering, Høyskoleforlaget, Norwegian Aca- with surfactant flooding, a new hybrid EOR process, PhD
demic Press, Kristiansand, Norway. Thesis, University of Bergen, Norway.
5 Jadhunandan P.P., Morrow N.R. (1995) Effect of Wettabil- 14 Tichelkamp T., Vu Y., Nourani M., Oye G. (2014) Interfacial
ity on Waterflood Recovery for Crude Oil/Brine/Rock tension between low salinity solutions of sulfonate surfac-
Systems, SPE Res. Eng. 10, 1, 40–46. tants and crude and model oils, Energy Fuels 28, 4, 2408–
6 Tang G.Q., Morrow N.R. (1997) Salinity, temperature, oil 2414.
composition, and oil recovery by waterflooding, SPE Res. 15 Torsaeter O. (2003) Experimental reservoir engineering
Eng. 12, 4, 269–276. laboratory workbook, Norwegian University of Science and
7 Tang G., Morrow N.R. (1999) Influence of brine composition Technology, Department of Petroleum Engineering and
and fines migration on crude oil/brine/rock interactions and Applied Geophysics, Norwegian University of Science and
oil recovery, J. Pet. Sci. Eng. 24, 2–4, 99–111. Technology.
8 Tang G., Morrow N.R. (2013) Injection of dilute brine and 16 Hadia N.J., Hansen T., Tweheyo T., Torsaeter O. (2012)
crude oil/brine/rock interactions, in: P.A.C. Raats, D. Influence of crude oil components on recovery by high and
Smiles, A.W. Warrick (eds), Environmental mechanics: low salinity waterflooding, Energy Fuels 26, 7, 4328–4335.
water, mass and energy transfer in the biosphere, American 17 Hankins N.P., Harwell J.H. (1997) Case studies for the
Geophysical Union, Washington DC, pp. 171–179. feasibility of sweep improvement in surfactant-assisted
waterflooding, J. Pet. Sci. Eng. 17, 1–2, 41–62.You can also read


