Orari River: Status of gravel resources and management implications - Report U05/33
←
→
Page content transcription
If your browser does not render page correctly, please read the page content below
Orari River:
Status of gravel
resources and
management
implications
Report U05/33

Prepared by

Dr Henry R. Hudson
Environmental Management
Associates Limited, Christchurch

June 2005
Orari River gravel resource evaluation

          Citation:       Hudson, H.R. 2005. Orari River: Status of gravel resources and management
                          implications. Environment Canterbury Report U05/33. 22 pages.

                                            Summary
          Environmental Management Associates (EMA) were commissioned by
          Environment Canterbury (ECan) to evaluate the status of the river gravel
          resources and management implications on the Orari River, Canterbury.
          Major findings/recommendations include:
              •       Some corrections in the gravel returns data base are required;
                      and historic records should be incorporated.
              •       Survey data from 1949 to 1995/96 was available. Several findings
                      should be confirmed with an analysis of the unprocessed 2004
                      survey data:
                      ⇒ Gravel extraction is largely from the lower 20 km of the Orari
                        River (88-95% depending on the period).
                      ⇒ Historic rates of gravel extraction have been sustainable
                        (~10,000 m3/y).
                      ⇒ There is uncertainty if recent higher levels of extraction are
                        sustainable. Gravel extraction is increasing (1990 to 1995:
                        10,450 m3/y; 1995-1999: 23,000 m3/y; 2000-2003: 45,700
                        m3/y; projected 62,000 m3/y in 2010).
                      ⇒ Over periods of several years bed load inputs vary from
                        27,200 to 55,600 m3/y on average for the reach from the gorge
                        to the sea.
                      ⇒ Recent increases in gravel extraction have probably increased
                        fairway flood capacity beyond design capacity.
                      ⇒ It is unlikely that bridge stability is an issue.
              •       Flood statistics should probably be updated.
              •       Neither the Leckie (1994) model nor the River Environment
                      Classification (Mosley & Schumm 2000) adequately describe
                      downstream morphological changes in the Orari River.
              •       There is no evidence the Orari River is adjusting to a lower base
                      level by incision near the mouth. It would be prudent to investigate
                      the behaviour of the Orari mouth particularly if gravel extraction
                      from the coastal zone is being considered in the Canterbury Bight.

          The information in this report and any accompanying documentation is accurate to the best
          of the knowledge and belief of the Consultant acting on behalf of Environment Canterbury.
          While the Consultant has exercised all reasonable skill and care in the preparation of
          information in this report, neither the Consultant nor Environment Canterbury accept any
          liability in contract, tort or otherwise for any loss, damage, injury or expense, whether direct,
          indirect or consequential, arising out of the provision of information in this report.

Hudson 2005                                                                                            i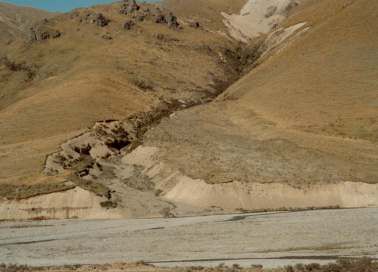
Orari River gravel resource evaluation
Table of Contents
1 INTRODUCTION 1
2 RIVER CHARACTER 1
3 FLOODING AND FLOOD MANAGEMENT 4
4 GRAVEL SUPPLY TO THE LOWER RIVER 8
5 RATES AND LOCATION OF GRAVEL EXTRACTION IN THE LOWER RIVER 10
6 AFFECTS OF GRAVEL EXTRACTION 11
6.1 General bed levels 11
6.2 Bridge reach bed levels 12
6.3 Flood levels 12
6.4 Gravel transport and storage 12
6.4.1 Lower Orari River below km 6 13
6.4.2 Lower Orari River km 6-20 14
6.4.3 Lower Orari River km 20-36 14
7 DISCUSSION AND RECOMMENDATIONS 14
8 ACKNOWLEDGEMENTS 16
9 REFERENCES 16
10 APPENDIX 19
List of Figures
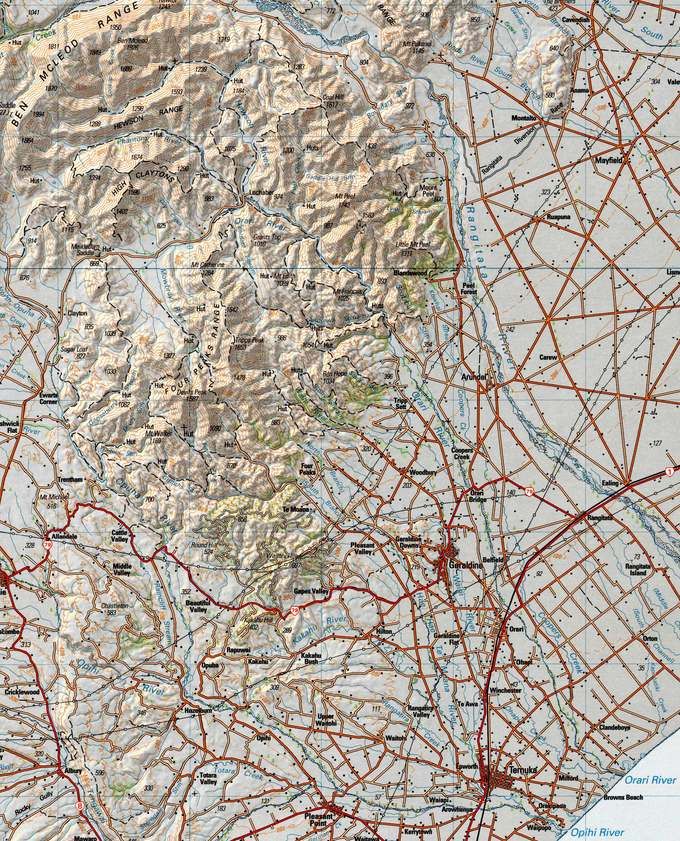
Fig. 1 Map of the Orari catchment ........................................................................ 2
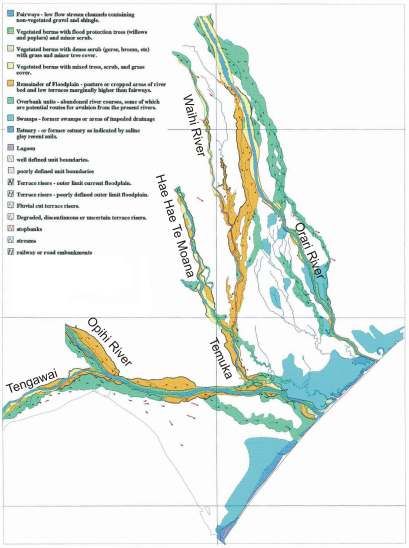
Fig. 2 Geomorphic map of fluvial features ........................................................... 3
Fig. 3 Orari River upper plains view upstream from km 32.5 . .............................. 5
Fig. 4 Orari River channel width based on the cross section surveys and
aerial photographs.......................................................................................... 7
Fig. 5 Lower Phantom River truncated alluvial fan ............................................... 9
Fig. 6 Orari River: volume of gravel extracted 1990-2003................................... 10
Fig. 7 Location of gravel extraction Orari River. .................................................. 10
Fig. 8 Orari River MBLs relative to 1995. ............................................................ 12
Hudson 2005 iiOrari River gravel resource evaluation
1 Introduction
Environmental Management Associates (EMA) were commissioned by
Environment Canterbury (ECan) to evaluate the status of the gravel1
resources and management implications for gravel extraction for several
rivers including the Orari River in South Canterbury.
Careful management of the gravel resources of the Orari River is
required:
1. River gravels are a preferred source of building materials
and sustainable supply is critical.
2. Over exploitation can lead to infrastructure problems, such
as undermining of bridges, with major financial implications
and potential liabilities to Environment Canterbury.
3. Over exploitation can have significant environmental
effects in the rivers themselves (Hudson 1997; Day &
Hudson 2001; Kelly et al. 2005) and on the coastal zone
(e.g. reduced aggregate supplies accelerating coastal
erosion – Kirk 1991).
4. Gravel extractions, and control of gravel supplies, are
essential components of Orari River floodplain
management (Stringer & Rowell 1978).
This evaluation provides a brief overview of river character and aspects
of the flooding problem before evaluating:
• Gravel supply to the lower river
• Rates and location of gravel extraction in the lower river
• Affects on the river bed
• Recommendations for future extraction (i.e. locations for and
constraints on excavation).
2 River character
The upper Orari River above the gorge is a 520 km2 foothills basin
flowing from the Ben McLeod Range (with peaks around 1800-1900 m)
(Fig. 1). Slopes are predominantly steep, apart from a ~30 km2 area of
rolling downs-undulating outwash plains in the Mowbary River valley.
Many of the other major tributaries (Hewson, Phantom, Mt. Peel Creek
and Andrews Stream) have narrow valley flats. At the gorge (river km
40), where the river flows out onto the Canterbury Plains, the elevation
of the river bed is ~268 m.
Underlying basement rocks in the upper Orari are principally
greywacke/argillites. Andersite and rhyolite are found in Quartz Creek in
the north east of the catchment. Extensive deposits of weather rock
1
“Gravel” is a specific size range of rock fragments (2-64 mm); but is also commonly used to
describe riverbed material, largely consisting of sand and gravel sized material, but ranging
from very fine material (silt and clay) to cobbles and boulders. Also called “shingle.”
Hudson 2005 1Orari River gravel resource evaluation
(screes) occur over most of the catchment. The most extensive
vegetation cover is snow grass, tussock and grasses (90% of the area);
with bare rock over 3% of the area. The major land use is sheep and
cattle grazing (Stringer & Rowell 1978).
Fig. 1 Map of the Orari catchment (TopoMap)
Below the gorge Orari River outflows produced an extensive glacial
outwash fan extending along the present course of Coopers Creek to
Clandeboyne in the north and to Temuka in the south. Presently the
river is contained to an area of ~238 km2, but as recently as about 1852
Hudson 2005 2Orari River gravel resource evaluation
the Orari joined the Temuka system north-west of the present
Winchester Township (Williams 1968) via what is now Dobies Stream
(Fig. 1; Fig. 2). The Orari fan coalesced with the much larger and faster
growing Rangitata fan to the north and the Waihi fan to the south.
Glaciers did not extend onto the upper plains of the Orari fan (McEwan
2002).
Fig. 2 Geomorphic map of fluvial features (based on Lynn
et al. 1997)
Hudson 2005 3Orari River gravel resource evaluation
The alluvial fans were uplifted and tilted with subsequent incision of
rivers into the upper plains surface. At the mouth of the rivers the fans
are being eroded by wave action following the post-glacial rise in sea
level. Analysis of fan slopes and cliff heights suggest that 4 to 6 km of
land have been removed from the plains margin during the last 4,000 to
7,000 years (Kirk 1991). In mid Canterbury, at the mouth of the Orari
River, the coastline is retreating ~0.65 m/y (citations in Lechie 1994). As
coastlines retreat, rivers adjust to a lower base level by incision near the
mouth.
Land use on the plains is intense mixed crop - livestock (sheep, beef
and dairy); with high demands for irrigation (McEwan 2002). There are
no large communities within the floodplain, but several communities are
at risk of flooding in the area, notably Temuka (population of 4,000 in
2001; Statistics New Zealand), Geraldine (2,200) and Winchester (258).
3 Flooding and flood management
Almost all the flood runoff originates from the foothills of the Orari
catchment (Connell et al. 1993). Floods can occur at any time of year,
the largest resulting from easterly rainfalls associated with regions of
high pressure to the south of New Zealand and complex low pressure
systems passing from west to east near Cook Strait. Easterly storms are
usually of short duration, typically 24 to 48 hours (Williams 1968). At the
gorge (522 km2) the mean annual low flow is 10.5 m3/s; the mean
annual flow is 209 m3/s; and the 10 year return period flood is 485 m3/s
(ECan website last updated 2001).
Flood management has focused on the Canterbury Plains reach of the
Orari River. Upstream of the Orari Gorge recorder (km 40.12) the river
flows through a narrow bedrock gorge. In the upper plains below the
gorge the river flows in a progressively shallowing trench; with a natural
braided pattern that has been confined with bank protection and now
flows in a sinuous, generally single thread pattern (Fig. 3).
Terraces in the upper plains are ~12-14 m above the river (Fig. 3). The
river bed level is ~268 m at the gorge (km 40.12) and the contour along
the base of the foothills is 280 m. At km 38 the bed elevation is ~251 m
(extrapolated from the cross section mean bed levels) and a trig station
on the left bank terrace is 265 m. Terraces on the true right bank are
intermittent and lower than the left bank terraces.
A low terrace forms the right bank for ~1 km downstream of km 37.7.
The terrace is evident again from km 35 to km 32.5, beginning at the
rivers edge but diverging downstream to ~900 m away from the active
channel. A stopbank is connected to the upstream end of this terrace
and separates the active channel from the floodplain.
Immediately below the gorge a terrace forms the left bank for ~1.2 km.
This terrace is continuous from km 40.2 downstream to km 32.5 where
the terrace merges with the floodplain surface; where the Rangitata Fan
intersects the Orari River (McEwan 2002). Downstream of ~km 37 the
left bank the terrace is generally 600 to 900 m away from the river and
there a stopbank between the river and the terrace. This upper reach to
Hudson 2005 4Orari River gravel resource evaluation
the gorge equates to the upper entrenched reach described by Lechie
(1994) in his analysis of Canterbury Plains rivers.
Fig. 3 Orari River upper plains view upstream from km
32.5 (October 2004)
Hudson 2005 5Orari River gravel resource evaluation
Further downstream the river is weakly incised or flows on the fan
surface with low or non-existent banks. This reach equates to the “zone
of minimum erosion” described by Lechie (1994) as a feature of
Canterbury Plains rivers.2 Up to 1852 the Orari River discharged into the
Waihi River north west of Winchester following the course of the present
Dobies Stream (Williams 1968) (Fig. 2). In this reach the natural
boundary of the Orari River is a terrace “riser” more than a kilometer
west of the Orari River (Lynn et al. 1997).
As noted in section 2, a feature of Canterbury Bight rivers is degradation
near the coast due to coastline retreat (Lechie 1994). However,
entrenchment is not evident in the topography or reported in
geomorphological mapping. Prior to major river works the Orari
meandered into a lagoon behind the coastal sand dunes, with an
extensive area (~7,700 ha) of poor drainage for agriculture (Williams
1968). There is evidence of overflows channels into Ohapi Creek, along
the right bank, a few kilometers from the sea (Lynn et al. 1997) (Fig. 2).
The essence of the flooding problem is described by Williams (1968):
“The Orari River is typical of the shingle bed rivers of Canterbury … The
surrounding land is little higher than the river bed. Shingle causes both
instability and rapid filling of river courses. On the shingle fan outfalls,
the river persists in the age-old cycle which has formed, and is still
forming, the Canterbury Plains. The river gathers shingle from the
mountains, and its own banks and bed, at a rate beyond its capacity to
transport to the sea. At any positive check or flattening of gradient, the
river bed aggrades and fills with shingle. Floodwaters spill over the river
banks to pursue less obstructed courses to the sea. The cycle then
starts again in the new bed.” This is essentially the process described by
Fahnestock (1963) and Carson (1984).
In the Orari-Waihi-Temuka Catchment Control Scheme report it was
noted that that during large floods the Orari River “… regularly over-
flowed its banks and a sizeable portion of the total flood discharge
followed the old historic course into the Opihi-Temuka-Waihi River
system, leaving a trail of devastation and wreckage in its path. This was
one of the primary reasons for an OWT control scheme.” (Stringer &
Rowell 1978). Breakouts were reported in 1868, 1871, 1902 and 1945
(Lynn et al. 1997).
A primary objective of the Orari-Waihi-Temuka flood control scheme was
to prevent Orari floodwaters entering the Waihi-Temuka system, which it
did on a regular basis (Williams 1968). Major flooding was recorded in
the early 1850s, 1868, 1902, 1945 and 1986, with lesser flooding in
1951, 1952 and 1957 (Connell et al. 1993).
River works in the Orari River catchment can be described as having
several objectives (Williams 1968; Stringer & Rowell1978; Connell et al.
1993):
2
Lynn (et al. 1997) describe “entrenchment” over the lower 7 km of Coopers Creek (an old
course of the Orari) to its confluence with the Orari River (km 5.70), but a more apt description
may be “weakly incised.”
Hudson 2005 6Orari River gravel resource evaluation
1. Prevent erosion of infrastructure, particularly the bridges,
with localized works starting in the 1880s.
2. Contain the Orari River to the channel it cut directly to the
sea in about 1852 (e.g. embankments and stopbanks to
contain a 100 year flood and prevent Orari flow into the
Opihi were initiated in 1956). The design flow at the gorge
is 1,275 m3/s.
3. To divert excess flood waters (255 m3/s) from the Orari
River into Coopers Creek along the north bank from ~km
32 and to redirect these flood waters (with additional flow
from Sweetwater Creek of 28 m3/s) back into the Orari
River near km 6.
4. Straighten and constrict the channel to concentrate flow
and scour gravel during floods and transport gravel to the
sea.
5. Increase hydraulic efficiency and reduce sediment trapping
by removing vegetation from the fairway.
6. Decrease the supply of bed material with extensive tree
planting and rock works along the main rivers and
tributaries; and with gully planting, drop structures and
gravel traps to control erosion and reduce supply to the
lower river system (in the 1970s).
7. Encourage gravel extraction to increase fairway capacity;
or at least limit a reduction in fairway capacity; and to
reduce bar formation with associated bank erosion.
Channel constriction and straightening is evident throughout the Orari
River (Fig. 3; Fig. 4). Design fairway widths downstream to State
Highway 1 (SH 1; km 15.97) were 600 feet (183 m); downstream of
which the fairway gradually narrowed to 330 feet (101 m) through the
“badly aggraded reaches.”
1000
900 Rolleston Badham SH 1 Rail SH 79
800
700
Width (m)
600 Terrace
500
400 Floodway
300
200 Fairway
100
0
0 5 10 15 20 25 30 35 40
Distance Upstream (km)
Fig. 4 Orari River channel width based on the cross
section surveys and aerial photographs
Hudson 2005 7Orari River gravel resource evaluation
To by-pass the lagoon area, and to facilitate the transport of gravel to
the sea, a straight one mile diversion cut (1.62 km) was made at the
mouth, with 7 m high stopbanks that are 183 m apart (Williams 1968).
Previously a coastal barrier formed by littoral drift would force the river
mouth northward up to 5 km (Lynn et al. 1997) during low river flow
conditions. A sea wall was constructed at the mouth of the Orari River.
A design discharge of 1,275 m3/s was used for the 100 year flood at the
gorge (Williams 1968). This was a reasonable estimate. Connell et al.
(1993) provide the following estimates (with ECan website estimates to
2001 in brackets):
• Mean annual flow: 253 m3/s (209 m3/s).
• 10 year return period flood: 670 m3/s (485 m3/s).
• 50 year return period flood: 1,083 m3/s.
• 100 year return period flood: 1,252 m3/s.
The last occurrence of major flooding was in 1986 when the Waihi and
Temuka (but not the Orari) rivers overflowed their banks. Flood hazard
maps, calibrated with observations in the 1986 flood, show by-pass
flows down Coopers Creek (as designed – Williams 1968) spreading
downstream parallel to the Orari River with significant ponding near the
coast. Flows from the Orari down the historic channel (Dobies Creek)
past Winchester and into the Opihi River were predicted. Flood flows are
also predicted to occur in Ohapi Creek which runs parallel to the Orari
River, with some return flow into the Orari, but with the major flow
course causing ponding in the coastal area to the south at the mouth of
the Opihi.
As noted earlier in this section, excessive sediment inputs and gravel
build up in the channel are explicitly recognised as significant problems
in the Orari floodplain management scheme (Williams 1968; Stringer &
Rowell 1978).
In their flood hazard mapping and evaluation of floodplain management
options, Connell et al. (1993) made the following statement regarding
gravel management: “The South Canterbury Catchment Board took a
large number of cross sections surveys on these river systems [Orari-
Waihi-Temuka] … The comparison of levels shows that they have not
changed significantly in the study area over recent years.” This
proposition is evaluated.
4 Gravel supply to the lower river
Stringer & Rowell (1978) describe large scale inputs of gravel into the
major foothill tributaries of the Orari (e.g. Fig. 5). “With a total length of
160 km of gravel bearing streams, a huge amount of debris is feeding
from the gravel sources out into the four main rivers and down through
the gorge to deposit onto the 13.67 km length of main river between the
gorge outlet and the upper Orari bridges… It is essential that control
works be carried out in the upper catchment rivers and streams, to
reduce the continued high flood damage restoration programmes
necessary because of the uncontrolled intrusion of detritus exceeding
Hudson 2005 8Orari River gravel resource evaluation
the ability of the lower river to handle bed load and suspended
sediments in flood times.”
While measures were taken to control excessive inputs of gravel from
the foothill tributaries, and the channel was confined in an attempt to
reduce bank erosion and flush gravel to the sea, there was no
quantification of the volume of gravel delivered to the Orari system in the
scheme proposal.
Fig. 5 Lower Phantom River truncated alluvial fan
(Stringer & Rowell 1978)
Based on an erosion rating of the catchment, Cuff (1981) estimated
bedload of 35,000 m3/y at Orari gorge. de Joux (1980) and Griffiths &
Glasby (1985) estimated bed load of 28,400 m3 and 10,730 m3/y,
respectively, based on measurements of suspended sediment and an
assumed proportion of bedload.
It is likely that the extensive soil conservation measures in the
catchment reduced erosion and delivery of sediment to the river system.
Also, it is likely that the extensive river bank protection measures and
berm planting reduced the availability of gravel from the river itself.
Contrary to the expectation that a confined single thread channel would
efficiently flush gravel to the sea, subsequent studies report the
importance of bank scour along braids as a major mechanism of gravel
transport (Carson & Griffiths 1989; Hicks et al. 2000). Elimination of
sinuous braids suppress bed load transport and straightening of braided
rivers, narrowing and conversion to single thread decreases bedload
transport rates. Channel narrowing has not flushed out gravel, but
probably accelerated aggradation (e.g. North Branch Ashburton River –
Hudson 2000). To flush out gravel requires very constricted channel
widths (e.g. the gorges); which would require extreme bank protection in
a gravel bed river (Griffiths & Carson 2000).
Hudson 2005 9Orari River gravel resource evaluation
5 Rates and location of gravel extraction in the lower river
In the period 1990-2002 3 the average annual extraction from the Orari
River was 23,112 m3/y (Fig. 6). Average annual rates of extraction
varied: 1990-1994 9,692 m3/y; 1995-1999 22,991 m3/y; and 2000-2002
45,681 m3/y. There is a trend of increasing gravel extraction with time
with projected extraction of 62,000 m3/y in 2010 and 90,000 m3/y in
2020 (r2 = 0.47); but extraction may have peaked.
80,000
67,654
Orari gravel extraction 1990-2003
70,000
60,000
43,777
41,589
Volume (m )
50,000
3
40,000
27,799
23,742
23,550
30,000
18,915
15,571
14,487
14,224
11,496
20,000
9,635
8,122
3,637
10,000
0
1990 1991 1992 1993 1994 1995 1996 1997 1998 1999 2000 2001 2002 2003
Fig. 6 Orari River: volume of gravel extracted 1990-2003
Extraction from the Orari River is concentrated in the lower ~20 km
averaging ~21,600 m3/y (93% of the total) from 1990-2002 (Fig. 7). Per
kilometer of river, extraction over the lower ~6 km averages 933 m3/y;
1,221 m3/y from km 6 to 20; 484 m3/y from km 20-36; and 40 m3/y for
the upper reaches (km 36 to 59).
80,000
Orari gravel extraction 1990-2003
70,000
60,000
Volume (m )
3
50,000
40,000
30,000
20,000
10,000
0
0 10 20 30 40 50 60 70
Distance Upstream (km)
Fig. 7 Location of gravel extraction Orari River
3
Data for 2003 is for six months, so is not included in the average.
Hudson 2005 10Orari River gravel resource evaluation
When considered in five year periods, the location of extraction has
been relatively constant, with 88-95% from the lower ~20 km; 0.3-3%
from ~km 20-36; and 1-11% from the upper reaches (>km 36). The
lower ~6 km contributed 22-33% of the total; with 57-73% from km 6-19.
There is no systematic shift in extraction locations, apart from the
proportion taken from the upper reaches declining with time as overall
volumes increased. The volume taken from the upper reaches is
relatively constant averaging ~900 m3/y (range ~600-1,100 m3/y).
Gravel extraction information prior to 1990 was not available, but for the
“Orari- Waihi-Temuka-L. Opihi” rivers, Williman & Smart (1987) report
“Sand and gravel extraction is currently 17 000 m3/year. Extraction is
controlled to limited sites. Annual replenishment is unknown.” (It is
unclear what they mean by “L. Opihi” - elsewhere they report Opihi
extraction is 50,000 m3/y; which is consistent with extraction records –
Hudson 2005).
Historic gravel extraction from the Orari is estimated from the 17,000
m3/y reported by Williman & Smart (1987), subtracting the Waihi (4,187
m3/y) and Temuka (3,033 m3/y) gravel extraction from 1990-1994. The
9,780 m3/y estimate is consistent with the first five years of record for the
Orari (1990-1994: 9,692 m3/y). The latter is used as the estimate of
gravel extraction for historic channel changes; with the assumption that
the location of historic extraction is the same as in 1990-2002.
6 Effects of gravel extraction
Following the approach of Griffiths (1979) the focus is on gravel and
mean bed levels in the active river channel (the fairway) rather than
overbank (berm) areas which experience significant silt deposition. Data
was provided by Environment Canterbury. Survey locations and times
are described in Appendix 1. Data to 1995 (to cross section 33) and
1996 (cross sections 35-64) are available. September-October 2004
survey data is not scheduled for processing until July 2005.
Audit notes state that Sections 1 to 33 (to km 16.99) are in true mean
sea level; but sections 35 to 62 are in an older datum and could be up to
±100mm off mean sea level. However, the inter survey differences
between surveys at each section are correct.
6.1 General bed levels
Prior to major river works, the bed near the mouth aggraded ~27 cm on
average from 1949 to 1951 (Fig. 8). There were major reductions in bed
levels (~1 m on average) in the lower ~6 km of the Orari River in the
period 1951 to 1964, which are attributable to river engineering works.
From 1964 to 1995 there was little net change on average over this
reach.
For much of the reach from ~km 6 to 15 the bed was higher in 1949/51,
with a decrease in bed levels following engineering works. Bed levels
were sustained at the post work bed levels through to the 1980s; with a
bed build up in places to 1995 (Fig. 8). Upstream of km 15 bed levels
Hudson 2005 11Orari River gravel resource evaluation
surveys from 1964, 1972, 1981 and 1985 fluctuate around the 1995 bed
level (Fig. 8).
3.0
Orari River: fairway MBLs relative to 1995/96 1949
2.5
1951
2.0 1964
1972
1.5
Relative MBL (m)
1981
1985
1.0
0.5
0.0
-0.5
-1.0 Rolleston Badham SH 1 Rail SH 79
-1.5
0 5 10 15 20 25 30 35 40
Distance Upstream (km)
Fig. 8 Orari River MBLs relative to 1995
6.2 Bridge reach bed levels
Bed levels at the lower four bridges decreased as a result of engineering
works; but were higher in the most recent survey than in the 1960s and
1970s (Fig. 8). There is little difference in bed levels around these
bridges in the period 1985-1995. Around SH 79 (km 26), bed levels are
presently higher than in the past (Fig. 8).
6.3 Flood levels
Information is not available with which to quantify fairway capacity,
potential bottlenecks, or the role of gravel extraction in maintaining
required bed levels. Aggradation is not perceived to be a problem with
present rates of gravel extraction (see the closure to section 3, Flooding
and flood management). Connell et al. (1993) stated “The comparison of
levels shows that they have not changed significantly in the study area
over recent years.” (The study area includes the Waihi and Temuka).
This proposition is vindicated in the bed level analysis of the Orari River
discussed in the previous section. However, this is not correct in the
Waihi River (Hudson 2005); and bed levels have progressively declined
in all surveys in the Temuka River from 1953 to 2001.
6.4 Gravel transport and storage
Changes in bed material storage in the fairway are calculated for segments
of the river using 1949, 1951, 1964, 1972, 1981 1985 and 1995/96 surveys.
Hudson 2005 12Orari River gravel resource evaluation
The prismoidal formula is used to interpolate the volume of the riverbed
(specifically the fairway) between cross sections. Only partial comparisons
are possible because of data gaps (Appendix 1). Data was interpolated
where one section was missing.
6.4.1 Lower Orari River below km 6
Aggradation was cited as a major reason for lower reach channel
confinement to flush gravel to the sea (Williams 1968); and this is evident in
the 1949 – 1951 surveys where the bed aggraded by 105,400 m3 over the
lower 6 km. Gravel extraction from this reach is possibly ~3,000 m3/y; hence
the net input of bed material would be ~55,600 m3/y.
Post works, bed levels were relatively stable near the mouth in the period
1964-1972, with minor degradation (~16,000 m3 total) which is probably
less than the loss attributable to gravel extraction (~27,000 m3 over the
reach).
In the period 1972-1981 total degradation of 27,700 m3 is again accounted
for by gravel extraction of 29,800 m3 over the reach; but volumes of gravel
extraction are only rough estimates in this period.
The lower ~6 km aggraded by 15,900 m3 from 1981-1985; with gravel
extraction estimated to account for 75% of the change. Bed load input into
the lower ~6 km would be ~7,000 m3/y; with bed load input into the plains
reach below km ~36 of 55,600 m3/y (see below).
From 1985 to 1995 the reach aggraded by ~820 m3/y; with extraction of
3,255 m3/y, requiring a net bedload input ~4,100 m3/y.
These findings are contrary to the proposition that Canterbury Bight rivers
are degrading in their lower reaches because of coastline retreat (Lechie
1994; section 2):
• There is no apparent zone of entrenchment in the lower Orari
River (section 3).
• The bed is aggrading even with gravel extraction.
It is possible that reported rates of coastline retreat (0.65 m/y; section 2)
are mitigated by the sea wall at the Orari mouth. This warrants further
investigation because of the longer term implications of coastline retreat
and infrastructure integrity.
At a larger scale, an idealised model of the fluvial system has been
proposed as part of the River Environment Classification (REC; Snelder
et al. 1999). In this regard, Mosley & Schumm (2000) describe a runoff
and sediment production zone from the mountains and foothills; a
transfer zone; and a deposition zone in the silt phase/tidal phase of the
river. The silt phase has been eliminated by the river works (section 3),
with a channel directly to the sea, and the channel has an aggrading
gravel bed.
Confinement of the lower river has proven unsuccessful in preventing
aggradation of gravel. Gravel flushing requires very constricted channel
widths (e.g. the gorges); which would require extreme bank protection in
a gravel bed river (Griffiths & Carson 2000).
Hudson 2005 13Orari River gravel resource evaluation
6.4.2 Lower Orari River km 6-20
In the reach from cross section 16 to 37 (km 7.25-19.22) sediment budgets
can be calculated for 1981, 1985 and 1995, but there are too many missing
cross sections in the earlier surveys to calculate meaningful changes.
From 1981 to 1985 there was virtually no net change (+1,151 m3) in the km
6-19 reach; but gravel extraction averaged 5,600 m3 per year in the reach.
Net bedload input into the reach would thus be ~5,800 m3/y.
From 1985 to 1995 aggradation averaged 22,800 m3/y; with gravel
extraction averaging 5,770 m3/y. Net bedload input into the reach would
thus be ~28,600 m3/y.
This reach encompasses the zone of minimum incision (Lechie 1994),
which is a transfer zone (Schumm & Mosley 2000) where substantial
aggradation is not expected. However, aggradation occurred even with
gravel extraction.
6.4.3 Lower Orari River km 20-36
Cross sections 39 to 64 were surveyed in 1981 (with one section in
1980 and four in 1982); 1985 and 1996. The 1981 data set was treated
as though all the sections were surveyed at the same time.
From 1981 to 1985 the bed from ~km 20-36 aggraded 42,760 m3/y; with
virtually no gravel extraction (36 m3/y). When totalled with the changes
downstream the net bedload input into the lower 36 km of the Orari River
was 55,600 m3 in the period 1981-1985.
Conversely, degradation occurred in the upper plains reach from 1985 to
1996 (4,139 m3/y) with virtually no extraction (44 m3/y). When totalled with
the changes downstream the net bedload input into the lower 36 km of the
Orari River was 27,240 m3/y in the period 1985-1996. The reduced net
bedload input may reflect reductions in bedload supplies with catchment
control measures (section 3), and reduced sediment transport capacity with
a single thread channel (section 4).
Although this reach encompasses the zone of entrenchment (Lechie 1994),
there was limited degradation in the 1985-1996 period; and the bed
aggraded in the period 1981-1985.
7 Discussion and recommendations
There are inconsistencies in the reported locations of gravel extraction in
the recent ECan gravel returns data base involving 4.6% of the total
volume. This is not too important in terms of the findings of this report, but it
must be emphasised that reliable data underpins management. Also, an
attempt should be made to compile historic information to provide a better
understanding of sustainable gravel extraction.
Gravel extraction sites and gravel returns should be specified in
terms of the ECan river distance/cross section location maps. A few
inconsistent gravel returns should be corrected in the data base.
Historic gravel extraction information should be compiled and
incorporated into the consents data base.
Hudson 2005 14Orari River gravel resource evaluation
Gravel extraction is largely from the lower 20 km of the Orari River (88-
95% depending on the period). From 1990 to 1995 extraction averaged
10,450 m3/y; increasing to 23,000 m3/y in 1995-1999; and 45,700 m3/y
in 2000-2002. Extraction may have peaked, but the trend is for
increased extraction (62,000 m3/y in 2010).
Historic rates of gravel extraction have been sustainable (~10,000 m3/y);
but there is uncertainty if recent higher levels of extraction are
sustainable. Available cross section data only encompasses the period
with modest extraction (to 1995).
Over several years bed load inputs calculated from cross section
changes are shown to be variable; ranging from 27,200 to 55,600 m3/y
for the reach from the gorge to the sea. Indirect estimates of bedload
input ranged from 10,700 to 35,000 m3/y. It is likely that the extensive
soil conservation measures in the catchment reduced erosion and
delivery of sediment to the river system. Also, it is likely that the
extensive river bank protection measures and berm planting reduced the
availability of gravel from the river itself.
It is premature to comment on whether current rates of gravel
extraction are sustainable. Surveys from 2004 should be processed
(scheduled for July) and this report updated.
The scheme has been successful in terms of containing recent floods,
and recent bed levels were not considered to be a constraint (Connell et
al. 1993). Minor changes since 1985 probably do not effect fairway flood
capacity to the point where targeted gravel extraction is warranted.
Recent increases in gravel extraction have probably increased fairway
flood capacity, but this should be confirmed with an analysis of the
unprocessed 2004 survey data. Also, given the number of recent large
floods, and longer period of record, the flood statistics should probably
be updated (e.g. Waihi revisions – Hudson 2005).
The flood statistics should probably be updated.
It is unlikely that bridge stability is an issue, at least to 1995. Subsequent
higher rates of extraction may have changed this situation.
Two models have been proposed to explain or describe changes in river
channel characteristics downstream:
• Leckie (1994) described three main river segments in Canterbury
Bight rivers: a degrading upper plains, a zone of minimal incision,
and a degrading lower segment.
• As part of the River Environment Classification (Snelder et al.
1999), Mosley & Schumm (2000) describe a runoff and sediment
production zone from the mountains and foothills; a transfer zone;
and a deposition zone in the silt phase/tidal phase of the river.
Neither model adequately describes the Orari. Although the upper
reaches have incised into the floodplain, as proposed by Leckie (1994),
recent surveys show bed levels are in quasi-equilibrium, not
substantially degrading. More recent surveys will show if this situation
continues or if the upper plains reach is a major source of sediment in its
Hudson 2005 15Orari River gravel resource evaluation
own right (e.g. Waimakariri – Griffiths 1979; Hudson 2005) rather than
just a transfer zone (Mosley & Schumm 2000).
There is an extensive zone of minimum incision, where the river is at or
near the floodplain surface. A major priority of the Orari flood control
scheme was to contain the flows in this reach and to focus flows in a
direct path to the sea. Gravel extraction has been an essential
component of the scheme in maintaining bed levels. However, the
expectation that a confined single thread channel would efficiently flush
gravel to the sea is unfounded. Channel narrowing has not flushed out
gravel, but probably accelerated aggradation by reducing transport
capacity and confining the area of deposition. Clearly the reach is not a
transfer zone as proposed by Mosley & Schumm (2000).
While general coastline erosion is reported for the Orari area and the
Canterbury Bight coastline in general (Kirk 1991; Lechie 1994), there is
no evidence of the Orari adjusting to a lower base level by incision near
the mouth, though the river has been cut directly to the coast. The bed is
aggrading even with gravel extraction.
It would be prudent to investigate the behaviour of the Orari mouth
particularly if gravel extraction from the coastal zone is being
considered in the Canterbury Bight.
8 Acknowledgements
Environment Canterbury (Bill Meccia) provided the river cross section
data; location maps (Norm Daniels); gravel returns (Matt Surman; Jamie
Glass); and supporting documents (Belinda van Eyndhoven). This
assistance is gratefully acknowledged.
9 References
Carson, M.A. 1984. Observations on the meandering-braided river
transition, the Canterbury Plains, New Zealand: Part 2. New Zealand
Geographer 40:89-99.
Carson, M.A.; Griffiths, G.A. 1989. Gravel transport in the braided
Waimakariri River: mechanisms, measurements and predictions.
Journal of Hydrology 109: 201-220.
Connell, R.J.; Hall, R.J.; Miller, M. 1993. Orari-Waihi-Temuka floodplain:
flood hazard discussion document. Canterbury Regional Council
Report 93/12. 72 pages.
Cuff, J.R.I. 1981. Erosion in the Upper Orari Catchment. Publication No.
19, South Canterbury Catchment Board and Regional Water Board,
Timaru. (Cited in Hicks 1998).
Day, T.J.; Hudson, H.R. 2001. River management: the recent New
Zealand experience. Pages 555-579 in Mosley, M.P.; editor. Gravel-
bed rivers V. New Zealand Hydrological Society, Wellington.
de Joux, R. T. 1981. The water resources of the Orari River. Publication
No. 24, South Canterbury Catchment Board and Regional Water
Board, Timaru. (Cited in Hicks 1998),
Hudson 2005 16Orari River gravel resource evaluation
Fahnestock, R.K. 1963. Morphology and hydrology of a glacial stream -
White River, Mount Rainier, Washington. United States Geological
Survey Professional Paper 422-A. 70 pages.
Griffiths, G.A. 1979. Recent sedimentation history of the Waimakariri
River, New Zealand. Journal of Hydrology (New Zealand) 18: 6-28.
Griffiths, G.A., Carson, M.A. 2000. Channel width for maximum bedload
transport capacity in gravel-bed rivers, South Island, New Zealand.
Journal of Hydrology (New Zealand) 39(2): 107-126.
Griffiths, G.A.; Glasby, G.P. 1985: Input of river derived sediments to the
New Zealand continental shelf: 1: Mass. Estuarine, Coastal and
Shelf Science 21: 773-787.
Hicks, D.M. 1998. Sediment budgets for the Canterbury Coast - a
review, with particular reference to the importance of river sediment.
NIWA Client Report CHC98/2 prepared for Canterbury Regional
Council.78 pages.
Hicks, D.M.; Duncan, M.J.; Walsh, J.M.; Westaway, R.M.; Lane, S.N.;
Jonas, D.A. 2000. The braided Waimakariri River: new views of form
and process from high-density topographic surveys and time-lapse
imagery. Gravel bed rivers 2000 CD-ROM. Special publication of
the New Zealand Hydrological Society.
Hudson, H.R. 1997. An adaptive management strategy for
environmentally sensitive aggregate management in high energy
gravel bed rivers in Southland. A report prepared by Environmental
Management Associates Ltd, for Southland Regional Council. 82
pages.
Hudson, H.R. 2000. Morphological impacts of river gravel extraction:
New Zealand examples. Gravel bed rivers 2000 CD-ROM. Special
publication of the New Zealand Hydrological Society.
Hudson, H.R. 2000. Ashburton River Floodplain Management Strategy:
an evaluation of morphological impacts of channel excavations in
Blands Reach. Report 2000-02 prepared by Environmental
Management Associates Ltd. for Canterbury Regional Council. CRC
Report U00/7. 70 pages.
Kelly, D.; McKerchar, A.; Hicks, M. 2005. Making concrete: ecological
implications of gravel extraction in New Zealand rivers. Water &
Atmosphere 13(1): 20-21.
Kirk, R.M, 1991. River-beach interactions on mixed sand and gravel
coasts: a geomorphic model for water resource planning. Applied
Geography 11: 267-287.
Leckie, D.A. 1994. Canterbury Plains, New Zealand – implications for
sequence strategraphic models. American Association of Petroleum
Geologists 78(8): 1240-1256.
Lynn, I.H.; Harrison, J.M.; Basher, L.R.; Webb, T.H. 1997. A geomorphic
interpretation of the Orari-Waihi-Temuka and Opihi Rivers. Technical
Report U97/36, Canterbury Regional Council.
Hudson 2005 17Orari River gravel resource evaluation
McEwan, G. 2002. The hydrogeology of the Orari River shallow aquifer
system: M.Sc. summary. Environment Canterbury Report U02/02.
30 pages.
Mosley, M.P.; Schumm, S.A. 2000. Gravel bed rivers – the view from
the hills. Pages 479-501in Gravel-bed rivers V, M.P. Mosley, editor.
New Zealand Hydrological Society, Wellington.
Stringer, O.A; Rowell, A. 1978. The Orari-Waihi-Temuka Catchment
Control Scheme. South Canterbury Catchment Board and Regional
Water Board, Timaru. 29 pages.
Snelder, T.; Weatherhead, M.; O’Brien, R.; Shankar, U.; Biggs, B.;
Mosley, P. 1999. Further development and application of a GIS
based river environment classification system. National Institute of
Water & Atmospheric Research Ltd Client Report: CHC99/41 for
Sustainable Management Fund, Canterbury Regional Council,
Environment Waikato.
Williams, C.W. 1968. Orari-Whihi-Temuka rivers flood control scheme.
Soil & Water March 1968: 11-14.
Williman, E. B.; Smart, G.M. 1987. Catalogue of New Zealand rivers
with control works. Pub. No. 13 Hydrology Centre, Ministry of Works
and Development, Christchurch.
10 Complementary gravel reports
Hudson, H.R. 2005. Waimakariri River: Status of gravel resources and
management implications. Environment Canterbury Report R05/15.
Hudson, H.R. 2005. Pareora River: Status of gravel resources and
management implications. Environment Canterbury Report U05/30.
Hudson, H.R. 2005. Opihi & Tengawai rivers: Status of gravel resources
and management implications. Environment Canterbury Report
U05/31.
Hudson, H.R. 2005. Waihi River: Status of gravel resources and
management implications. Environment Canterbury Report U05/32.
Hudson, H.R. 2005. Orari River: Status of gravel resources and
management implications. Environment Canterbury Report U05/33.
Hudson, H.R. 2005. Ashburton River: Status of gravel resources and
management implications. Environment Canterbury Report U05/34.
Hudson 2005 18Orari River gravel resource evaluation
11 Appendix
Location Orari River Fairway Surveys
XS XS ID Km 1949 1951 1964 1972 1981 1985 1995/96
1 OIXS00717 0.72 1964 1972 1981 1985 1995
2 OIXS01000 1.00 1964 1972 1981 1985 1995
4 OIXS01767 1.77 1949 1951 1964 1972 1982 1985 1995
5 OIXS02100 2.10 1949 1951 1964 1972 1982 1985 1995
6 OIXS02533 2.53 1949 1951 1964 1972 1981 1985 1995
8 OIXS03338 3.34 1949 1951 1964 1972 1981 1985 1995
9 OIXS04054 4.05 1964 1972 1981 1985 1995
10 OIXS04150 4.15 1949 1951 1964 1972 1981 1985 1995
11 OIXS04966 4.97 1949 1951 1964 1972 1981 1985 1995
12 OIXS05220 5.22 1964 1972 1981 1985 1995
13 OIXS05725 5.73 1949 1951 1964 1972 1981 1985 1995
14 OIXS06096 6.10 1964 1972 1981 1985 1995
16 OIXS07250 7.25 1981 1985 1995
18 OIXS08158 8.16 1949 1951 1964 1972 1981 1985 1995
19 OIXS08888 8.89 1964 1972 1981 1985 1995
20 OIXS08963 8.96 1949 1951 1964 1972 1982 1985 1995
21 OIXS09271 9.27 1949 1951 1964 1972 1981 1985 1995
22 OIXS09750 9.75 1949 1951 1964 1972 1982 1985 1995
23 OIXS10579 10.58 1964 1972 1981 1985 1995
24 OIXS11421 11.42 1949 1951 1964 1972 1982 1985 1995
25 OIXS12242 12.24 1985 1995
26 OIXS13042 13.04 1981 1985 1995
27 OIXS13864 13.86 1949 1951 1964 1972 1981 1985 1995
28 OIXS14629 14.63 1949 1951 1964 1972 1981 1985 1995
31 OIXS15971 15.97 1972 1981 1985 1995
32 OIXS16362 16.36 1964 1972 1981 1985 1995
33 OIXS16988 16.99 1964 1972 1981 1985 1995
34 OIXS17466 17.47 1964 1972 1981 1985 1995
35 OIXS18127 18.13 1964 1972 1981 1985 1995
37 OIXS19221 19.22 1981 1985 1996
39 OIXS20118 20.12 1964 1973 1981 1985 1996
40 OIXS20792 20.79 1964 1972 1981 1985 1996
41 OIXS21479 21.48 1981 1985 1996
43 OIXS22700 22.70 1982 1985 1996
45 OIXS24080 24.08 1982 1985 1996
47 OIXS25150 25.15 1964 1972 1981 1985 1996
48 OIXS25729 25.73 1964 1972 1981 1985 1996
49 OIXS26130 26.13 1964 1972 1980 1985 1996
50 OIXS26619 26.62 1964 1973 1985 1996
52 OIXS27857 27.86 1981 1985 1996
53 OIXS28492 28.49 1981 1985 1996
55 OIXS29826 29.83 1964 1973 1981 1985 1996
56 OIXS30483 30.48 1964 1973 1982 1985 1996
57 OIXS31271 31.27 1964 1973 1982 1985 1996
58 OIXS31992 31.99 1981 1985 1996
60 OIXS33184 33.18 1981 1985 1996
61 OIXS33771 33.77 1981 1985 1996
62 OIXS34856 34.86 1981 1985 1996
63 OIXS35696 35.70 1973 1980 1985
64 OIXS36574 36.57 1981 1985 1996
Hudson 2005 19You can also read