A numerical simulation of air flow in the human respiratory system for various environmental conditions
←
→
Page content transcription
If your browser does not render page correctly, please read the page content below
Issakhov et al. Theoretical Biology and Medical Modelling                 (2021) 18:2
https://doi.org/10.1186/s12976-020-00133-8

 RESEARCH                                                                                                                                             Open Access

A numerical simulation of air flow in the
human respiratory system for various
environmental conditions
Alibek Issakhov1,2*, Yeldos Zhandaulet1,2, Aizhan Abylkassymova1,2 and Assylbek Issakhov1,2

  Abstract
  The functions of the nasal cavity are very important for maintaining the internal environment of the lungs since the
  inner walls of the nasal cavity control the temperature and saturation of the inhaled air with water vapor until the
  nasopharynx is reached. In this paper, three-dimensional computational studies of airflow transport in the models of
  the nasal cavity were carried out for the usual inspiratory velocity in various environmental conditions. Three-
  dimensional numerical results are compared with experimental data and calculations of other authors. Numerical
  results show that during normal breathing, the human nose copes with heat and relative moisture metabolism in
  order to balance the intra-alveolar conditions. It is also shown in this paper that a normal nose can maintain
  balance even in extreme conditions, for example, in cold and hot weather. The nasal cavity accelerates heat transfer
  by narrowing the air passages and swirls from the nasal concha walls of the inner cavity.
  Keywords: Air flow in the human respiratory system, Alveolar state, Heat transfer in the nasal cavity, Navier, Stokes
  equation, Finite volume method

Background                                                                               throughout the respiratory cycle. Nevertheless, in [32], it
The human nasal cavity acts as an important component                                    was noted that these statements are true for calm (uni-
of the respiratory system with many vital functions, in-                                 form) breathing, and for some cases, at high speeds in
cluding heating, filtering, moisturizing the air flow and                                the intrathoracic airways, it is necessary to carry out
smell. These functions are based on transport phenom-                                    additional conditioning to fully prepare the inhaled air
ena, which depend on the nature of the air flow in the                                   to alveolar conditions. However, the exact characteristics
nasal structure.                                                                         and distribution of transport phenomena are still un-
   After the first studies of nasal function [5, 12, 13, 43],                            known even for normal or healthy breathing.
it was clear that inhaling through the nasal cavity causes                                 Depending on the local Reynolds numbers (Re) for dif-
the incoming ambient air to become almost alveolar,                                      ferent structures of the nasal air flow, they can undergo
then is completely saturated with water vapor and                                        various flow regimes (laminar, transitional and turbu-
heated to a person’s body temperature by the time it                                     lent). The normal rate of respiration in the nasal cavity
reaches the pharynx. These results were confirmed in                                     is seen as a laminar flow, which accelerates in certain
many studies that collected data on air temperature                                      places of the nose and turns into a transient flow, grad-
values from various places in the upper respiratory tract                                ually turning into a turbulent flow due to a decrease in
                                                                                         cross-sectional area [6]. In the paper [10], measurements
* Correspondence: alibek.issakhov@gmail.com
                                                                                         were made using laser anemometry on a human nose
1
 Al-Farabi Kazakh National University, av. al-Farabi 71, 050040 Almaty,                  model and found that the flow field is mainly laminar
Republic of Kazakhstan
2
 Kazakh British Technical University, Almaty, Republic of Kazakhstan

                                          © The Author(s). 2020 Open Access This article is licensed under a Creative Commons Attribution 4.0 International License,
                                          which permits use, sharing, adaptation, distribution and reproduction in any medium or format, as long as you give
                                          appropriate credit to the original author(s) and the source, provide a link to the Creative Commons licence, and indicate if
                                          changes were made. The images or other third party material in this article are included in the article's Creative Commons
                                          licence, unless indicated otherwise in a credit line to the material. If material is not included in the article's Creative Commons
                                          licence and your intended use is not permitted by statutory regulation or exceeds the permitted use, you will need to obtain
                                          permission directly from the copyright holder. To view a copy of this licence, visit http://creativecommons.org/licenses/by/4.0/.
                                          The Creative Commons Public Domain Dedication waiver (http://creativecommons.org/publicdomain/zero/1.0/) applies to the
                                          data made available in this article, unless otherwise stated in a credit line to the data.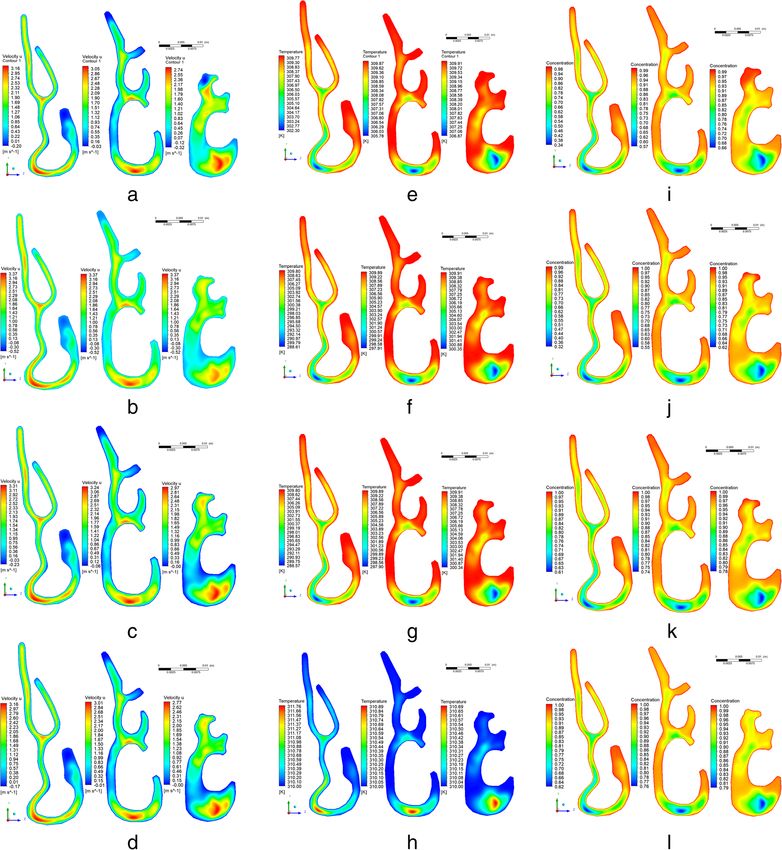
Issakhov et al. Theoretical Biology and Medical Modelling   (2021) 18:2                                                   Page 2 of 12

and the velocity profiles are almost parabolic in all cross               these calculations were performed for not specified nasal
sections.                                                                 cavities. Most of these previous studies have tested their
   Turbulent flow usually occurs at Re > 2000, but de-                    models on a limited range of flow rates. In [28], the ac-
pending on the complexity of the airways, the transition                  curacy of various CFD models was estimated for model-
to a turbulent regime can occur at lower values of the                    ing airflow velocities under various respiration
Re number (below the value of 2000). Turbulent flow                       conditions in the right nasal cavity, based on computed
leads to better mixing of heat and moisture, which con-                   tomography (CT).
tributes to the functions of the nasal cavity. For adults,                  Some investigation in the past has been limited by the
airflow rates can vary from 80 to 200 ml/s with calm                      poor presentation of complex nasal geometry, lack of de-
breathing and from 200 to 1000 ml/s during exercise [1,                   tailed airflow comparisons, and limited computing
37], with a Re range from a few hundred to several thou-                  power. The high computational cost limits the use of de-
sand. However, in [7] at flow rates of 115–170 ml/s, ir-                  tailed geometry; therefore, many authors conducted very
regular flow in the nasal cavity was revealed, which                      limited studies for the simplified geometry of the human
makes the assumption of laminar flow controversial for                    nasal cavity [27, 38, 41, 44].
calm breathing.                                                             There are a few numerical studies that consider heat
   With the development of high-performance comput-                       and moisture transfer. So in the papers [29, 30], it is as-
ing in recent years, many researchers have considered                     sumed that the walls of the nasal cavity representing the
simulation using computational fluid dynamics (CFD) as                    nasal mucosa have a constant temperature. In [36], air
an alternative approach to studying airflow in human re-                  conditioning, heating and humidification of the air in
spiratory systems. Compared to natural measurements,                      the nasal cavity are considered. This paper presents ex-
CFD modeling is advantageous for a detailed study of air                  perimental and computational results that were aimed at
flow in the nasal cavity model. However, an accurate air-                 promoting modern physiological research and practical
flow forecast requires careful selection of CFD models                    medicine related to the health of the respiratory system.
and rigorous testing. In papers [4, 26, 40], a laminar                    Also [9, 35, 39, 41, 44] give estimates of the nose morph-
model is used to simulate airflow in the nasal cavity at                  ology in relation to anomalies and diseases using three-
relatively low speeds, when the kinetic energy of turbu-                  dimensional computational models by providing doctors
lence is insignificant.                                                   with the understanding, necessary to make informed de-
   In [14, 33, 34], modeling of unsteady two-dimensional                  cisions regarding surgical interventions.
and three-dimensional models is considered to study the                     The aim of this work is to study the various properties
transfer of air flow in the nasal cavity of a person and its              of the flow as heating and moisturizing using computa-
general ability to condition air. The results of these                    tional methods on an anatomically accurate model of
works showed that the nose can effectively provide                        the nose. Detailed velocity analysis is presented and
about 90% of the heat and water flows needed to condi-                    compared with data from the measurement [11] and
tion the surrounding respiratory air, bringing it to alveo-               computational data [28]. The abilities of the nasal cavity
lar conditions in various environmental conditions. A                     were studied: heating and moisturizing the air during
3D anatomical copy of the human nose showed the best                      normal breathing in different environmental conditions.
results and was able to provide 92% of the heat and 96%                   To study the flow in the nasal cavity, the ANSYS Fluent
of the moisture needed to condition the inhaled air.                      was used.
However, it should be noted that in [33] two-
dimensional geometry was considered as sections of the                    Materials and methods
nasal cavity, and in [34] the three-dimensional model                     The mathematical model
was constructed in a rough form and shaped like a trap-                   To simulate the air flow in the nasal cavity, the basic
ezoid. It should be noted that during the simulation,                     equations for the conservation of mass, momentum,
simplifications in geometry can lead to uncertainties or                  temperature and relative humidity are determined as
inaccuracies in the numerical results compared with real                  follows:
nasal cavities.
   The accuracy of the simulation strongly depends on
the choice of the numerical method and rigorous verifi-                      ∇U ¼0                                               ð1Þ
cation with experimental data. Several tests of numerical
CFD models of airflow in the human nasal cavity were
performed, which compared the pressure drop in the                           ∂U               1
nasal cavity and the static pressure on the walls of the                        þ ðU  ∇ÞU ¼ − ∇P þ ϑ∇2 U                         ð2Þ
                                                                             ∂t               ρ
nose [4, 31, 42]. More detailed comparisons of various
characteristics were also made in [2, 3, 8, 45], however,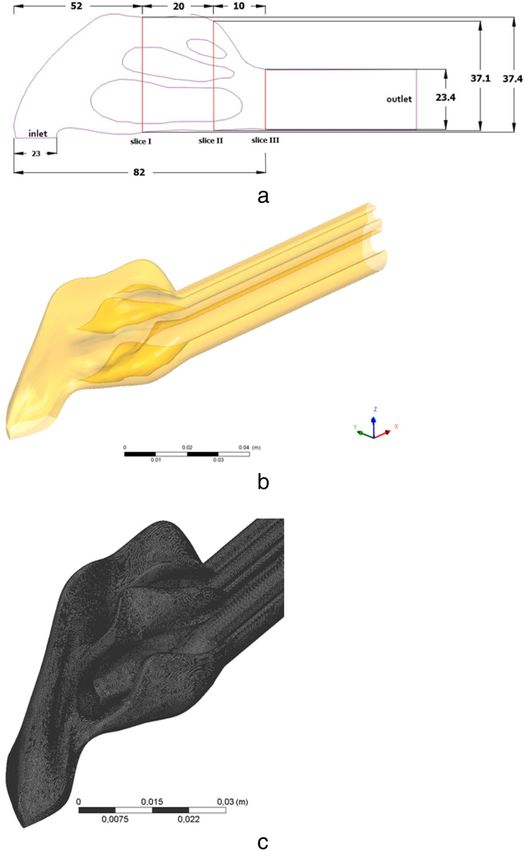
Issakhov et al. Theoretical Biology and Medical Modelling   (2021) 18:2                                                   Page 3 of 12

                                                                          Three-dimensional numerical simulation
    ∂T               k 2                                                  To bring the numerical results closer to the real prob-
       þ ðU  ∇ÞT ¼     ∇ T                                     ð3Þ
    ∂t              ρcp                                                   lem, it will need to use three-dimensional models of the
                                                                          nasal cavity, since heating and humidification of the in-
                                                                          haled air strongly depends on the structure of the nasal
    ∂C
       þ ðU  ∇ÞC ¼ D∇2 C                                       ð4Þ       cavity walls. Therefore, computational models should in-
    ∂t                                                                    clude more realistic three-dimensional geometry de-
                                                                          scriptions in order to determine the effect of complex
   where U is the velocity vector, t is the real time, P is the           geometry on various characteristics such as velocity, heat
flow pressure, C is the concentration of water vapor, cр is               and mass transfer, and relative humidity.
the specific heat, D is the molecular diffusion coefficient,                In the paper [11], data from the measurements were
T is the temperature, ρ, ϑ and k are the density, kinematic               made of the air flow in a nose prototype using a hot wire
viscosity and thermal conductivity, respectively.                         anemometer in a large-scale physical model of the nasal
   The ANSYS Fluent was used to investigate the flow in                   cavity, based on computed tomography of the right nasal
the nasal cavity. For numerical study, second-order                       cavity of a healthy man. In the measurements, various
spatial discretization schemes for pressure and momen-                    respiration rates were used, equivalent to 180 ml/s, 560
tum were used. Thus, the real problem will be solved in                   ml/s and 1100 ml/s in a real human nose, which corre-
a discrete form by applying the finite volume method.                     sponds to calm breathing, medium inhalation and inten-
The SIMPLE algorithm was used to communicate be-                          sive inhalation, respectively. Fig. 1 a, b displays the
tween pressure and velocity. The SIMPLE algorithm can                     measurement setup and the relative position of the
be represented as the following sequence of steps:                        measurement sites on three slices, which were used to
                                                                          verify the obtained numerical values.
  1. Representations of the initial pressure field P0 and                   The numerical model included the area from the front
     set P∗ = P0, t = 0.                                                  tip of the nose to the posterior end of the nasal concha.
  2. Definitions of the initial velocity field u0, v0, w0.                As displayed in Fig. 1a, b, the nasopharynx was ex-
  3. The solution of the equations of motion.                             panded to fit the experimental setup.
  4. The solution of the equation for P' and P                              The geometry of the human nasal cavity was created
     calculation by adding P' to P∗.                                      by aligning and processing 40 computed tomographic
  5. Using velocity correction formulas.                                  (CT) images of the respiratory tract of a healthy man.
  6. If there was ∣P ' ∣ little in all nodes of the                       Using the AutoCAD software, intermediate geometric
     computational grid, then it was assumed P0 = P,                      shapes of the nasal cavity were created that correspond
     u0 = u, v0 = v, w0 = w, t = t + Δt. Otherwise, it was                to the average physical parameters of the human nasal
     used the result P as P∗ and it was proceeded to                      cavity. From these idealized 2-D images (Fig. 2), a 3-D
     stage 3.                                                             complex human nasal cavity was created. The locations
  7. If t < Tmax, then we have a return to step 3.                        of the anemometers in the study area are presented in
                                                                          Fig. 3.
  All details of applying this SIMPLE algorithm can be                      As can be seen from Fig. 3, in slices 1 and 2, 4 lines
found in papers [15–25, 46].                                              were located for measuring velocity at these points in
                                                                          the section. The computational grid of the studied area
                                                                          is presented in Fig. 1c. The final computational grid of
Methods                                                                   the nasal cavity consisted of 6,876,463 elements (Fig. 1c).
Verification of the model                                                 Comparisons of velocity profiles with measurement
The full three-dimensional structure of the nasal cavity                  values [11] on lines 1–4 are presented in Fig. 4.
provides a very complex path of air passage. To provide                     The velocity profiles were dimensionless by the value
comprehensive studies of the transport mechanisms of                      of the local maximum velocity. The X-axis for Y was di-
the nasal cavity, three-dimensional test problem has                      mensionless by the value of the local maximum distance.
been done. For all calculations, it is assumed that the                   As shown in Fig. 4, the forecasts of the laminar model
walls of the nasal cavity and nasal concha are motion-                    are in good agreement with measurement values [11].
lessly solid. The airflow in the nasal cavity is laminar                  The directions of the air flow in the nasal cavity and
and incompressible due to low speeds. The walls of the                    two-dimensional contours in sections 1–3 are shown in
nasal cavity are considered to be completely saturated                    Figs. 5a, b and c. As expected, in the narrow channels of
with water vapor and the temperature near the body due                    the nasal cavity the air flow accelerated and reached a
to the wet mucous layer reaches the vascular vessels of                   maximum value of 3.33 m/s (Fig. 5a, b). It can be also
the nasal wall.                                                           noticed that due to the deep shells of the nasal cavity,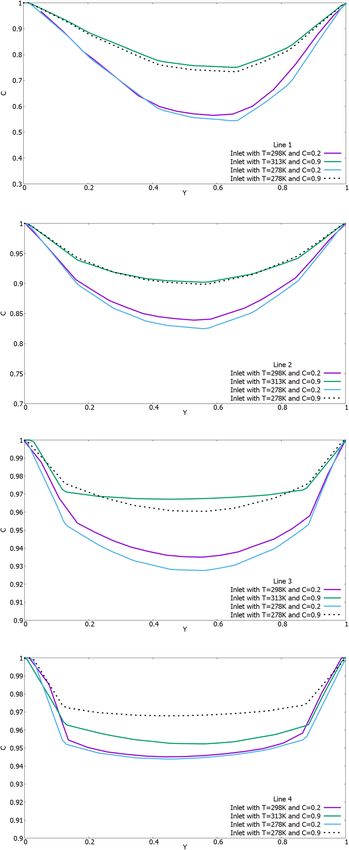
Issakhov et al. Theoretical Biology and Medical Modelling      (2021) 18:2                                                            Page 4 of 12

 Fig. 1 a-b Physical geometry of the studied area (all dimensions in mm), c the computational grid of a complex nasal cavity of a person.

vortices arise, which subsequently can well affect the                       computational values in the paper [28]. However, the in-
heat and mass transfer. The two-dimensional velocity                         accuracies obtained in this work can be explained by the
contours presented in Fig. 5c confirm the allegations of                     fact that the subtle features of the nasal cavity cannot be
air flow acceleration due to the narrowing of the nasal                      accurately measured due to the limited resolution of
concha and, as a result, the occurrence of vortices.                         existing imaging methods. Accordingly, a model similar
  Despite some unevenness in the flow field profiles, it                     to the nasal cavity was developed (Fig. 1), in which the
can be noted that the proposed model is in good agree-                       dimensions are taken from the averaged data on the hu-
ment with the measurement values [11] under condi-                           man nasal cavities [11]. The model used allows us to
tions of calm breathing. It can also be noted that the                       comprehensively study a large number of the nasal cav-
numerical results obtained show much closer values to                        ity functions with respect to the structural components
the measurement data [11] than the obtained                                  of the nasal cavity and the corresponding heat and mass
Issakhov et al. Theoretical Biology and Medical Modelling     (2021) 18:2                                                  Page 5 of 12

 Fig. 2 The 2D digitized cross-sections of 40 computed tomographic (CT) images of the respiratory tract of a healthy man

transfer. It should be noted that in real conditions, the                   Results
nose walls can be unequal or equal to the alveolar condi-                   Numerical study of heating and moisturizing the air in
tions, especially during exercise, and future models                        the human nose
should clarify these assumptions.                                           The air flow in the nasal cavity of a person plays an im-
                                                                            portant role in many physiological functions of the nose,
                                                                            such as heating and moisturizing the flow of air and
                                                                            others. In this section, the proposed model is used to
                                                                            predict air flow and related transport phenomena in hu-
                                                                            man nasal cavities.
                                                                               It is assumed that the flow of heat and water vapor is
                                                                            released from the inside of the nasal mucosa. Normal
                                                                            respiration was chosen as a reference base, and then the
                                                                            effect of changes in ambient temperature was investi-
                                                                            gated. This study serves as the basis for a better under-
                                                                            standing of transport phenomena in the nasal cavity
                                                                            (heat, mass), which are the main functions of the nose.
                                                                               The studied area was identical to the second test prob-
                                                                            lem of Fig. 1. It is believed that the walls of the nasal
                                                                            cavity are completely saturated with water vapor and
                                                                            due to the wet mucous layer and rich underlying vascu-
                                                                            lar bed, the temperature values are close to body
                                                                            temperature. The temperature on the nose walls is taken
                                                                            equal to 37 °C, the humidity on the walls is taken 100%.
                                                                            Environmental conditions were taken as in paper [33],
                                                                            the temperature of the inhaled air is 25 °C and the rela-
                                                                            tive humidity is 20%. Figure 6 shows the two-
                                                                            dimensional and three-dimensional distributions of the
                                                                            longitudinal components of the flow velocity for various
                                                                            sections (sections 1–3) with these conditions. From the
                                                                            obtained results, it can be noted that the global behavior
                                                                            of the air flow was not changed, but, however, the max-
 Fig. 3 Location of lines 1–4 at slices 1 and 2
                                                                            imum longitudinal velocity increased to 3.47 m/s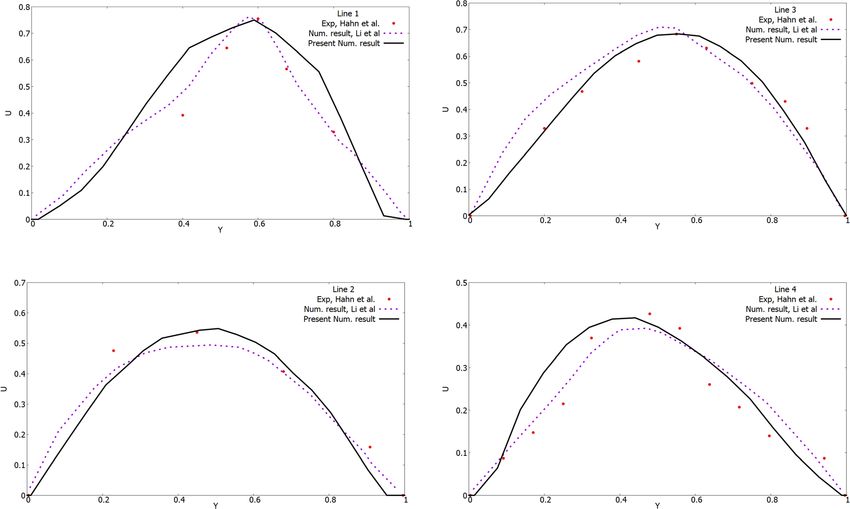
Issakhov et al. Theoretical Biology and Medical Modelling      (2021) 18:2                                                             Page 6 of 12

 Fig. 4 Comparison of the profiles of the horizontal velocity (U) component on lines 1–4 with the numerical results of other authors [28] and
 experimental data [11]

(Fig. 6a). The increase in maximum longitudinal velocity                     ambient temperature of 5 °C and humidity on the walls
was affected by the conditions of heating and moisturiz-                     of the nasal cavity of 20%. As shown in Fig. 6b, at a
ing on the walls of the nasal cavity. Figure e shows the                     temperature of 5 °C and a humidity of 20%, the max-
process of heating inhaled air for various sections. From                    imum velocity reached 3.56 m/s. The temperature of the
the results of Fig. 6e, it can be noticed that the inhaled                   inhaled air in section 3 ranges from 28 to 37 °C. How-
air in section 3 is heated, and the air temperature is                       ever, it should be noted that a temperature of 28 °C oc-
varying between 34 and 37 °C. The concentration of                           curs only in a small area, with an average temperature of
water vapor in the 3 section reaches the value of 0.66–                      35 °C. As shown in Fig. 6j, inhaled air with a moisture
0.99 (Fig. 6i). This structure of the nasal cavity increases                 content of 20% is moistened with water vapor from
the local rate of heat and moisture transfer due to the                      0.62–0.99 until the nasopharynx is reached. In general,
narrowing of the nasal channels for air. This constriction                   water vapor distributions are the same as the results
in the nasal cavities leads to the appearance of eddies                      from Fig. 6a.
downstream.                                                                     Figure 6c shows the results of numerical modeling at
  To study the effect of respiration at various                              an ambient temperature of inhaled air of 5 °C with hu-
temperature and humidity environments, several simula-                       midity on the walls of the nasal cavity of 90%. The flow
tions were carried out using the proposed model. Three                       behavior at a temperature of 5 °C and a humidity of 90%
modes were chosen for modeling heat and mass transfer                        is the same as the results of Fig. 6c. The results of Fig. 6
in the nasal cavity for normal inspiration in extreme en-                    g and 6f are the same, since the conditions for the
vironments: at an ambient temperature of 40 °C and hu-                       temperature of the inhaled air are the same. From the
midity on the walls of the nasal cavity 90%, at ambient                      results of Fig. 6 k it can be seen that the concentration
temperature 5 °C and humidity on the walls of the nasal                      of inhaled air in section 3 is in the range 0.78–1.0.
cavity 20%, ambient temperature 5 °C and humidity on                         Figs. 6d, 6 h, 6 l show the results of numerical modeling
the walls of the nasal cavity 90%. The velocity of air flow                  at an ambient temperature of inhaled air of 40 °C with a
in the nasal cavity was used the same in all cases, how-                     nasal cavity humidity of 90%. At a temperature of in-
ever, the transfer process varies depending on the condi-                    haled air of 40 °C and with a humidity of 90%, the max-
tions. Figs. 6b, f, j show the simulation values at an                       imum flow velocity reaches a value of 3.4 m/s. The nasal
Issakhov et al. Theoretical Biology and Medical Modelling      (2021) 18:2                                                             Page 7 of 12

 Fig. 5 The longitudinal components of the air flow rate in the nasal cavity. a-b three-dimensional distributions of the longitudinal components of
 the air flow rate with the deposition of streamlines, c the two-dimensional contours of the longitudinal components of the velocity of the cross
 section 1–3
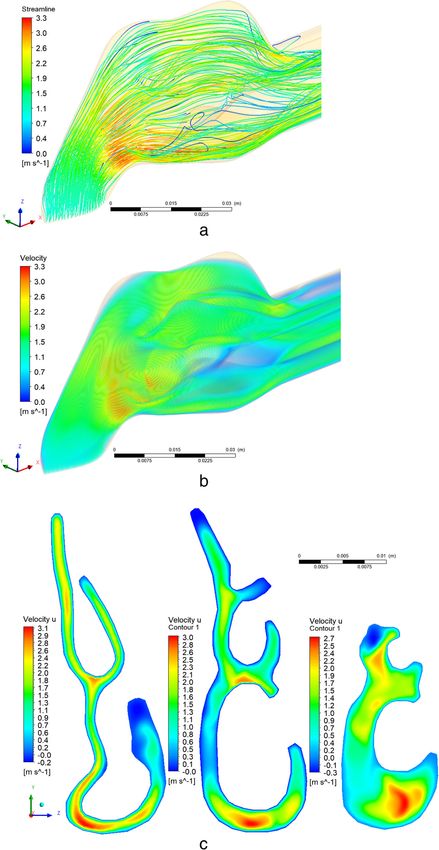
Issakhov et al. Theoretical Biology and Medical Modelling       (2021) 18:2                                                              Page 8 of 12

 Fig. 6 Two-dimensional and three-dimensional distributions of the longitudinal components of the flow rate for different environmental
 conditions: a-b at an ambient temperature of 25°C and humidity on the walls of the nasal cavity of 20% for different sections (sections 1-3). c-d
 at an ambient temperature of 5°C and humidity on the walls of the nasal cavity of 20% for different sections (sections 1-3). e-f at an ambient
 temperature of 5°C and humidity on the walls of the nasal cavity of 90% for different sections (sections 1-3). g-h at an ambient temperature of
 40°C and humidity on the walls of the nasal cavity of 90% for different sections (sections 1-3). i-j at an ambient temperature of 25°C and humidity
 on the walls of the nasal cavity of 20% for different sections (sections 1-3). k-l at an ambient temperature of 5°C and humidity on the walls of the
 nasal cavity of 20% for different sections (sections 1-3). m-n at an ambient temperature of 5°C and humidity on the walls of the nasal cavity of
 90% for different sections (sections 1-3). o-p at an ambient temperature of 40°C and humidity on the walls of the nasal cavity of 90% for different
 sections (sections 1-3). q-r at an ambient temperature of 25°C and humidity on the walls of the nasal cavity of 20% for different sections (sections
 1-3). s-t at an ambient temperature of 5°C and humidity on the walls of the nasal cavity of 20% for different sections (sections 1-3). u-v at an
 ambient temperature of 5°C and humidity on the walls of the nasal cavity of 90% for different sections (sections 1-3). w-x at an ambient
 temperature of 40°C and humidity on the walls of the nasal cavity of 90% for different sections (sections 1-3).
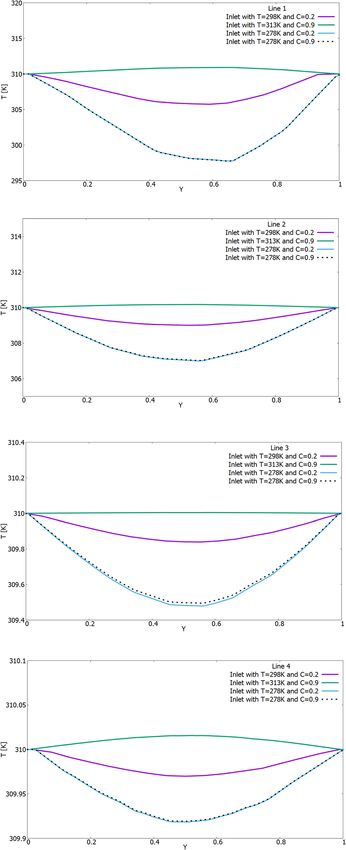
Issakhov et al. Theoretical Biology and Medical Modelling     (2021) 18:2                                                            Page 9 of 12

 Fig. 7 Comparison of temperature profiles (T) on lines 1–4 under different environmental conditions (for different ambient temperature and
 humidity on the walls of the nasal cavity: 1) 25 °C and 20%, 2) 5 °C and 20%, 3) 5 °C and 90%, 4) 40 °C and 90%)
Issakhov et al. Theoretical Biology and Medical Modelling     (2021) 18:2                            Page 10 of 12

 Fig. 8 Comparison of concentration profiles on lines 1–4 under different environmental conditions
Issakhov et al. Theoretical Biology and Medical Modelling   (2021) 18:2                                                                 Page 11 of 12

cavity not only heats the inhaled air, but in some critical               Stokes, energy conservation and convection - diffusion
cases it can also cool. As shown in Fig. 6 h, inhaled air at              equations.
40 °C is cooled to body temperature. The concentration                      The flow behavior during breathing varies depending on
of inhaled air when passing through cross section 3 is                    environmental conditions. Therefore, three-dimensional
0.79–1.0, which is about an alveolar condition.                           computational studies of transport phenomena in the
  From the above results, it can be concluded that the                    nasal cavity were carried out under different environmen-
nasal cavity balances the inhaled air with the internal                   tal conditions. In all cases, the inhaled air was heated and
conditions of the body with remarkable efficiency, and is                 moistened almost to the state of the nasal tissue before
almost independent of the surrounding air state. As a                     reaching the nasopharynx. Complex geometries increase
comparison, the influence of external conditions in                       the rate of local transfer of heat and moisture by improv-
Figs. 7 and 8 shows the temperature and concentration                     ing mixing and maintaining thin boundary layers. A nor-
profiles on lines 1–4 from section 1–2 (Fig. 3). The X-                   mal nose can withstand various extreme conditions.
axis for Y was dimensionless by the value of the local                    However, irregularities in the blood supply or wetting of
maximum distance. And the concentration on all the ob-                    the surface can reduce the flow rate of heat or moisture in
tained numerical results is indicated as dimensionless,                   the inhaled air. Further research will need to improve de-
since it shows the mass fraction.                                         tailed descriptions of the heat transfer and humidification
  The results of Fig. 7 show the difference in                            dynamics.
temperature distribution on measuring lines 1–4. In all                     It should be noticed that for this study there are sev-
the results, it can be seen that the temperature of the in-               eral limitations. The first limitation is the grid size since
haled air tends to the conditions of the walls of the nasal               even most powerful computers cannot provide data from
cavity, that is, to the body temperature of 37 °C. As                     the numerical simulation for full three-dimensional cases
shown in Fig. 8, the concentration profiles on the meas-                  with all details of the nasal cavity. The second limitation
uring lines are the same under the same humidity condi-                   is the complexity of the implementation and analysis of
tions of the inhaled air. Like temperature values, the                    experimental data from the tomographic images for the
concentration of water vapor also tends to the condi-                     different nasal sinus. The third limitation is the tomo-
tions of the walls of the nasal cavity, that is, to a concen-             graphic apparatus, which gives only a limited number of
tration equal to 1.0.                                                     images.
  In this work, a realistic geometry of the human nasal                     The proposed 3D model has the potential for use as
cavity was used, but, however, it must be taken into ac-                  geometric standard in future computational studies, as
count that this geometry is not universal since each per-                 well as for use as a reference in diagnostics. The devel-
son has his own structure of the nasal concha. However,                   oped procedure can also be used to construct standard
the created three-dimensional geometry of the human                       nose geometries for various identifiable groups in a lar-
nasal cavity can be of great benefit as a standard nasal                  ger population.
replica for testing various conditions of ambient
temperature, relative humidity and the rate of inhaled                    Abbreviations
                                                                          CFD: Computational fluid dynamics; SIMPLE: Semi-Implicit Method for
air flow.                                                                 Pressure Linked Eqs.; CT: Computed tomographic; CAD: Computer-aided
                                                                          design

Conclusion                                                                Acknowledgements
                                                                          This work is supported by the grant from the Ministry of education and
This study is a comprehensive work on modeling the                        science of the Republic of Kazakhstan (AP08857306).
processes of heat and mass transfer in a 3D model of the
human nasal cavity. The purpose of this study was to                      Authors’contributions
use the proposed computational model to investigate the                   AI has made the conception and designs of the study, YZ, AA have made
                                                                          simulation, analysis and interpretation of data, AI has made modification and
dynamic ability of the nasal cavity to heat and moisten                   additional interpretation of data. The authors read and approved the final
the inhaled air in the studied area, similar to the nose so               manuscript.
that it is possible to comprehensively study the struc-
tural components.                                                         Funding
                                                                          This research received no specific grant from any funding agency in the
  Transport functions depend on accurate predictions of                   public, commercial or not-for-profit sectors.
the airflow nature. Therefore, the numerical model is
tested in an anatomically accurate computational model                    Availability of data and materials
by comparing simulated velocity profiles with values                      The datasets used and/or analyzed during the current study are available
                                                                          from the corresponding author on reasonable request.
from the measurement. The basic equations of the in-
compressible laminar air flow with constant viscosity                     Ethics approval and consent to participate
and thermal conductivity are the continuity, Navier -                     Not applicable.
Issakhov et al. Theoretical Biology and Medical Modelling (2021) 18:2 Page 12 of 12
Consent for publication 22. Issakhov A, Alimbek A, As I. A numerical study for the assessment of air
Not applicable. pollutant dispersion with chemical reactions from a thermal power plant.
Eng Appl Comput Fluid Mech. 2020b;14(1):1035–61. https://doi.org/10.1080/
Competing interests 19942060.2020.1800515.
The authors declare that there is no conflict of interests regarding the 23. Issakhov A, Imanberdiyeva M. Numerical simulation of the movement of
publication of this paper. water surface of dam break flow by VOF methods for various obstacles. Int J
Heat Mass Transf. 2019;136:1030–51.
Received: 23 April 2020 Accepted: 16 November 2020 24. Issakhov A, Zhandaulet Y. Numerical study of dam break waves on movable
beds for various forms of the obstacle by VOF method. Ocean Eng. 2020;
209:107459.
25. Issakhov A, Zhandaulet Y, Abylkassymova A. Numerical simulation of the
References water surface movement with macroscopic particles on movable beds.
1. Anderson, N.J., Cassidy, P.E., Janssen, L.L., Dengel, D.R., 2006. Peak inspiratory Water Resour Manag. 2020c;34(8):2291–311.
flows of adults exercising at light, moderate and heavy work loads. J.-Int. 26. Keyhani K, Scherer P, Mozell M. Numerical simulation of airflow in the
Soc. Respir Prot. 23, 53. human nasal cavity. J Biomech Eng. 1995;117:429–41.
2. Ball C, Uddin M, Pollard A. High resolution turbulence modelling of airflow 27. Lin C-L, Tawhai MH, McLennan G, Hoffman EA. Characteristics of the
in an idealised human extra-thoracic airway. Comput Fluids. 2008;37:943–64. turbulent laryngeal jet and its effect on airflow in the human intra-thoracic
3. Chen J, Gutmark E. Numerical investigation of airflow in an idealized human airways. Respir Physiol Neurobiol. 2007;157:295–309.
extra-thoracic airway: a comparison study. Biomech Model Mechanobiol. 28. Li C, Jiang J, Dong H, Zhao K. Computational modeling and validation of
2014;13:205–14. human nasal airflow under various breathing conditions. J Biomech. 2017;
4. Croce C, Fodil R, Durand M, Sbirlea-Apiou G, Caillibotte G, Papon J-F, 64:59–68.
Blondeau J-R, Coste A, Isabey D, Louis B. In vitro experiments and numerical 29. Lindemann J, Leiacker R, Rettinger G, Keck T. Nasal mucosal temperature
simulations of airflow in realistic nasal airway geometry. Ann Biomed Eng. during respiration. Clin Otolaryngol. 2002;27:135–9.
2006;34:997–1007. 30. Lindemann J, Kühnemann S, Stehmer V, Leiacker R, Rettinger G, Keck T.
5. Cole P. Some aspects of temperature, moisture and heat relationships in the Temperature and humidity profile of the anterior nasal airways of patients
upper respiratory tract. J Laryngol Otol. 1953;67:449–56. with nasal septal perforation. Rhinology. 2001;39:202–6.
6. Doorly D, Taylor D, Schroter R. Mechanics of airflow in the human nasal 31. Mylavarapu G, Murugappan S, Mihaescu M, Kalra M, Khosla S, Gutmark E.
airways. Respir Physiol Neurobiol. 2008c;163:100–10. Validation of computational fluid dynamics methodology used for human
7. Doorly D, Taylor D, Franke P, Schroter R. Experimental investigation of nasal upper airway flow simulations. J Biomech. 2009;42:1553–9.
airflow. Proc Inst Mech Eng Part H. 2008a;222:439–53. 32. McFadden ER. Respiratory heat and water exchange: physiological and
8. Doorly D, Taylor D, Gambaruto A, Schroter R, Tolley N. Nasal architecture: clinical implications. J Appl Physiol. 1983;54:331–6.
form and flow. Philos Trans R Soc Lond A: Math Phys Eng Sci. 2008b;366: 33. Naftali S, Schroter RC, Shiner R, Elad DJ. Transport Phenomena in the
3225–46. Human Nasal Cavity: A Computational Model. Ann Biomed Eng. 1998;26:
9. Garcia GJM, Schroeter JD, Kimbell JS. Olfactory deposition of inhaled 831–9..
nanoparticles in humans. Inhal Toxicol. 2015;27:394–403. 34. Naftali S, Rosenfeld M, Wolf M, Elad D. The air-conditioning capacity of the
10. Girardin M, Bilgen E, Arbour P. Experimental study of velocity fields in a human human nose. Ann Biomed Eng. 2005;33:545–53.
nasal fossa by laser anemometry. Ann Otol Rhinol Laryngol. 1983;92:231–6. 35. Na Y, Chung KS, Chung SK, Kim SK. Effects of single-sided inferior
11. Hahn I, Scherer PW, Mozell MM. Velocity profiles measured for airflow turbinectomy on nasal function and airflow characteristics. Respir Physiol
through a large-scale model of the human nasal cavity. J Appl Physiol. 1993; Neurobiol. 2012;180:289–97.
75:2273–87. 36. Pérez-Mota J, Solorio-Ordaz F, Cervantes-de Gortari J. Flow and air
12. Hanna LM, Scherer PW. Measurement of local mass transfer coefficients in a conditioning simulations of computer turbinectomized nose models. Med
cast model of the human upper respiratory tract. J Biomech Eng. 1986;108:12–8. Biol Eng Comput. 2018;56(10):1899–910.
13. Ingelstedt S. Studies on conditioning of air in the respiratory tract. Acta 37. Rennie CE, Gouder KA, Taylor DJ, Tolley NS, Schroter RC, Doorly DJ. Nasal
Otolaryngol Suppl. 1956;131:1–80. inspiratory flow: at rest and sniffing. Int Forum Allergy Rhinol. 2011;1:128–35.
14. Issakhov A, Abylkassymova A. Application of parallel computing 38. Varghese SS, Frankel SH, Fischer PF. Direct numerical simulation of stenotic
Technologies for Numerical Simulation of air transport in the human nasal flows. Part 1. Steady flow JFluid Mech. 2007;582:253–80.
cavity. Innovative computing, optimization and its applications. Stud 39. Vinchurkar S, De Backer L, Vos W, Van Holsbeke C, De Backer J, De Backer
Comput Intell. 2018;741:131–49. W. A case series on lung deposition analysis of inhaled medication using
15. Issakhov A., Bulgakov R., Zhandaulet Y. Numerical simulation of the functional imaging based computational fluid dynamics in asthmatic
dynamics of particle motion with different sizes. Eng Appl Comput Fluid patients: effect of upper airway morphology and comparison with in vivo
Mech, 2019a, 13:1, 1–25. data. Inhal Toxicol. 2012;24:81–8.
16. Issakhov A, Bulgakov R, Zhandaulet Y. Numerical study of the dynamics of 40. Wang T, Chen D, Wang P, Chen J, Deng J. Investigation on the nasal airflow
particles motion with different sizes from coal-based thermal power plant. characteristics of anterior nasal cavity stenosis. Braz J Med Biol Res. 2016;49.
Int J Nonlinear Sci Numerical Simul. 2019b;20(2):223–41 https://doi.org/10. 41. Wang Y, Elghobashi S. On locating the obstruction in the upper airway via
1515/ijnsns-2018-0182. numerical simulation. Respir Physiol Neurobiol. 2014a;193:1–10.
17. Issakhov A, Mashenkova A. Numerical study for the assessment of pollutant 42. Weinhold I, Mlynski G. Numerical simulation of airflow in the human nose.
dispersion from a thermal power plant under the different temperature Eur. Arch. Oto-rhino-Laryngol. Head Neck. 2004;261:452–5.
regimes. Int J Environ Sci Technol. 2019;16(10):6089–112 https://doi.org/10. 43. Webb P. Air temperatures in respiratory tracts of resting subjects. J Appl
1007/s13762-019-02211-y. Physiol. 1951;4:378–82.
18. Issakhov A., Zhandaulet Y. Numerical simulation of thermal pollution zones’ 44. Wang Y, Elghobashi S. On locating the obstruction in the upper airway via
formations in the water environment from the activities of the power plant. numerical simulation. Respir Physiol Neurobiol. 2014b;193:1–10.
Eng Appl Comput Fluid Mech, 2019a, 13:1, 279–299. 45. Zhang Z, Kleinstreuer C. Laminar-to-turbulent fluid–nanoparticle dynamics
19. Issakhov A, Zhandaulet Y. Numerical study of Technogenic thermal simulations: model comparisons and nanoparticle-deposition applications.
pollution zones’ formations in the water environment from the activities of Int J Numer Methods Biomed Eng. 2011;27:1930–50.
the power plant. Env Model Assess. 2019b; https://doi.org/10.1007/s10666- 46. Issakhov A, Alimbek A, Zhandaulet Y. The assessment of water pollution by
019-09668-8. chemical reaction products from the activities of industrial facilities:
20. Issakhov A, Omarova P. Numerical simulation of pollutant dispersion in the Numerical study. J Clean Prod. 2020:125239.
residential areas with continuous grass barriers. Int J Environ Sci Technol.
2019; https://doi.org/10.1007/s13762-019-02517-x.
21. Issakhov A, Omarova P, As I. Numerical study of thermal influence to Publisher’s Note
pollutant dispersion in the idealized urban street road. Air Qual Atmosphere Springer Nature remains neutral with regard to jurisdictional claims in
Health. 2020a;13:1045–56. https://doi.org/10.1007/s11869-020-00856-0. published maps and institutional affiliations.You can also read