Effects of solar activity and galactic cosmic ray cycles on the modulation of the annual average temperature at two sites in southern Brazil ...
←
→
Page content transcription
If your browser does not render page correctly, please read the page content below
Ann. Geophys., 36, 555–564, 2018
https://doi.org/10.5194/angeo-36-555-2018
© Author(s) 2018. This work is distributed under
the Creative Commons Attribution 4.0 License.

Effects of solar activity and galactic cosmic ray cycles on the
modulation of the annual average temperature at two sites in
southern Brazil
Everton Frigo1 , Francesco Antonelli1 , Djeniffer S. S. da Silva1 , Pedro C. M. Lima1 , Igor I. G. Pacca2 , and
José V. Bageston3
1 UniversidadeFederal do Pampa, Campus Caçapava do Sul, Caçapava do Sul, Brazil
2 Departamento de Geofísica, Instituto de Astronomia, Geofísica e Ciências Atmosféricas,
Universidade de São Paulo, São Paulo, Brazil
3 Southern Regional Space Research Center, National Institute for Space Research, Santa Maria, Brazil

Correspondence: Everton Frigo (evertonfrigo@unipampa.edu.br)

Received: 29 August 2017 – Revised: 1 February 2018 – Accepted: 26 February 2018 – Published: 3 April 2018

Abstract. Quasi-periodic variations in solar activity and         intermittent. Four temperature maxima, separated by around
galactic cosmic rays (GCRs) on decadal and bidecadal              20 years, were detected in the same years at both weather sta-
timescales have been suggested as a climate forcing mech-         tions. These temperature maxima are almost coincident with
anism for many regions on Earth. One of these regions is          the maxima of the odd solar cycles. Furthermore, these max-
southern Brazil, where the lowest values during the last          ima occur after transitions from even to odd solar cycles, that
century were observed for the total geomagnetic field in-         is, after some years of intense GCR flux. The obtained re-
tensity at the Earth’s surface. These low values are due to       sults offer indirect mathematical evidence that solar activity
the passage of the center of the South Atlantic Magnetic          and GCR variations contributed to climatic changes in south-
Anomaly (SAMA), which crosses the Brazilian territory             ern Brazil during the last century. A comparison of the re-
from east to west following a latitude of ∼ 26◦ . In areas with   sults obtained for the two weather stations indicates that the
low geomagnetic intensity, such as the SAMA, the incidence        SAMA also contributes indirectly to these temperature vari-
of GCRs is increased. Consequently, possible climatic effects     ations. The contribution of other mechanisms also related to
related to the GCRs tend to be maximized in this region. In       solar activity cannot be excluded.
this work, we investigate the relationship between the ∼ 11-      Keywords. Meteorology and atmospheric dynamics (clima-
year and ∼ 22-year cycles that are related to solar activity      tology)
and GCRs and the annual average temperature recorded be-
tween 1936 and 2014 at two weather stations, both located
near a latitude of 26◦ S but at different longitudes. The first
of these stations (Torres – TOR) is located in the coastal re-    1   Introduction
gion, and the other (Iraí – IRA) is located in the interior,
around 450 km from the Atlantic Ocean. Sunspot data and           The effects of solar variability on terrestrial climate are dis-
the solar modulation potential for cosmic rays were used as       cussed in several works (e.g., Wilcox, 1975; Hoyt and Schat-
proxies for the solar activity and the GCRs, respectively. Our    ten, 1997; Shaviv, 2005; Kirkby, 2007; Solanki et al., 2013).
investigation of the influence of decadal and bidecadal cy-       Some of these works suggest that climatic modulation occurs
cles in temperature data was carried out using the wavelet        indirectly, through the action of galactic cosmic rays (GCRs)
transform coherence (WTC) spectrum. The results indicate          (e.g., Svensmark and Friis-Christensen, 1997). GCRs are
that periodicities of 11 years may have continuously modu-        predominantly positively electrically charged particles; al-
lated the climate at TOR via a nonlinear mechanism, while         though these contribute very little to the energy input, they
at IRA, the effects of this 11-year modulation period were        are very important in the ionization processes in the Earth’s

Published by Copernicus Publications on behalf of the European Geosciences Union.
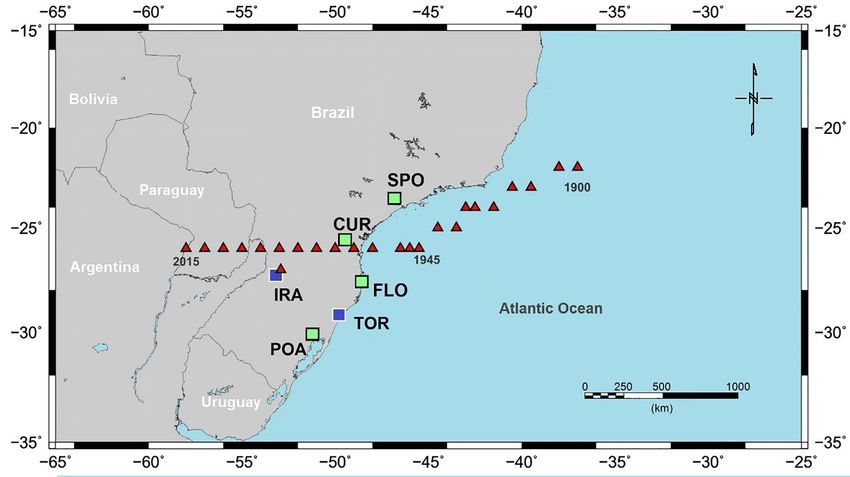
556                                                    E. Frigo et al.: Effects of solar activity and galactic cosmic ray cycles

atmosphere (Carslaw et al., 2002). The entrance of GCRs            influence of the geomagnetic field on climatic variations dur-
to the atmosphere is modulated by the magnetic fields of           ing the last century (e.g., Vieira and da Silva, 2006; Courtillot
the Sun and the Earth. This solar modulation is due to the         et al., 2007; Frigo et al., 2013; Campuzano et al., 2016).
time variation in the intensity of the Sun’s magnetic field           Frigo et al. (2013) investigated the spectral coherence be-
and its polarity reversals (Kudela, 2009), and solar magnetic      tween the 11- and 22-year solar activity cycles and the yearly
variations can explain the periodic components of ∼ 11 and         average temperatures recorded during the last century at four
∼ 22 years in GCRs. Geomagnetic modulation occurs in both          weather stations located in southern Brazil’s coastal region.
space and time. The spatial modulation is due to the direc-        This region showed smaller values of geomagnetic intensity
tional configuration of the geomagnetic field lines, which         in the 20th century, due to the presence of the South At-
are vertical close to the magnetic poles and nearly horizon-       lantic Magnetic Anomaly (SAMA). The results of wavelet
tal around the equator, meaning that the GCR flux is at a          coherence analysis indicated that a periodicity of around 22
maximum in the polar regions and at a minimum in equa-             years was persistent in climatic data recorded between 1933
torial regions. The temporal modulation is due to slow ge-         and 2008. Moreover, the results indicated a linear relation-
omagnetic changes, which are usually significant at secular        ship between temperature variations and the ∼ 22-year cy-
or larger scales. When geomagnetic excursions or polarity          cle. This result was obtained from data from the two weather
reversals occur, the geomagnetic intensity decreases dramati-      stations located nearest to the course of the SAMA. For two
cally, causing the GCR flux to increase (Wagner et al., 2000).     stations further away, the 22-year cycle was also persistent
   Dickinson (1975) indicated that ionization caused by GCR        during the investigated period, but the statistical results in-
flux variations could influence the mechanisms of cloud for-       dicated a nonlinear relationship between the bidecadal peri-
mation. Since then, researchers have made much effort to           odicity and temperature variations. In summary, the results
find evidence that could confirm or refute this possible rela-     of Frigo et al. (2013) indicated that a climatic modulation of
tionship between GCRs and climate. Svensmark and Friis-            ∼ 22 years, characteristic of GCRs, was persistent during the
Christensen (1997) found a positive correlation between            last century and was possibly at a maximum in the region
GCRs and global cloud cover over an 11-year solar cycle.           closest to the center of the SAMA.
Svensmark (2007) then complemented the analysis and con-              The aim of this work is to advance the analyses of Frigo
cluded that the relationship between GCRs and clouds is only       et al. (2013) by investigating the connections between tem-
valid for low-altitude clouds. The physical mechanism pro-         perature variability, solar activity and GCR variations during
posed to explain this correlation assumes that an increase in      the last century, including making use of climatological data
the air ionization in the atmosphere resulting from the in-        recorded in other weather stations in southern Brazil. A time
crease of GCR flux helps to form aerosols, which may grow          series of the solar modulation potential is used as a proxy for
and transform into the cloud condensation nuclei needed for        GCR variability.
water droplet condensation and thus the creation of low-
altitude clouds.                                                   2   Data and analysis method
   Discussions related to possible climatic modulation re-
lated to GCRs led to the development of the Cosmics Leav-          The total intensity of the geomagnetic field in southern South
ing Outdoor Droplets (CLOUD) experiment. Results ob-               America has been strongly affected by the SAMA over the
tained from CLOUD have contributed to improvements in              last century. The center of the SAMA, defined as the point
the understanding of cloud microphysical phenomena involv-         at which the lowest geomagnetic intensity value is observed,
ing nucleation, growth and aerosols. However, the effects of       moved in a southwesterly direction between 1900 and 1945,
GCRs on clouds remain insufficiently understood (Pierce,           close to the Brazilian coast (Fig. 1). After 1945, the center of
2017). On the other hand, most of the scientific works on          the SAMA crossed southern Brazil, following a straight line
this topic are based on an analysis of climatic and paleocli-      in a westerly direction at a latitude of approximately 26◦ S
matic data that aims to evaluate the GCRs–climate relation-        (Hartmann and Pacca, 2009). According to the International
ship, taking into account different scenarios of climate, solar    Geomagnetic Reference Field (IGRF), the value of the geo-
activity and geomagnetic fields at different temporal and spa-     magnetic intensity at the center of the SAMA has decreased
tial scales (e.g., Wagner et al., 2001; Miyahara et al., 2008;     from about 25 500 nT to about 22 500 nT since 1900. This de-
Erlykin and Wolfendale, 2011; Svensmark, 2012; Myhre et            crease can amplify certain effects related to the penetration of
al., 2014). For example, Kitaba et al. (2017) found a very         electrically particles in the Earth’s atmosphere.
interesting connection between GCRs and climate at a geo-             In the region near to the trajectory of the center of
logical timescale. Through analyzing pollen data from Osaka        the SAMA, several weather stations have been estab-
Bay, Japan, they found that the thermal gradient between land      lished. These stations are maintained by the Brazilian Na-
and ocean changed as a consequence of the insolation de-           tional Institute of Meteorology (INMET). Data from São
crease during geomagnetic polarity reversals. This result is       Paulo (SPO), Curitiba (CUR), Florianópolis (FLO) and Porto
in agreement with the argument made by Svensmark (2007).           Alegre (POA) were used in the previous investigation by
However, there are few works reporting the possible indirect       Frigo et al. (2013). The positions of these stations are indi-

Ann. Geophys., 36, 555–564, 2018                                                           www.ann-geophys.net/36/555/2018/
E. Frigo et al.: Effects of solar activity and galactic cosmic ray cycles                                                          557

Figure 1. Map of southern South America indicating the positions of the center of the SAMA between 1900 and 2015 (red triangles),
locations of the weather stations used by Frigo et al. (2013) (green squares) and the weather stations used in this work (blue squares).

Figure 2. Time series of the sunspot cycle: (a) with solar cycles and (b) the double sunspot cycle SN22.

cated in Fig. 1. However, in this study we expand our anal-             in 1755. The SN data, obtained from the website of the So-
ysis, using a new, longer temperature time series recorded              lar Influences Data Analysis Center (http://sidc.oma.be/, last
at the Torres (TOR) and Iraí (IRA) weather stations. TOR is             access: 10 January 2018) for the period between 1936 and
located on the coast, around 260 km south of FLO. IRA is lo-            2014, are presented in Fig. 2a. Every 11 years, the magnetic
cated within the continental area of southern Brazil, around            polarity of the Sun reverses. Thus, it takes 22 years for the
450 km from the coast. Between 1980 and 1995, the center                same state of polarity to repeat itself. To investigate possi-
of the SAMA passed very near to the IRA station.                        ble effects associated with the polarity of the Sun’s magnetic
   In order to investigate the possible effects of solar activity       field, we multiplied the SN numbers by −1 for the odd so-
on climate in the SAMA region, we use the time series of the            lar cycles. This procedure has already been used in previous
yearly mean total sunspot number (SN). SN varies in phase               work (e.g., Souza Echer et al., 2008). The resulting time se-
with the solar irradiance and the solar magnetic field inten-           ries, denoted by SN22, is called the double sunspot cycle and
sity, exhibiting a clear cycle of around 11 years. This periodic        is presented in Fig. 2b.
variation is called the sunspot cycle. Each solar cycle gener-             Ground measurements of neutrons, produced by primary
ally receives a number, beginning with the cycle that began             cosmic rays when they reach the atmosphere, are the main

www.ann-geophys.net/36/555/2018/                                                                    Ann. Geophys., 36, 555–564, 2018
558                                                      E. Frigo et al.: Effects of solar activity and galactic cosmic ray cycles

Figure 3. (a) Time series of yearly neutron counts at the Climax Observatory, (b) the modulation potential, (c) the approximately 11-year
component of the modulation potential, and (d) the approximately 22-year component of the modulation potential. Note that the vertical
scale of (a) is inverted to facilitate a comparison with (b).

proxy for GCR variations. However, long-term neutron time              al., 2011; McCracken and Beer, 2015). In this work, we use
series are not available for the beginning of the 20th cen-            the proxy proposed by Usoskin et al. (2011), which consists
tury. One of the longest (1953–2006) neutron time series               of the reconstruction of the solar modulation potential (MP)
was recorded at the Climax Observatory (United States); the            for cosmic rays. The MP reconstruction covers the period
data for this were obtained from the Russian Institute of              between 1936 and 2009 and is constructed using data from
Terrestrial Magnetism, Ionosphere and Radio Wave Propa-                ground-based ionization chambers (from 1936 to 1951), In-
gation website (http://cr0.izmiran.ru/clmx/main.htm, last ac-          ternational Geophysical Year (IGY) neutron monitors (from
cess: 28 December 2017) and are shown in Fig. 3a. It is                1951 to 1964) and a ground-based network of neutron moni-
well known that GCRs vary in antiphase with the intensity              tors (from 1964 to 2009). The MP reconstruction time series
of the Sun’s magnetic field over an 11-year solar cycle; due           is indicated for studies of cosmic-ray-induced atmospheric
to this, several authors have used sunspot number counts as            ionization, which plays a key role in the GCRs–cloud cli-
a proxy for GCR variations. However, more reliable proxies             mate mechanisms. The annual values of MP, extended until
of GCR variability are currently available (e.g., Usoskin et           2014, were obtained from the website of the University of

Ann. Geophys., 36, 555–564, 2018                                                                www.ann-geophys.net/36/555/2018/
E. Frigo et al.: Effects of solar activity and galactic cosmic ray cycles                                                      559

Oulu (http://cosmicrays.oulu.fi/phi/Phi_mon.txt, last access:     The variations in TOR and IRA temperature data are very
7 December 2017) and are presented in Fig. 3b. The simi-          similar; however, due to the proximity of the Atlantic Ocean,
larity between the MP, yearly neutron counts at the Climax        the long-term trend and temperature variation amplitudes for
Observatory (Fig. 3a) and SN time series (Fig. 2a) is clear;      TOR are smaller than those observed for IRA. It is also clear
this is because the most striking feature of the solar magnetic   that the occurrence of some maximum temperature events
field in the last century is the approximately 11-year period-    occurred almost simultaneously at the two weather stations.
icity, which is the main modulation component of GCRs. If         Examples of this are the maxima observed in 1939–1940,
the MP varies in phase with solar magnetic field intensity, it    1961, 1977 and 2001–2002. It is interesting to note that these
varies in antiphase with GCRs.                                    maxima occur next to the SN22 minima, with a few years’
   According to Usoskin et al. (2011) the GCRs, and con-          time lag. In addition, the average difference between subse-
sequently the MP, show a dominant 11-year cycle and a             quent maxima is around 20 years.
secondary component of around 22 years. This secondary               In order to investigate the mathematical relationship be-
component is due to the alternation of the Sun’s magnetic         tween solar activity, GCR and temperature data, wavelet
field polarity and because GCRs are predominantly posi-           transform coherence (WTC) analysis is used. The WTC is
tively electrically charged particles. During polarity transi-    calculated using the individual continuous wavelet trans-
tions from even to odd solar cycles, the GCR flux remains         forms and the cross-wavelet transform of the two time series
at a maximum for a period which is longer than that ob-           involved. The computational program used was developed
served during transitions from odd to even cycles (Usoskin        by Grinsted et al. (2004) and allows us to estimate values
et al., 2001). Using a time series iterative regression analy-    for the coherence coefficient and the phase angles between
sis (ARIST), as described in Rigozo et al. (2005), we can         two series as a function of frequency and time. Coherence
separate and reconstruct the contributions of the individ-        values range from 0 to 1, where the highest values are as-
ual ∼ 11- and ∼ 22-year components of the MP series. The          sociated with high coherency. Phase angles are represented
ARIST method consists of adjusting the observational data         by arrows, and those that are pointing to the right indicate
using a sinusoidal function, aiming at each iteration to de-      a linear in-phase relationship. In these cases, the maxima or
crease the difference between the adjusted function and the       minima observed in one time series are coincident with the
observed data. As a result, ARIST provides the amplitude,         maxima or minima observed in the other. Arrows pointing to
the angular frequency and the phase associated with each pe-      the left indicate a linear antiphase relationship. In these cases,
riodicity detected in the analyzed time series.                   a maximum (minimum) observed in one series is coincident
   For the ∼ 11-year component of MP, referred to here as         with a minimum (maximum) observed in the other series. Ar-
MP11, values were obtained of 224.171 for the amplitude,          rows pointing in any other direction indicate a nonlinear re-
0.09187 for the frequency and 1.87119 for the phase. For the      lationship. In these cases, maxima and minima are observed
∼ 22-year component of MP, referred to here as MP22, val-         in the two analyzed time series, but there is a time lag be-
ues were obtained of 66.222 for the amplitude, 0.04460 for        tween them. This time lag must be due to the contribution of
the frequency and 6.08605 for the phase. The time series of       other variables or phenomena not considered in this analy-
the ∼ 11- and ∼ 22-year components of MP, computed us-            sis. The WTC results also show a cone of influence, which
ing the second term of the right-hand side of Eq. (14) in         limits a region of statistical confidence for the computed co-
Rigozo (2005), are shown in Fig. 3c and d, respectively. A        herence values. In the spectral region outside the cone, edge
comparison between MP11 and SN indicates that the two             effects cannot be neglected (Grinsted et al., 2004). This is a
time series are very similar, with maxima and minima almost       limitation of the WTC method and is most important in the
coincident throughout the investigated period. The maximum        analysis of coherence values related to long periodicities.
time difference observed between the occurrence of maxima
or minima in MP11 and SN was 2 years. A comparison be-            3   Results and discussion
tween MP22 and SN22 shows that the series are very similar
but vary in anti-correlation with each other. The maximum         The WTC between SN and temperature obtained at TOR is
time lag between the occurrence of maxima or minima in            shown in Fig. 5a. The results indicate that the spectral co-
MP22 and SN22 is also 2 years. The results of these compar-       herence between SN and the temperature at TOR for peri-
isons indicate that the series of SN and SN22 can be used as      odicities of around 11 years was persistent and was higher
proxies for the 11- and 22-year components of GCR variation       than 0.65 for the whole period investigated. Phase angles pre-
in studies investigating the effects of GCRs on climate.          dominantly point downwards. This configuration indicates a
   The climatological data used in this work consist of the       nonlinear relationship between the 11-year quasi-cycles and
mean annual temperature values calculated for TOR and IRA         the data from TOR. For IRA, the coherence between SN and
weather stations (Fig. 4a and b). The annual averages were        temperature was intermittent, as presented in Fig. 5b, and
computed from the recorded monthly averages for the pe-           was only higher than 0.65 until 1970 and in the 1995–2014
riod 1936–2014. The interannual variability and the increas-      interval. In these intervals, the phase angles usually point
ing trend are evident in the TOR and IRA temperature data.        down, suggesting a nonlinear relationship. Coherence val-

www.ann-geophys.net/36/555/2018/                                                            Ann. Geophys., 36, 555–564, 2018
560 E. Frigo et al.: Effects of solar activity and galactic cosmic ray cycles
Figure 4. Time series of yearly average temperatures at southern Brazil weather stations: (a) TOR and (b) IRA.
The quasi-11-year cycle in the SN data (see Fig. 2a) is
directly correlated to the variations in both solar irradiance
and the Sun’s magnetic field intensity. Therefore, it is not
possible to establish whether the periodicities of ∼ 11 years
detected in the temperature time series are due to solar irradi-
ance or to the GCRs. Frigo et al. (2013) found high values for
spectral coherence between SN and temperature data for the
weather stations of SPO, CUR and FLO. However, these high
coherence values were intermittent at these stations during
the investigated period. On the other hand, for the POA sta-
tion, the values of coherence were continuously greater than
0.6. Since the POA station is located about 165 km south of
TOR (that is, this weather station is closer to POA than IRA),
we would expect the results from TOR to be more similar to
POA and the reverse to be true for IRA.
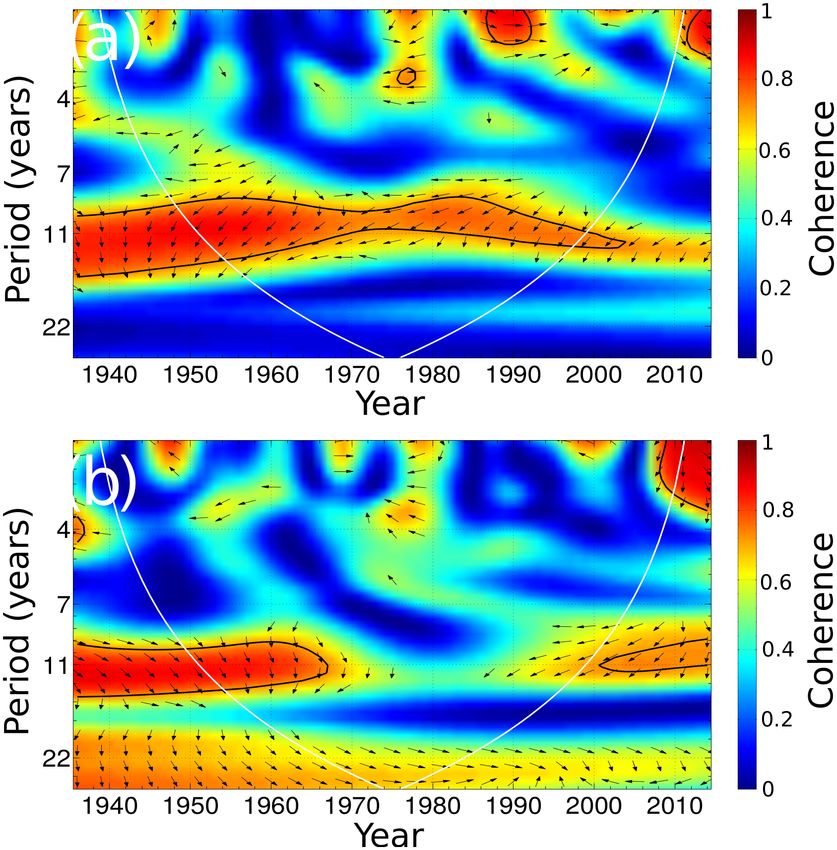
Figure 6a shows the WTC between SN22 and the TOR
temperature data. The WTC showed high values of coher-
ence near 22-year periodicity between 1975 and 2014. For
this time interval, the phase angle analysis arrows predom-
inantly point left. This configuration indicates a linear an-
tiphase relationship between the time series. In Fig. 5b, it
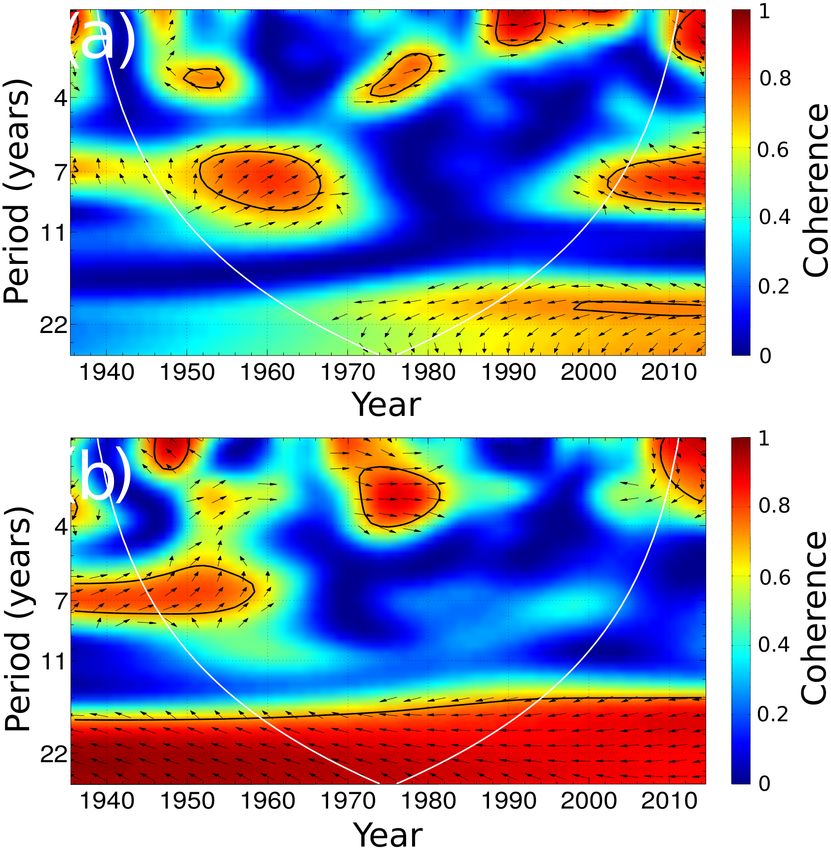
Figure 5. Wavelet coherence spectrum between annual average can be seen that the WTC between SN22 and the tempera-
temperature for (a) TOR and SN and (b) IRA and SN. The colors ture at IRA was continuous and showed high coherence val-
indicate the coherence coefficient: black arrows represent the phase ues for periodicities around 22 years. For these periodicities,
angle between the temperature and the sunspot cycle; black lines the phase angles point mainly to the left, indicating a linear
limit areas within which coherence values have a confidence level
antiphase relationship between SN22 and temperature during
of 95 % against red noise; the white line indicates the area of the
the 1936–2014 time interval. These results are in agreement
cone of influence, below which edge effects cannot be neglected.
with the results of Frigo et al. (2013), which indicate a linear
relationship between SN22 and temperature for the weather
ues obtained for before ∼ 1950 and after ∼ 2000, shown in stations closest to the trajectory of the center of the SAMA.
Fig. 5a and b, are outside of the cone of influence, and the The time series of SN22 is an index related to the Sun’s
results should be considered carefully. The same care should magnetic polarity, which influences the GCR variability.
be taken in all analyses of the WTC spectra results. Therefore, high values of spectral coherence between SN22
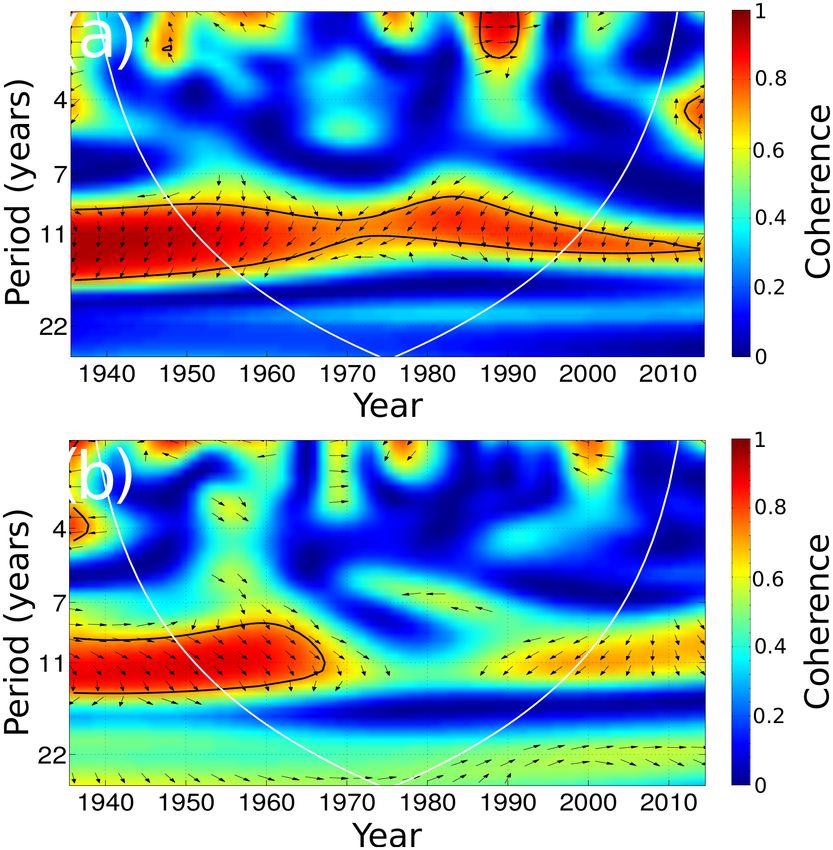
Ann. Geophys., 36, 555–564, 2018 www.ann-geophys.net/36/555/2018/E. Frigo et al.: Effects of solar activity and galactic cosmic ray cycles 561 Figure 6. Wavelet coherence spectrum between annual average Figure 7. Wavelet coherence spectrum between annual average of temperature for (a) TOR and SN22 and (b) for IRA and SN22. The the modulation potential and temperature for (a) TOR and (b) IRA. black arrows represent the phase angle between the temperature and The black arrows represent the phase angle between the modulation the double sunspot cycle. Further legend information is the same as potential and the temperature data. Further legend information is the for Fig. 5. same as for Fig. 5. and temperature for periodicities of around 22 years must climate for bidecadal periodicities. This difference can be ex- be associated with GCR variations. Frigo et al. (2013) found plained by the fact that the ∼ 22-year cycle is not a dominant high and continuous values of coherence for the four weather periodicity in the GCR spectrum, meaning that the coherence stations investigated. However, the mathematical evidence values for this periodicity in the WTC spectrum are small. for a linear relationship between SN22 and temperature was In addition, since the maxima temperature peaks are ev- only obtained for the SPO, CUR and FLO stations. These ident and the solar magnetic cycle modulation of the GCR three stations are the closest to the path followed by the cen- variations is known, it may be that the influence of the ter of the SAMA over southern Brazil in the last century. A bidecadal cycle only manifested as a ∼ 22 year peak in tem- similar situation is observed when the results for TOR and perature data rather than a continuous modulation follow- IRA are compared. A linear relationship between SN22 and ing a periodic function during the last century. As the ∼ 11- temperature is observed for the IRA weather station, clos- year periodicity modulation related to the solar irradiation or est to the path of the SAMA. This result reinforces the indi- GCRs is present in the temperature data, we suggest that fol- rect influence of the geomagnetic field (through the SAMA) lowing transitions from even to odd solar cycles, some phys- and the solar activity (possibly through GCRs) on climate in ical mechanism connecting solar activity, GCRs and climate southern Brazil. is strengthened, causing the observed bidecadal maxima in The wavelet coherence spectra between MP and the tem- yearly averaged temperature data for southern Brazil. More- perature data from TOR and IRA are shown in Fig. 7a and b. over, the differences in the results obtained for TOR and IRA As suggested in the comparison between Figs. 2a and 3b, may be because TOR is located in the coastal region, while and considering periodicities of around 11 years, the results IRA is located in the continental region. Krahenbuhl (2015) of the coherence between MP and temperature are very sim- showed that the correlation between solar activity and GCR ilar to the results for the coherence between SN and tem- variation with climatic variation is dependent on the geo- perature. For periodicities of around 22 years, no significant graphical position. The differences in correlations are sig- values of coherence are observed in the TOR data. Low co- nificant when the marine and continental positions are com- herence values of around 0.4 were obtained for the IRA data pared. for the entire period investigated. These results, unlike those Another possible mechanism that can explain the relation- observed for the WTC between SN22 and temperature data, ship between the solar activity and the temperature varia- do not indicate a continuous relationship between GCRs and tions in southern Brazil involves the high-energy particle pre- www.ann-geophys.net/36/555/2018/ Ann. Geophys., 36, 555–564, 2018
562                                                     E. Frigo et al.: Effects of solar activity and galactic cosmic ray cycles

cipitation (EPP). Occurrences of EPP in the SAMA region                Although the maxima of SN22 are associated with the
coming from the Van Allen radiation belts are discussed in          maxima of even solar cycles, and should be associated with
many works (e.g., Martin et al., 1972; Trivedi et al., 2005).       temperature maxima peaks, the temperature data do not show
Based on low-altitude satellite measurements, Grigoryan et          significant temperature maxima corresponding to the SN22
al. (2008) find that the point of maximum flux of electrons,        maxima. The more striking temperature maxima observed
protons, neutrons and gamma radiation shows positions and           occur after transitions from even to odd solar cycles. Dur-
drifts similar to that observed for the center of the SAMA          ing these transitions, the maximum in the GCR flux remains
in recent decades. Experimental results suggest that the pre-       over a longer time than that observed in transitions from odd
cipitation of relativistic electrons from the radiation belt can    to even solar cycles. This may be a feature of the modulation
influence the reactive nitrogen budget in the higher portions       of temperature by solar activity and GCRs in southern Brazil,
of the atmosphere, but the physical mechanism linking this          considering the values of the geomagnetic field and solar ac-
influence with the climate of the lower atmosphere has not          tivity observed during the 1936–2014 period. Other mecha-
yet been properly established (Mironova et al., 2015).              nisms also associated with solar activity, such as EEP, solar
   In addition to the mechanisms already mentioned, two             irradiance and UV radiation, cannot be discarded as factors
other possible mechanisms involving variations in the solar         contributing to the modulation of the southern Brazil temper-
irradiance have been suggested to explain the relationships         ature variations. Since all of these mechanisms are related to
between solar activity and climate. These are described in          solar activity, it is possible that they act together. From the
detail in Solanki et al. (2013). According to the first of these    results obtained in this work, it is not possible to quantify
mechanisms, radiation at the visible wavelength absorbed            the relative contribution of each of these mechanisms to the
by the Earth’s surface initiates a mechanism that develops          investigated temperature data.
from the bottom to the top, which influences the atmosphere            The results obtained in this work constitute indirect mathe-
and the oceans through changes in the intertropical conver-         matical evidence that solar activity and GCR cycles may con-
gence zone and tropical circulations. The second mechanism,         tribute to the modulation of the climate in the South Atlantic
which develops from the top to the bottom, is related to varia-     Magnetic Anomaly region. Future work is expected to in-
tions in the intensity of UV radiation in the stratosphere. This    clude the investigation of data from the last century in terms
mechanism is based on the fact that the variations in solar         of other climatic variables, such as rainfall and cloudiness,
activity during an 11-year cycle are more intense at shorter        using data from other weather stations in southern Brazil and
wavelengths, which include UV radiation. The variations in          satellite data from the upper levels of the Earth’s atmosphere
UV radiation modify the concentrations of ozone and lead to         (mesosphere–lower thermosphere).
changes in the atmospheric circulation dynamics. Solanki et
al. (2013) also suggest that these two mechanisms can work
together.                                                           Data availability. Temperature data recorded in the stations of IRA
                                                                    and TOR were provided by the Brazilian National Institute of Mete-
                                                                    orology (Instituto Nacional de Meteorologia – INMET). These data
4   Conclusion
                                                                    can be accessed in the Meteorological Database for Teaching and
                                                                    Research (Banco de Dados Meteorológicos para Ensino e Pesquisa
This work aimed to investigate climatic modulation by solar
                                                                    – BDMEP) of the INMET, on the website http://www.inmet.gov.br/
activity and GCRs in long-term temperature series recorded
                                                                    portal/index.php?r=bdmep/bdmep (INMET, 2018). Pre-1960 data
at two weather stations located in southern Brazil. The re-         are being digitized and should be available online soon. These an-
sults indicated that periodicities of ∼ 11 and ∼ 22 years may       cient data, not yet digitized, can be obtained from the INMET units.
have modulated the climatic variability in southern Brazil be-
tween 1936 and 2014. Four temperature maxima were ob-
served in IRA and TOR weather station records. The results          Competing interests. The authors declare that they have no conflict
of WTC analysis indicate a linear relationship between SN22         of interest.
and temperature for the IRA station; this result is indirect
mathematical evidence in favor of the maximization of the
GCR effects on climate at IRA, due to its proximity to the tra-     Special issue statement. This article is part of the special issue
jectory of the center of the SAMA. The linear antiphase rela-       “Space weather connections to near-Earth space and the atmo-
tionship between SN22 and the temperature observed at IRA           sphere”. It is a result of the 6o Simpósio Brasileiro de Geofísica
indicates that the minima of SN22 are related to the maxima         Espacial e Aeronomia (SBGEA), Jataí, Brazil, 26–30 September
in temperature. The minima of SN22 correspond to the max-           2016.
ima of odd solar cycles, which in turn correspond to minima
in the GCR flux variations. Thus, the results obtained for IRA
                                                                    Acknowledgements. The authors thank the Brazilian National In-
corroborate the mechanism of Svensmark (2007), which sug-
                                                                    stitute of Meteorology for providing the temperature data for the
gests that temperature maxima (minima) are related to GCR
                                                                    Iraí and Torres weather stations. The authors also thank the Uni-
minima (maxima).

Ann. Geophys., 36, 555–564, 2018                                                              www.ann-geophys.net/36/555/2018/
E. Frigo et al.: Effects of solar activity and galactic cosmic ray cycles 563
versidade Federal do Pampa (Unipampa), the Instituto de Astrono- Kudela, K.: On energetic particles in space, Acta Phys. Slovaca, 59,
mia, Geofísica e Ciências Atmosféricas da Universidade de São 537–652, 2009.
Paulo (IAG/USP) and the Southern Regional Center for Space Re- Martin, I. M., Rai, D. B., da Costa, J. M., Palmeira, R., and
search (CRS) of the National Institute for Space Research (INPE) Trivedi, N. B.: Enhanced Electron Precipitation in Brazilian
for institutional support. Everton Frigo is grateful to the Conselho Magnetic Anomaly in Association with Sudden Commencement,
Nacional de Desenvolvimento Científico e Tecnológico (CNPq) for Nature Physical Science, 240, 84–86, 1972.
financial support (universal call 01/2016, process 429068/2016-6). McCracken, K. G. and Beer, J.: The Annual Cosmic-Radiation In-
The authors also thank the reviewers for their important contribu- tensities 1391–2014; The Annual Heliospheric Magnetic Field
tions to this work. Strengths 1391–1983, and Identification of Solar Cosmic-Ray
The topical editor, Alisson Dal Lago, thanks three anonymous Events in the Cosmogenic Record 1800–1983, Sol. Phys., 290,
referees for help in evaluating this paper. 3051–3069, 2015.
Mironova, I. A., Aplin, K. L., Arnold, F., Bazilevskaya, G. A.,
Harrison, R. G., Krivolutsky, A. A., Nicoll, K. A., Rozanov,
E., Turunen, E., and Usoskin, I. G.: Energetic Particle Influ-
References ence on the Earth’s Atmosphere, Space Sci. Rev., 194, 1–96,
https://doi.org/10.1007/s11214-015-0185-4, 2015.
Campuzano, S. A., De Santis, A., Pavón-Carrasco, F. J., Osete, Miyahara, H., Yokoyama, Y., and Masuda, K.: Possible link be-
M. L., and Qamili, E.: Transfer Entropy between South At- tween multi-decadal climate cycles and periodic reversals of so-
lantic Anomaly and Global Sea Level for the last 300 years, Nat. lar magnetic field polarity, Earth Planet. Sc. Lett., 272, 290–295,
Hazards Earth Syst. Sci. Discuss., https://doi.org/10.5194/nhess- 2008.
2016-56, in review, 2016. Myhre, G., Shindell, D., Bréon, F.-M., Collins, W., Fuglestvedt,
Carslaw, K. S., Harrison, R. G., and Kirkby, J.: Cosmic rays, clouds, J., Huang, J., Koch, D., Lamarque, J.-F., Lee, D., Mendoza,
and climate, Science, 298, 1732–1736, 2002. B., Nakajima, T., Robock, A., Stephens, G., Takemura, T., and
Courtillot, V., Gallet, Y., Le Mouël, J.-L., Fluteau, F., and Genevey, Zhang, H.: Anthropogenic and Natural Radiative Forcing, in:
A.: Are there connections between the Earth’s magnetic field and Climate Change 2013: The Physical Science Basis. Contribution
climate?, Earth Planet. Sc. Lett., 253, 328–339, 2007. of Working Group I to the Fifth Assessment Report of the Inter-
Dickinson, R. E.: Solar variability and the lower atmosphere, B. governmental Panel on Climate Change, edited by: Stocker, T. F.,
Am. Meteorol. Soc., 56, 1240–1248, 1975. Qin, D., Plattner, G.-K., Tignor, M. S., Allen, K., Boschung, J.,
Erlykin, A. D. and Wolfendale, A. W.: Cosmic ray effects on cloud Nauels, A., Xia, Y., Bex V., and Midgley, P. M., Cambridge Uni-
cover and their relevance to climate change, J. Atmos. Sol.-Terr. versity Press, Cambridge, United Kingdom and New York, NY,
Phy., 73, 1681–1686, 2011. USA, 659–740, ISBN: 978-1-107-66182-0, 2014.
Frigo, E., Pacca, I. G., Pereira-Filho, A. J., Rampelloto, P. H., and Pierce, J. R.: Cosmic rays, aerosols, clouds, and climate: Recent
Rigozo, N. R.: Evidence for cosmic ray modulation in tempera- findings from the CLOUD experiment, J. Geophys. Res.-Atmos.,
ture records from the South Atlantic Magnetic Anomaly region, 122, 8051–8055, https://doi.org/10.1002/2017JD027475, 2017.
Ann. Geophys., 31, 1833–1841, https://doi.org/10.5194/angeo- Rigozo, N. R., Nordemann, D. J. R., Echer, E., Vieira, L. E. A., and
31-1833-2013, 2013. Faria, H. H.: Comparative study between four classical spectral
Grigorian, O. R., Romashova, V. V., and Petrov, A. N.: SAA drift: analysis methods, Appl. Math. Comput., 168, 411–430, 2005.
Experimental Results, Adv. Space Res., 41, 76–78, 2008. Shaviv, N. J.: On climate response to changes in the cosmic
Grinsted, A., Moore, J. C., and Jevrejeva, S.: Application of the ray flux and radiative budget, Geophys. Res., 110, A08105,
cross wavelet transform and wavelet coherence to geophys- https://doi.org/10.1029/2004JA010866, 2005.
ical time series, Nonlin. Processes Geophys., 11, 561–566, Solanki, S. K., Krivova, N. A., and Haigh, J. D.: Solar Irradiance
https://doi.org/10.5194/npg-11-561-2004, 2004. Variability and Climate, Annu. Rev. Astron. Astr., 51, 311–351,
Hartmann, G. A. and Pacca, I. G.: Time evolution of the South At- https://doi.org/10.1146/annurev-astro-082812-141007, 2013.
lantic Magnetic Anomaly, Ann. Brazilian Acad, Sciences, 81, Souza Echer, M. P., Echer, E., Nordemann, D. J. R., Rigozo, N.
243–255, 2009. R., and Prestes, A.: Wavelet analysis of a centennial (1895-
Hoyt, D. V. and Schatten, K. H.: The role of the sun in climate 1994) southern Brazil rainfall series (Pelotas, 31◦ 460 1900 S
change, Oxford University Press, New York, USA, 1997. 52◦ 200 3300 W), Clim. Change, 87, 489–497, 2008.
INMET: Temperature data recorded in the stations of IRA and Svensmark, H.: Cosmoclimatology: a new theory emerges, News
TOR, available at: http://www.inmet.gov.br/portal/index.php?r= Rev. Astron. Geophys., 48, 1.18–1.24, 2007.
bdmep/bdmep, last access: 27 March 2018. Svensmark, H.: Evidence of nearby supernovae affecting life on
Kirkby, J.: Cosmic Rays and Climate, Surv. Geophys., 28, 333–375, Earth, Mon. Not. R. Astron. Soc., 423, 1234–1253, 2012.
2007. Svensmark, H. and Friis-Christensen, E.: Variation of Cosmic Ray
Kitaba, I., Nakagawa, T., Hyodo, M., Katoh, S., Dettman, D. L., and Flux and Global Cloud Coverage – a Missing Link in Solar Cli-
Sato, H.: Geological support for the Umbrella Effect as a link mate Relationships, J. Atmos. Sol.-Terr. Phy., 59, 1225–1232,
between geomagnetic field and climate, Sci. Rep., 7, 40682, 1997.
https://doi.org/10.1038/srep40682, 2017. Trivedi, N. B., Abdu, M. A., Pathan, B. M., Dutra, S. L. G., Schuch,
Krahenbuhl, D. S.: Investigating a solar influence on cloud cover N. J., Santos, J. C., and Barreto, L. M.: Amplitude enhancement
using the North American Regional Reanalysis data, J. Space of SC(H) events in the South Atlantic anomaly region, J. Atmos.
Weather Spac., 5, 1–10, https://doi.org/10.1051/swsc/2015012, Sol.-Terr. Phy., 67, 1751–1760, 2005.
2015.
www.ann-geophys.net/36/555/2018/ Ann. Geophys., 36, 555–564, 2018564 E. Frigo et al.: Effects of solar activity and galactic cosmic ray cycles Usoskin, I., Mursula, K., Kananen, H., and Kovaltsov, G. A.: De- Wagner, G., Masarik, J., Beer, J., Baumgartner, S., Imboden, D., pendence of cosmic rays on solar activity for odd and even solar Kubik, P. W., Synal, H.-A., and Suter, M.: Reconstruction of the cycles, Adv. Space Res., 27, 571–576, 2001. geomagnetic field between 20 and 60 kyr BP from cosmogenic Usoskin, I. G., Bazilevskaya, G. A., and Kovaltsov, G. radionuclides in the GRIP ice core, Nucl. Instrum. Meth. B, 172, A.: Solar modulation parameter for cosmic rays since 597–604, 2000. 1936 reconstructed from ground-based neutron monitors Wagner, G., Livingstone, D. M., Masarik, J., Muscheler, R., and and ionization chambers, J. Geophys. Res., 116, A02104, Beer, J.: Some results relevant to the discussion of a possible link https://doi.org/10.1029/2010JA016105, 2011. between cosmic rays and the Earth’s climate, J. Geophys. Res., Vieira, L. E. A. and da Silva, L. A.: Geomagnetic modulation of 106, 3381–3387, 2001. clouds effects in the Southern Hemisphere Magnetic Anomaly Wilcox, J. M.: Solar activity and the weather, J. Atmos. Sol.-Terr. through lower atmosphere cosmic ray effects, Geophys. Res. Phy., 37, 237–256, 1975. Lett., 33, L14802, https://doi.org/10.1029/2006GL026389, 2006. Ann. Geophys., 36, 555–564, 2018 www.ann-geophys.net/36/555/2018/
You can also read