Update on recent developments in the CSP technology - GIZ
←
→
Page content transcription
If your browser does not render page correctly, please read the page content below
Update on recent developments in the CSP technology
Pedro Teixeira, 8
                                                                                28020 Madrid - España
                                                                                      T. +34 910 105 064
                                                                                   info@cspvalue.com
                                                                                  www.cspvalue.com

 Published by:

 Deutsche Gesellschaft für
 Internationale Zusammenarbeit (GIZ) GmbH
 Dag-Hammarskjöd-Weg 1-5
 65760 Eschborn, Germany
 T +49 (0) 6196-79-0
 F +49 (0) 6196-79-7291

 E info@giz.de
 I www.giz.de

 Responsible:
 Katharina Hay, GIZ

 Author:
 Rainer Kistner

 CSPvalue
 Pedro Teixeira 8
 28020 Madrid
 info@cspvalue.com

 Place and date of publication:
 Berlin, 2016

CSPvalue, S.L. CIF B04804712 C/ Sierra de la Contraviesa, 58 04240 Viator – Almería - España           2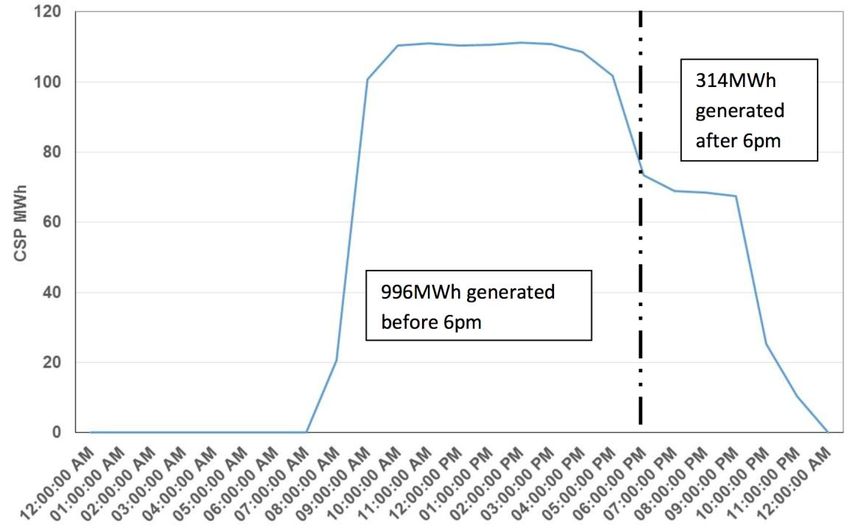
Pedro Teixeira, 8
                                                                                                28020 Madrid - España
                                                                                                      T. +34 910 105 064
                                                                                                   info@cspvalue.com
                                                                                                  www.cspvalue.com

                                                         INDEX

 1    EXECUTIVE SUMMARY ...................................................................................... 5

 2    THE LATEST COMMERCIAL CSP PROJECTS .................................................. 6

 3    QUO VADIS ….IN TERMS OF SIZE..................................................................... 7

 4    COSTS ................................................................................................................. 9

             4.1     Installed Costs ...................................................................................... 9
             4.2     Operation and Maintenance Costs ..................................................... 12
             4.3     Wet cooling versus dry cooling ........................................................... 13

 5    COST REDUCTION POTENTIAL / INNOVATION.............................................. 14

 6    PERFORMANCE ................................................................................................ 19

 7    LEVELIZED COSTS OF ELECTRICITY ............................................................. 25

 8    REFERENCES ................................................................................................... 30

CSPvalue, S.L. CIF B04804712 C/ Sierra de la Contraviesa, 58 04240 Viator – Almería - España                                3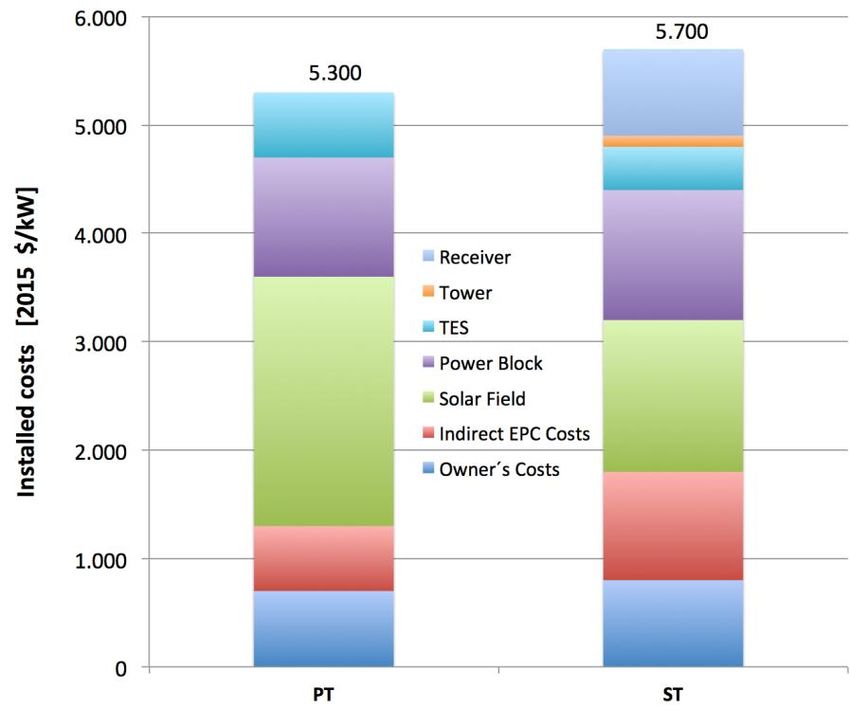
Pedro Teixeira, 8
                                                                                28020 Madrid - España
                                                                                      T. +34 910 105 064
                                                                                   info@cspvalue.com
                                                                                  www.cspvalue.com

 LIST of ACRONYMS

 COD                        Commercial Operation Date

 CSP                        Concentrated Solar Power

 DNI                        Direct Normal Irradiance

 EPC                        Engineering, Procurement, Construction

 FIT                        Feed-In Tariff

 flh                        Full load hours

 HTF                        Heat Transfer Fluid

 LCOE                       Levelized Costs of Electricity

 MW e                       Mega Watt electric

 O&M                        Operation & Maintenance

 PPA                        Power Purchase Agreement

 PT                         Parabolic Trough

 R&D                        Research & Development

 REIPPPP                    Renewable Energy Independent Power Producer Procurement
                            Programme

 SA                         South Africa

 ST                         Solar Tower

 SAM                        Solar Advisor Model

 TES                        Thermal Energy Storage

 WACC                       Weighted Average Costs of Capital

CSPvalue, S.L. CIF B04804712 C/ Sierra de la Contraviesa, 58 04240 Viator – Almería - España           4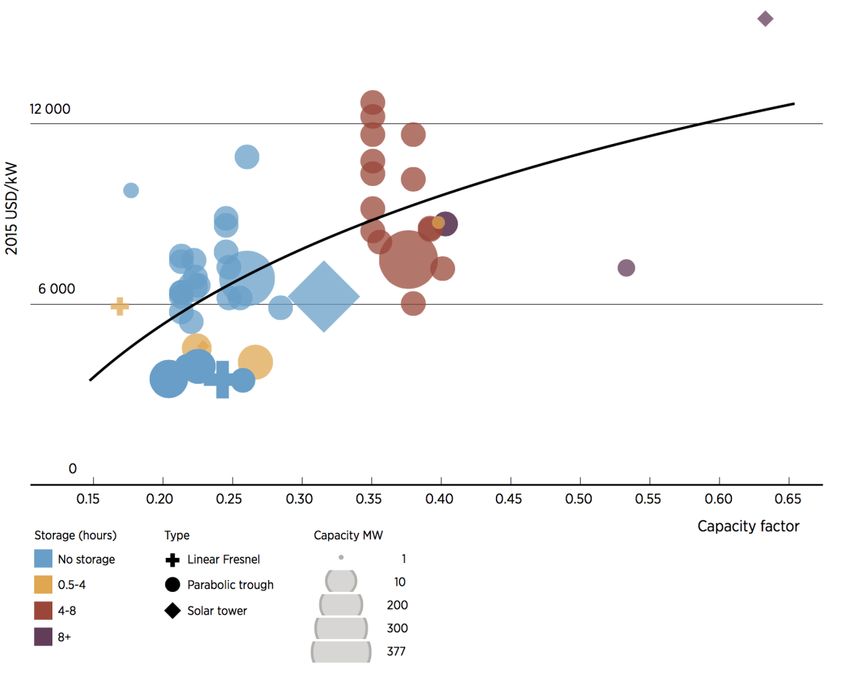
Pedro Teixeira, 8
                                                                                28020 Madrid - España
                                                                                      T. +34 910 105 064
                                                                                   info@cspvalue.com
                                                                                  www.cspvalue.com

 1           EXECUTIVE SUMMARY

 This report gives an update on CSP technology today in terms of costs and
 performance taking into consideration the latest CSP projects coming online since
 2013 in the USA, South Africa, and Morocco. The results of the report are based on
 the one hand on 20 years of experience of the author in the CSP sector (R&D,
 project development, EPC and O&M) and on the other hand on interviews with
 several EPC contractors, operators, technology providers and R&D experts in
 combination with a comprehensive desktop research of recent CSP publications.

 The latest generation of CSP power plants – both parabolic trough (PT) and solar
 tower (ST) projects – are characterized by increased capacities of up to 377MW e1.
 Several of the recent CSP projects with an increased size raised concerns about the
 plant performance during the ramp up from commissioning to the full production.
 Many of the here analyzed power plants are still at the beginning or in the middle of
 the ramp up period since some of the large CSP plants have foreseen a ramp up
 period of up to four years due to the huge amounts of heliostats or collector loops.
 For the more mature parabolic trough technology, a ramp up period of two years
 should be assumed to be reasonable.

 Especially after the “capacity jump” from the Spanish 50MW e standard size to the
 giant 250 -377MW e plant sizes in the US, one of the instructive questions is about the
 optimal size for a CSP power plant. The answer to the question is complex and
 should be rather based on real operational experience than on theoretical calculation.
 Definitely, the “Spanish” 50MW e size had been too small to make an advantage out
 of the economics of scale effect and the 250 – 377MW e capacity sizes seems to be
 very complex to ramp up. This report comes to the conclusion that for the time being
 a size of approx. 150MWe is a reasonable size for a CSP power plant.

 The actual system costs for a 150MW e reference power plant (with an approx. 8 hrs
 storage system) are estimated to be in the range of 5,500$/kW e for a PT and
 5,700$/kW e for ST projects. With technology innovations (e.g. high temperature
 HTFs, etc.) and increased operation experience the installed costs of a CSP power
 plant could be decreased by 33-37% until 2025 (or even before) to 3,600-3,700
 $/kW e. In general, ST plants have a slightly higher cost reduction potential compared
 to PT projects but still need to gain more operational experience. PT is a more
 mature technology with fewer risks and uncertainties than ST.

 Both, trough and tower technologies are today at a similar LCOE range of about
 15$c/kWhe to 19$c/kWhe (mainly depending on the solar radiation level and the
 financing conditions). The LCOE could be decreased by 37% to 10.4$c/kWhe in
 the next five to ten years for PT power plants and to 9.1$c/kWhe (=44% LCOE

 1
     the 377 MWe Ivanpah power plant (USA) in the world´s biggest CSP power plant

CSPvalue, S.L. CIF B04804712 C/ Sierra de la Contraviesa, 58 04240 Viator – Almería - España           5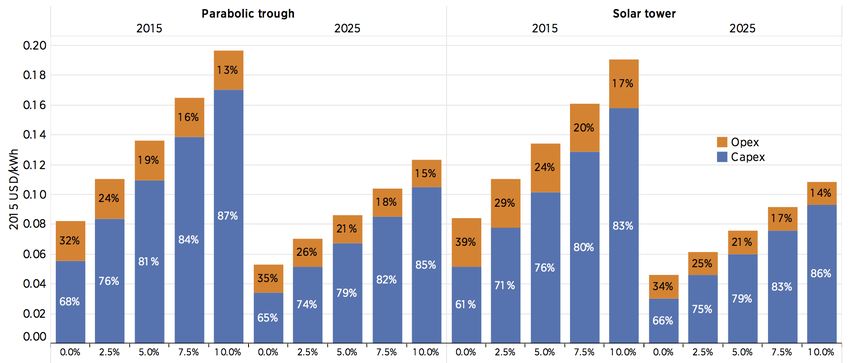
Pedro Teixeira, 8
                                                                                28020 Madrid - España
                                                                                      T. +34 910 105 064
                                                                                   info@cspvalue.com
                                                                                  www.cspvalue.com

 reduction) for ST power plants (in both cases assuming a DNI of 2550kWh/m2*yr
 and WACC of 7.5%). The key drivers to reduce the power generation costs of CSP
 plants are technology innovations, DNI, operation experience and financing
 conditions. LCOE are extremely sensitive to interest rates of the debt component and
 the IRR expectation of the equity investors. In the theoretical case of zero financing
 costs, the pure technology costs of a CSP plants would then be around 4-
 5$c/kWhe until 2025.

 Beside the pure cost figures, the CSP technology offers the added benefit of inherent
 thermal storage to provide dispatchable electricity whenever requested by the
 system, making CSP to a valuable contribution of many renewable energy portfolios.

 2          THE LATEST COMMERCIAL CSP PROJECTS

 After the CSP boom in Spain – with a total installed capacity of approx. 2300MW e –
 the CSP industry mainly focused in the recent years in three countries: USA, South
 Africa, and Morocco.

 USA:

 In the US you could see a short but intensive “CSP gold rush” mood. In less than
 twelve months (from December 2010 to September 2011) five “utility scale” CSP
 projects (with an average capacity of approx. 250MW e) have started construction. Of
 the five projects, three were PT (Solana, Mojave, and Genesis) and two were ST
 (Ivanpah and Crescent Dunes). One of the troughs and one of the tower projects
 includes thermal storage. The key facts are summarized in Table 1.

 From October 2013 until November 2015 the five new CSP plants in the US – with a
 total installed net capacity of 1,237MW e – went online. At the moment utilities, state
 energy regulators, and the financial community are evaluating the projects to
 determine if they are operating as planned (for more details see also Chapter 6
 “Performance”).

 SOUTH AFRICA:

 The South African Government developed a program to facilitate development and
 deployment of renewable energy technologies, called the Renewable Energy
 Independent Power Producer Procurement Program (REIPPPP). South Africa has
 approved 600MW e of CSP projects in a period of less than five years. The
 competitive bidding tariff system has seen a significant drop in tariffs from bid window
 1 to bid window 3.5.

 South Africa’s first CSP project KaXu Solar One, came online in February 2015. This
 plant was bid in Round 1 of the REIPPPP. KaXu Solar One is a 100MW PT plant. In

CSPvalue, S.L. CIF B04804712 C/ Sierra de la Contraviesa, 58 04240 Viator – Almería - España           6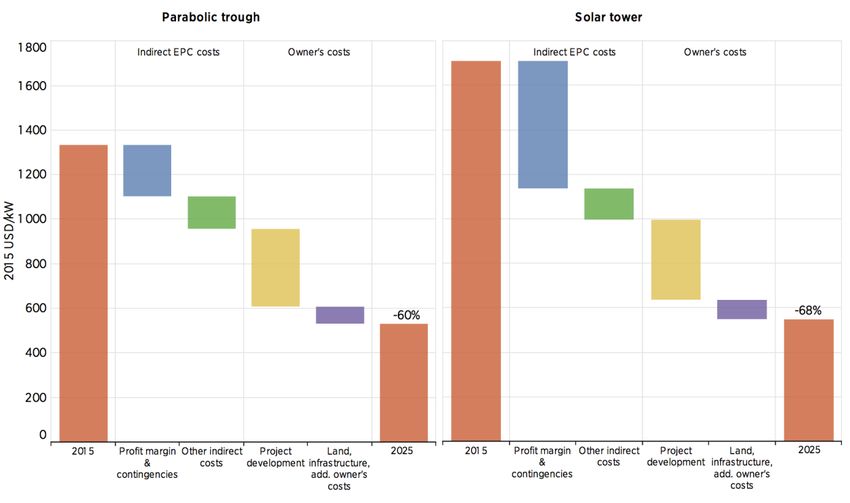
Pedro Teixeira, 8
                                                                                28020 Madrid - España
                                                                                      T. +34 910 105 064
                                                                                   info@cspvalue.com
                                                                                  www.cspvalue.com

 the same bid window Khi Solar One - a 50MW e superheated steam tower was
 awarded and came online in February 2016. The third South African CSP plant
 Bokpoort is a 50 MW e power plant that uses parabolic technology. This CSP power
 station has nine hours of storage and will be capable to supply electricity 24 hours.

 MOROCCO:

 Morocco has a target to develop 2GW e of solar power by 2020. The Renewable Law
 13-09, approved in 2010, provides a legal framework for the creation and operation
 of facilities producing electricity from renewable energy sources.

 In January 2016 the 160 MW e PT plant Noor 1 came online while and 300MW e (Noor
 2 and Noor 3) are still under construction. The latest announcement was a new
 tender for PV-CSP hybrid power plant in Morocco.

                   Table 1: List of commercial CSP projects completed since 2013

 3           QUO VADIS ….IN TERMS OF SIZE

 Over the last decade, we have seen a clear tendency towards CSP power plants –
 both PT and ST projects – with larger solar fields and bigger nominal capacities2.
 Historically the 50MW e nameplate capacity restriction in Spain was only due to
 political and legal reasons. Back in 1998 when the first commercial CSP feed-in tariff
 in Spain was issued, the government wanted to subsidize small “non-utility scale”
 renewable energy projects. Also in terms of permitting, it was easier to obtain permits
 for an IPP project of less than 50MW e. In other words: there was neither a technical,
 nor economical nor financial reason for the 50MW e limit in Spain.

 Most of the recent “post-Spanish” CSP plants opted for larger installed capacities;
 starting with the 100MW e Shams 1 project in Abu Dhabi. The recent South African
 projects (Khi, KaXu, and Bookport) have nominal nameplate capacity between
 50MW e and 100MW e while Morocco´s Noor 1 plant has a 160MW e net capacity.

 2
     Integrated Combined Cycle Power Plants (ISCC) are not considered here

CSPvalue, S.L. CIF B04804712 C/ Sierra de la Contraviesa, 58 04240 Viator – Almería - España           7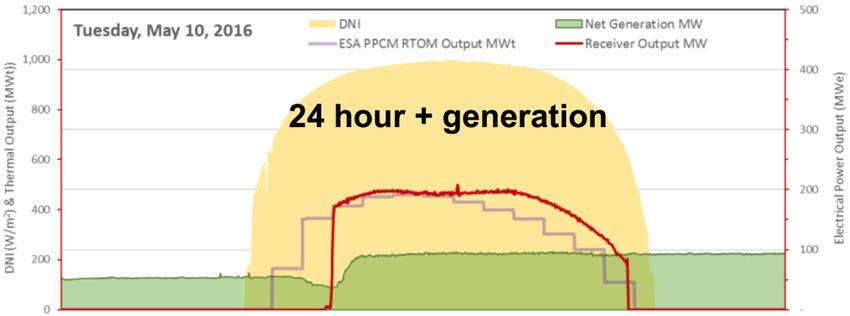
Pedro Teixeira, 8
                                                                                28020 Madrid - España
                                                                                      T. +34 910 105 064
                                                                                   info@cspvalue.com
                                                                                  www.cspvalue.com

 Not surprisingly: the US decided to install the world´s largest solar power plants. The
 simple logic behind is to bring down the specific investment and the O&M costs and
 to take advantage of the economy of scale effect. Both costs are not a linear function
 of the size. After installing several 50MW e parabolic trough power plants in Spain,
 Abengoa decided that 250MW e – with just one single power island - would be the
 correct size for their US projects. The Genesis Solar Energy Project has the same
 accumulated capacity however with two power island of 125MW e each.

 The world largest CSP plant – BrightSource´s Ivanpah project – has an installed
 accumulated net capacity of 377MW e, however, divided into three towers: one tower
 with a 126MW e gross capacity and two towers with 133MW e gross capacity.

 The latest CSP plant in the US has been the 110MW e Crescent Dunes plant from
 Solar Reserve (with the EPC contractor ACS Cobra).

 There have been many rumours and publications related to the (serious)
 performance issues during the ramp up of the large-scale US projects. There might
 be a correlation with the size and the corresponding complexity of the increased size.
 Without a doubt, there are significant challenges and increased material stress
 associated with large CSP plants.

 If you compare the 808 loops of the parabolic trough solar field of Solana with the
 152 loops of Andasol-3 one can imagine that the heat losses of a large solar field are
 higher than of a smaller solar field. Also, the parasitic losses accountable to the main
 HTF pumps to circulate the HTF through the entire solar field are higher. However,
 there is another challenge well known by all parabolic trough solar field operators: in
 order to maximize the thermal output of the solar field, the outlet temperature of each
 loop should be more or less equal (if possible close to the optimum operating
 temperature: actually with the VP-1 HTF at 393ºC). The flow of each loop must be
 regulated individually with (control) valves at each loop depending on its proximity to
 the heat exchangers / power island and depending on the period of the year. This
 process is known as solar field balancing. It is not hard to imagine, that the balancing
 process for 152 loops is much easier than the same process for 808 loops. Any
 change in the valve of one loop has an influence on the remaining 151 or
 respectively 807 loops.

 In terms of solar towers, the material stress on the receiver and the control of large
 heliostat fields increases with the size of the plant. According to Weiss, one of the
 operation problems (at least during the ramp-up phase) have been that approx. 3-5%
 of the heliostat did not focus correctly on the receiver on the top of the tower. This
 leads not only to a reduced performance of the plant but might also be a safety issue:
 complaints arising from glare effects on car drivers or even airplane pilots. But it
 might become even more serious: BrightSource’s Ivanpah plant suffered from a fire

CSPvalue, S.L. CIF B04804712 C/ Sierra de la Contraviesa, 58 04240 Viator – Almería - España           8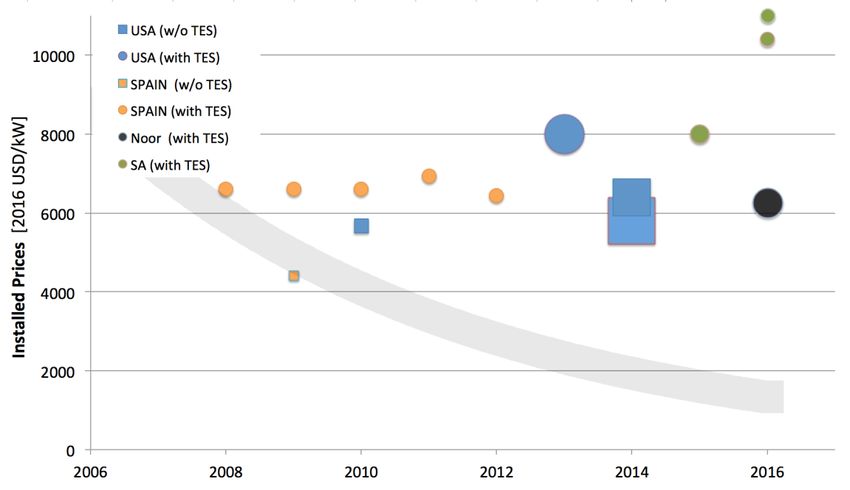
Pedro Teixeira, 8
                                                                                28020 Madrid - España
                                                                                      T. +34 910 105 064
                                                                                   info@cspvalue.com
                                                                                  www.cspvalue.com

 caused by mirrors that did not track the sun properly, which focused sunlight onto the
 wrong part of the tower (Zhang, 2016).

 Taking into consideration the above-described complexity of the 250 - 377MW e
 projects in the US, this report concludes that a size in the range of approx. 150MWe
 would be an optimum size for a CSP power plant for the time being. Such a size is
 still manageable in terms of complexity and material stress and big enough to take
 advantage of economies of scale effects. For this optimum size, there are also “off-
 the-shelf” steam turbines with the same capacity available. If some policy makers
 and/or decision makers opt for larger plants, one could always implement a multiple
 of 150MW e CSP plants.

 The optimum size of the Thermal Energy Storage (TES) system and the
 corresponding optimal solar field size configuration depend very much on the local
 load profile conditions and the PPA / remuneration schemes. However, a CSP plant
 without several full load hours of TES will no longer be accepted by the market.

 4          COSTS

 4.1        Installed Costs

 Projects built in recent years vary greatly in terms of design, configuration, size and
 type of thermal storage used, dispatch profile, support mechanisms, and financing
 conditions. This factor complicate cost analyses and makes comparisons between
 projects difficult (SolarPACES, 2016). Unlike for wind or PV, the simple reference to
 the nominal power of a solar thermal power plant does not provide enough
 information to figure out either the investment cost or the cost of the kWhe produced.
 Due to the greater deployment of PT technology (compared to ST plants), there is a
 broader database of historic and actual cost figures for PT plants than for ST plants.
 The key component in any CSP power plant is the solar field with its corresponding
 receiver (either a line focusing receiver in case of a PT or a point focusing receiver in
 case of an ST).

 On top of those “hardware costs”, the EPC contractor adds contingencies, margins
 and other indirect EPC costs (like engineering costs, financing and bond costs,
 project management costs, etc.). It should be highlighted that today, the indirect
 costs of ST plants are significantly higher than those for trough plants because of
 additional risk premiums and contingencies (IRENA, 2016). Additional infrastructure,
 land, project development, and financing costs have to be considered but are
 normally borne by the Owner of the plant. Table 2 shows a summary of the total
 installed cost categories and their major components for PT and ST plants. The total
 installed costs of the plant are the basis for the LCOE calculation described later in
 chapter 7.

CSPvalue, S.L. CIF B04804712 C/ Sierra de la Contraviesa, 58 04240 Viator – Almería - España           9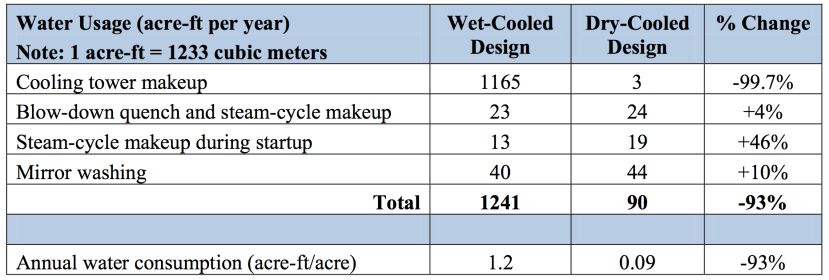
Pedro Teixeira, 8
                                                                                         28020 Madrid - España
                                                                                               T. +34 910 105 064
                                                                                            info@cspvalue.com
                                                                                           www.cspvalue.com

                 Table 2: Total installed cost categories and their major components

 Figure 1 shows the historic development of the installed costs of the “utility-scale”
 CSP projects in the US (blue), Spain (orange), South Africa (green) and Morocco
 (black). The squares represent plants with TES and the circles represent CSP
 projects with TES. The size of the marker symbolizes the installed capacity. There is
 no clear cost degradation visible; however, the different capacity factors3 makes the
 projects hard to compare with each other. The significant price increase in the South
 African projects (green dots) is mainly due to high local financing costs. For
 comparison reason, a price reduction curves for utility-scale PV power plants are also
 included in the same figure (see grey trend line).

     Figure 1: Historic installed costs for CSP projects in the US (blue), Spain (orange), South
               Africa (green) and Morocco (black circle) compared to utility-scale PV (grey line)

 3
   Capacity factor: Ratio of annual energy production to annual energy production if the plant is generating
 continuously at rated power.

CSPvalue, S.L. CIF B04804712 C/ Sierra de la Contraviesa, 58 04240 Viator – Almería - España                   10
Pedro Teixeira, 8
28020 Madrid - España
T. +34 910 105 064
info@cspvalue.com
www.cspvalue.com
Figure 2 shows a large graphical display of the installed costs of CSP plants (PT, ST,
and two Fresnel power plants) with different storage sizes and with different capacity
factors from 2007 to 2014. CSP plants with thermal energy storage have higher
investment costs, but they allow higher capacity factors, dispatchability, and typically
lower LCOEs. Most of the plants with installed costs above 6,000-7,000$/kW e are
Spanish plants (with 4-8 hours of TES), which went online before 2013 and are
financially based on the generous support schemes in the Iberian Peninsula.
Figure 2: Installed costs and capacity factors as a function of the TES size (IRENA, 2016)
All following calculations and cost estimations for 2015 PT and ST plants are based
on the design parameters summarized in Table 3.
Table 3: Design Parameters for 2015 CSP reference plants (DLR, 2016)
PT refer. plant ST refer. plant
DNI [kWh/m2*yr] 2000 / 2550 / 2900
HTF Thermal Oil Molten Salt
Max. HTF temp [ºC] 393ºC 565ºC
TES size [flh] 7,5 9
Inst. Capacity [MWe] 160 150
CSPvalue, S.L. CIF B04804712 C/ Sierra de la Contraviesa, 58 04240 Viator – Almería - España 11Pedro Teixeira, 8
28020 Madrid - España
T. +34 910 105 064
info@cspvalue.com
www.cspvalue.com
The estimated costs for the reference PT plant where an investment decision was
made in 2015 are around 5,550$/kWe and represent the competitive pressures facing
CSP plants in today’s market. For the equivalent ST plants, total installed costs are
slightly higher at around 5,700$/kWe for the reference plant (see Table 3).
Figure 3 shows a breakdown of the installed costs for the PT and ST reference plant
for the year 2015. The biggest single cost figure is – of course – for the solar field;
either for the
parabolic trough
solar field or the
heliostat solar
field.
Approximately
40% of the total
installed costs are
required for the
solar field. The
power block share
(including the
balance of plant)
counts for approx.
22% of the total
installed costs
meanwhile the
TES generated
between 10% and Figure 3: System cost breakdown of CSP reference plants, 2015
15% of the total and 2025
installed costs.
4.2 Operation and Maintenance Costs
A detailed assessment of the O&M costs of the pioneering Californian SEGS plants
that were built between 1982 and 1990 estimated their O&M costs to be 4 $c/kWhe
(Cohen, 1999). One of the largest areas of expenditure was found to be the
replacement of receivers and mirrors as a result of glass breakage. Materials
advances and new designs have helped to reduce the failure rate for receivers, but
mirror breakage is still an important cost component. The cost of mirror washing,
including water costs, is also significant. Plant insurance can also be a large
expense, with its annual cost potentially between 0.5-1% of the initial capital cost.
More recent projects built in Spain, the United States and elsewhere are estimated to
have lower O&M costs than those of the SEGS plants. On the basis of available,
CSPvalue, S.L. CIF B04804712 C/ Sierra de la Contraviesa, 58 04240 Viator – Almería - España 12Pedro Teixeira, 8
28020 Madrid - España
T. +34 910 105 064
info@cspvalue.com
www.cspvalue.com
bottom-up, engineering estimates and recently proposed projects, O&M costs can be
estimated to be in the range of 2 - 3$c/kWhe (including insurance). Mainly due to
operational experience the O&M costs have a potential to reduce costs down to 1.5 –
2$c/kWhe for 2020 - 2025. Since there is little operational experience with ST plants
today, the reduction of the O&M cost is expected to be higher than for PT projects. In
an LCOE calculation, the OPEX share of the total costs (CAPEX + OPEX) is with
approx. 15 - 25% still significant. OPEX share could increase slightly in the future
when CAPEX is reduced.
4.3 Wet cooling versus dry cooling
The majority of solar power plants are located in arid areas where water is an
environmental and socio-economic issue of conflict.
The purpose of an air cooled condenser (ACC) in lieu of a wet cooling tower is to
provide the solar power industry with an alternative to the wet cooled plant when
environmentally preferred or when there is almost no water. Instead of using water to
bring down the temperature of the cooling water, these systems use air passed over
the cooling water by one or more large fans. Running those fans can require a
significant amount of electricity and suffers from fundamental heat-transfer
disadvantages; resulting in a lower net efficiency of the plant.
In order to maintain the same plant performance in a dry cooled CSP plant – the net
installed capacity of the steam turbine generator (STG) might be increased. This
requires additional land for the solar collector field and a power block area but fewer
evaporation ponds, resulting in an increased overall footprint.
The primary advantage of dry cooling is water saving. Table 4 shows an example of
the water consumption of a CSP plant with a wet cooling configuration and a dry
cooling alternative. As a result, the dry cooling option in this example is using 93%
less water than a wet cooling design.
Table 4: Comparison of water consumption for wet-cooled and dry-cooled trough plants
Based on updated information from engineering firms and EPC contractors, it is
estimated that the price per kWhe would increase by 4-5% for a plant with a dry
CSPvalue, S.L. CIF B04804712 C/ Sierra de la Contraviesa, 58 04240 Viator – Almería - España 13Pedro Teixeira, 8
28020 Madrid - España
T. +34 910 105 064
info@cspvalue.com
www.cspvalue.com
cooling design compared to a wet cooling alternative. This would apply for a PT and
ST power with 6-12 hours TES. For a CSP plant without or only with a small TES
system – i.e. a plant that operates only during the day – the delta might increase to 6-
7%.
In order to make dry cooling options more attractive, new innovative concepts might
be applied in the future. One possibility could be the use of a night cool storage.
Temperature variation in deserts is often very high, reaches low temperatures during
the night. This fact can be exploited with the use of a closed cooling system so that
the coolant (water) is chilled during the night and stored. Chilled water is then used
during peak temperature hours to cool the condenser, thus enhancing power output
and efficiency of a dry cooling design (Muñoz, 2012).
It should also be mentioned that hybrid solutions – i.e. a combination of dry and wet
cooling – might also be applied; depending on the amount of water available.
5 COST REDUCTION POTENTIAL / INNOVATION
Most of the cost reduction potential will be caused by technological improvements. A
summary of the cost reduction targets can be found in Table 5. At today´s CSP plant,
the collectors or heliostats are the most expensive component of a CSP plant;
typically 30% - 40% of the plant costs are for the solar field. Therefore it is important
to optimize the collector design, performance, and costs (NREL, 2016).
Table 5: Cost reduction potential with 2025 targets (ESTELA, 2015)
Today 2025
Solar field incl. HTF [€/m2] 160 - 250 100 - 160
Thermal Storage [€/kWhth] 26 - 30 18 - 21
Power Block [€/kWe] 720 - 765 700 - 790
System Efficiency [%] 15 - 17 18 - 20
In the PT solar field, the next generation of collectors will have increased aperture
widths from 7.5m to around 10m. This will not only result in a higher concentration
factor but also as a result, will reduce the number of collectors, and consequently,
fewer drives, sensors, pylon foundations, swivel or ball joints and less cross over
pipes. According to a study from the German engineering company Schlaich
Bergermann & Partner (Schweitzer, 2011), the costs for a solar field could be
approximately reduced by 30% using parabolic trough collectors with an aperture
width of 10m (instead of 7.5m). Another area of improvements is the deployment of
CSPvalue, S.L. CIF B04804712 C/ Sierra de la Contraviesa, 58 04240 Viator – Almería - España 14Pedro Teixeira, 8
28020 Madrid - España
T. +34 910 105 064
info@cspvalue.com
www.cspvalue.com
mirrors with a higher reflectivity and higher cleanliness. (e.g. with the application
of anti-soiling coatings,).
Further important technical improvements are expected from the development of
new heat transfer fluids (HTF). The NREL 2020 Trough Roadmap case was based
on a 250MW molten-salt HTF trough at a field temperature of 500°C. The higher
temperature will improve the power-cycle efficiency and dramatically lower the TES
cost (NREL, 2016). There are other alternative HTF coming into the CSP market; e.g.
the silicon HTF Helisol which can be operated between -40ºC and 425ºC. This new
HTF will not only increases the system efficiency by increasing the temperature but
also significant costs for anti-freezing equipment and reduction operation costs for
anti-freezing during cold winter nights. However, it should also be considered that
Table 6: Drivers for cost reduction of PT and ST power plants
increasing operation
temperature in the solar
field will increase the
thermal losses of the
HTF and will require
more expensive steel
tubes.
For any solar field – but
especially for a heliostat
solar field of an ST power
plant – optical errors,
poor alignment or
focusing and tracking
errors can reduce the
efficiency of the solar
field (NREL, 2016). New
collector designs and
support structures to
improve the stiffness and
optical accuracy in
addition with new
wireless power supply
and control system will
be key drivers to reduce
costs and improve solar
field performance. Highly
automated processes
and machines optimized
for transportation and
CSPvalue, S.L. CIF B04804712 C/ Sierra de la Contraviesa, 58 04240 Viator – Almería - España 15Pedro Teixeira, 8
28020 Madrid - España
T. +34 910 105 064
info@cspvalue.com
www.cspvalue.com
installation of the collectors will bring down the manufacturing, transportation and
construction costs of the solar field.
An improved O&M strategy with a “tariff-optimized” charging and discharging
operation strategy of the TES system, a well-planned preventive maintenance plan, a
perfectly balanced solar field, etc. will optimize efficiency of the plant, increase the
availability of the plant and subsequently the return on investment of the investors.
A list of key drivers to reduce the costs of CSP plant can be found in Table 6.
In both technologies, reduction of the installed costs for the solar field is crucial. As
explained in the case of PT this will be achieved mainly with larger PT collectors and
new HTF mediums. The ST solar costs could be declined with the new support
structure, improved drives and thin front-surface glass mirrors in combination with
anti-soiling coatings to improve reflectivity. Figure 4 shows a cost reduction potential
for the PT solar field of 23% and of 28% for the heliostat solar field until 2025. This
chapter focus only on technological innovations and operational experience; the
influence of financing parameters on the costs of CSP plants is not subject to this
chapter but will be highlighted at the end of chapter 7. Figure 4 to Figure 7 are taken
from the 2016 IRENA report “The Power to Change” which provides a
comprehensive and up-to-date estimate of the cost reduction potential. The following
paragraphs summarize some essential points of the report. The complete report is
available for free download.4
Figure 4: Cost reduction potentials of different solar field components for PT and ST, 2015 –
2025 (IRENA and DLR, 2016)
4
http://www.irena.org/DocumentDownloads/Publications/IRENA_Power_to_Change_2016.pdf
CSPvalue, S.L. CIF B04804712 C/ Sierra de la Contraviesa, 58 04240 Viator – Almería - España 16Pedro Teixeira, 8
28020 Madrid - España
T. +34 910 105 064
info@cspvalue.com
www.cspvalue.com
A huge cost reduction potential is also associated with the cost items under the title
of indirect EPC costs and Owner´s costs. Currently, the tower technology has higher
profit margin expectations (due to perceived technology risk of the EPC contractor)
and contingencies. This is mainly due to the lack of operation experience of ST
plants. The author is expecting that both – profit margin expectations and
contingencies for ST plants – will be reduced significantly based on the experience
from Noor 3, Ivanpah and Crescent Dunes. In the future, engineering, project
development and management costs could also come down; mainly with
standardization of processes. According to Figure 5 indirect EPC and Owner´s costs
could be reduced by 60% or 68% respectively until 2025.
Figure 5: Cost reduction potential for indirect EPC and Owner´s cost until 2025 (IRENA and
DLR, 2016)
TES cost for ST plants is significantly lower than PT plants due to the high operating
temperature of the receiver. The difference in temperature between the “cold” and
the “hot” storage tanks in an ST project is more than double. As a result, the ST
requires less than half of the storage volume for the same amount of thermal energy
compared to a PT plant. With the application of new high-temperature HTF the size
of the TES could be reduced and bring down the costs for the TES by 38% for the
reference PT plant and by 17% for the reference ST plant. Further details are
provided in Figure 7.
CSPvalue, S.L. CIF B04804712 C/ Sierra de la Contraviesa, 58 04240 Viator – Almería - España 17Pedro Teixeira, 8
28020 Madrid - España
T. +34 910 105 064
info@cspvalue.com
www.cspvalue.com
Figure 6: Cost reduction potential for TES, 2015-2025 (IRENA and DLR, 2016)
By applying the above described cost reduction drivers, the costs of a PT plant could
be reduced by 33% (to approx. 3,700$/kW e for the 160MW e plant with 7,5flh TES)
and the costs of a ST plant by 37% (to approx. 3,600 $/kW e for the 150MW plant with
9flh TES). ST power plants have a potential for a higher cost reduction, which is
typical for early technology developments. The overall cost reduction potential is
displayed in Figure 8. The author expects that the innovations assumed for this cost
reduction potential might be achieved on a short- to mid-term perspective; many of
them even before 2025.
Figure 7: Total installed costs reduction potential for PT and ST, 2015-2025 (IRENA and DLR,
2016)
CSPvalue, S.L. CIF B04804712 C/ Sierra de la Contraviesa, 58 04240 Viator – Almería - España 18Pedro Teixeira, 8
28020 Madrid - España
T. +34 910 105 064
info@cspvalue.com
www.cspvalue.com
In addition to the above-described innovations, other new concepts might arise in the
long-term perspective allowing further reduction of the power generation costs for
CSP plants. Among those new concepts might be the development of high-
temperature receivers (e.g. a particle and liquid-metal receivers) in order to enable
higher-efficiency power cycles, such as supercritical carbon dioxide (sCO2) closed
Brayton cycles.
6 PERFORMANCE AND RELIABILITY
In order to analyze the performance of the new generation of CSP plants, a separate
analysis for PT and for ST power plants is required. PT power plants are based on a
mature technology and with a reasonable scale-up factor. However, each CSP plant
is different and it is always a new challenge. The best example is the Solana power
plant. After having built 13 CSP plants in Spain, it could have been expected that the
CSP world leader Abengoa would have had enough experience to construct and
ramp-up the 250MW e Solana project in the US without any major problems.
However, the EPC contractor decided to install different HTF-Salt heat exchangers;
which delayed the ramp-up process from October 2013 until today. In general the
commissioning and ramp-up phase to 365 days base case, production takes in many
CSP plants longer than expected (approx. 2-3 years). This should be considered by
EPC contractors during the bid preparation and contract negotiation phase in order to
avoid expensive performance penalties.
It should be mentioned that the performance of most of the commercial projects is
confidential information and thus can´t be shared in this report. As an exception, the
performance of the CSP plants in the US is publically available on the website of the
US Energy Information Administration 5 (EIA) and will be deeply analysed in the
following paragraphs. Figure 8 shows the real production data of the five US CSP
plants.
5
http://www.eia.gov/
CSPvalue, S.L. CIF B04804712 C/ Sierra de la Contraviesa, 58 04240 Viator – Almería - España 19Pedro Teixeira, 8
28020 Madrid - España
T. +34 910 105 064
info@cspvalue.com
www.cspvalue.com
Figure 8: Real production data of the five new utility-scale US CSP plants
Figure 9 displays the real performance data of the US projects compared with the
expected target values, in order to visualize the ramp-up time process. The two
250MWe PT plants Genesis (brown line) and Mojave (green line) show a relatively
“steep” ramp-up curve. In the case of the Genesis plant, the ramp-up period to
achieve 100% of the base case production targets on a continuous basis was only
one year. To the contrary, the Solana plant (light green line) is struggling to achieve
the base case annual production targets over the last three years. Furthermore,
Figure 9 shows the performance of the two important ST power plants: Ivanpah (blue
curve) and Tonopah/Crescent Dunes (dark brown curves). The ST technologies are
only just getting operational experience and for BrightSource (Ivanpah) and
SolarReserve (Crescent Dunes) it has been the first “utility-scale” CSP project for
their respective technology.
CSPvalue, S.L. CIF B04804712 C/ Sierra de la Contraviesa, 58 04240 Viator – Almería - España 20Pedro Teixeira, 8
28020 Madrid - España
T. +34 910 105 064
info@cspvalue.com
www.cspvalue.com
Figure 9: Real production of the new five utility-scale US CSP plants compared to target
production
Ivanpah failed to meet guaranteed production minimums for the PG&E-contracted
units in the plant’s first two years of operation, 2014 and 2015. The first production
year (2014) was dismal and the plant only produced 63% of the PG&E production
targets. Ivanpah´s year 2 (2015) performance improved significantly compared to the
first year and the plant achieved 96% of the PG&E production targets. On August 9,
2016 “NRG Energy confirms that Units 1 and 3 met their production requirements
under the forbearance agreements.” Figure 10 clearly shows the performance
improvements of the Ivanpah project. “In the first couple of months, it was taking us
about three to four hours to start-up, and now on a normal sunny day from the time
that the sun comes up over the
horizon to the time that we actually
synchronize the unit is in the 25
minute range,” said an NRG
engineering expert. BrightSource
is confident that the plant can ramp
up to full production by 2018 as
originally planned.
The latest ST project, which went
online, is Solar Reserve’s Crescent
Dunes project. This plant is using a
molten salt receiver with a 10
Figure 10: Performance Improvements of the Ivanpah
hours TES system. After a
project (Source FERC, EIA)
relatively long construction period
CSPvalue, S.L. CIF B04804712 C/ Sierra de la Contraviesa, 58 04240 Viator – Almería - España 21Pedro Teixeira, 8
28020 Madrid - España
T. +34 910 105 064
info@cspvalue.com
www.cspvalue.com
of approximately four years the plant achieved full load electricity generation of
110MW e in autumn 2015. According to SolarReserve, the project passed the
necessary tests to reach full commercial operation under the PPA in November 2015.
The project is still in the early phase of the ramp-up process and it is too early to
make any final conclusions. The individual system tests have been passed, and
according to the EPC contractor the performance test for Provisional Acceptance of
the plant are expected to be passed soon. On sunny days, the plant is capable of
producing 24 hours electricity with the 10 hours molten salt storage system; as
shown in Figure 11. However, the red curve (receiver output) demonstrates one
typical problem. It takes up to several hours (after sunrise) until the receiver starts
producing the first MWh of thermal energy in the morning. The same might apply for
the turbine in order to achieve the required steam conditions. The optimization of the
daily start-up process (which typically takes years) is often underestimated by the
performance models (such as SAM).
Figure 11: Sunny day at Crescent Dunes with 24 h production (Source: SolarReserve 2016)
SolarRerserve says that the PPA does require the project seasonal output/availability
to be fully ramped up until January 2017. By looking at the green curve in Figure 8,
this seems to be an ambitious objective for the project. In case that the information
about some non-optimized engineering solutions implemented in the Crescent Dunes
plant are correct, the achievement of the annual performance goals could be a major
challenge. However, many CSP plants – also in Spain – suffered more from a longer
ramp-up period than it was expected, but are performing above 100% of the original
base case production target today. In many cases, it is a question of the contractual
penalty schemes. If the performance penalties are very high, the EPC contractor will
do all the necessary effort to fulfill the contractual performance goals; if not the EPC
contractor may pay the penalties and neglect the performance. This could be a
determining factor for the future performance of the Crescent Dunes plant.
Unfortunately, the same transparency in terms of performance does not exist for the
CSP power plants in South Africa and Morocco than for the US plant. As an
exception, the National Energy Regulator South Africa (NERSA) publishes on a
CSPvalue, S.L. CIF B04804712 C/ Sierra de la Contraviesa, 58 04240 Viator – Almería - España 22Pedro Teixeira, 8
28020 Madrid - España
T. +34 910 105 064
info@cspvalue.com
www.cspvalue.com
quarterly basis a report on “Monitoring of renewable energy performance”. Figure 12
shows a typical day (19.9.2015) of operation of the KaXu Solar One plant. The
NERSA report from April 2016, states: “On that day 314MWh (24% of the daily
energy) of the total daily energy produced of 1 310MWh was dispatched to the grid
from the thermal storage facility of the CSP plant during the evening. This
demonstrates that CS P technology combined with thermal storage is able to serve
load during peak hours.”
Figure 12: Energy production of Kaxu Solar One on 19.9.2015 [Source: NERSA, 2016]
The same report also shows a comparison of the achieved Commercial Operation
Dates (CODs) with the scheduled CODs; as shown in Table 7. There is nearly no or
little deviation between the achieved COD and the scheduled one, which gives at
least a first indication that the construction of these plants has been executed
according to planning.
Table 7: Comparison of achieved COD to scheduled COD as per PPA for KaXu, Khi and
Bokpoort [Source: NERSA 2016]
CSPvalue, S.L. CIF B04804712 C/ Sierra de la Contraviesa, 58 04240 Viator – Almería - España 23Pedro Teixeira, 8
28020 Madrid - España
T. +34 910 105 064
info@cspvalue.com
www.cspvalue.com
In general, the risk exposure for the PT projects of Bokpoort (South Africa), KaXu
Solar One (South Africa) and Noor 1 (Morocco) is significantly lower compared to the
US projects, for several reasons:
1.) Morocco and South Africa CSP projects have higher remunerated PPAs
2.) Bokpoort (50MW e), KaXu (100MW e) and Noor 1 (160 MW e) reflect a more
reliable evolution of the capacity size (compared to the quantum jump of the
US projects)
3.) All of these three projects are based on the mature PT technology and have
not implemented any unproven components (as far as the author declare)
4.) These projects have been erected by experienced EPC contractors who have
built similar projects before.
Since Noor1, Bokpoort, and KaXu have just been in operation for few months, it
might be too early to give final statements if they achieve the target production.
However, first indications are showing a good ramp-up evolution and all indications
are a hint to the good performance of those plants.
In May 2016 CSP Today6 informed that the Bokpoort plant hits supply record: “The
newly inaugurated 50 MWe plant produced electricity for 161 straight hours within the
first month of its commercial operation”.
As a result, the conclusion is that the PT technology is a mature and proven
technology which complies under normal conditions with the estimated performance
and ramp-up time. Moreover, chances for successful implementations could be
higher if experienced EPC contractors are involved and the PPA tariffs allow the
purchase and use of proven, quality key components. So far there was one negative
exceptional case for PT power plants, which did not match the expected ramp-up
time or the expected performance: the 250MW e PT Solana plant in the US. However,
the main problem of the Solana projects has been identified and should not be
repeated in the future.
The summary for ST plants is different. Mainly based on the initial performance
results of the Ivanpah and the Crescent Dunes plants, the ST technology can not be
considered sufficiently mature yet 7 . Serious performance problems have been
reported so far and ramp-up is taking longer than expected. Nevertheless,
performance improvements in the Ivanpah project in year 2 are noticeable. There are
realistic chances that the utility-size ST projects will achieve the target production but
this is still to be proven. The new ST projects - Khi Solar One, Noor 3 and Ashalim as
6
http://social.csptoday.com/intelligence-brief/bokpoort-csp-hits-supply-record-abengoa-cut-10-jobs-spain
7
the non-utility size ST projects PS-10, PS-20 and Gemasol are not considered in this conclusion
CSPvalue, S.L. CIF B04804712 C/ Sierra de la Contraviesa, 58 04240 Viator – Almería - España 24Pedro Teixeira, 8
28020 Madrid - España
T. +34 910 105 064
info@cspvalue.com
www.cspvalue.com
well as the nine ST projects recently shortlisted by the Chinese government – have
now the chance to prove the outstanding commercial readiness of the ST technology.
7 LEVELIZED COSTS OF ELECTRICITY
The performance and cost of CSP plants vary by technology, configuration, solar
resource, and financing parameters. A typical methodology used for evaluating
different plant designs and technologies within a single index is to derive the
levelized cost of electricity (LCOE). The LCOE takes into account the available solar
resource, upfront capital investment, plant capacity factor, operation and
maintenance (O&M) costs, and financing parameters.
Many reports and studies analysed the possibility of what a realistic target value for
the LCOE could be, by applying all or some of the previous described innovations
and cost reduction potential. The forecast of the US Department of Energy’s SunShot
Initiative – initially published in 2012 and updated in 2016 (Mehos, 2016) – was one
of the well-known studies but also one of the most aggressive forecast. The SunShot
report concluded an LCOE target of 6$c/kWhe by 2020. This goal is not only
assuming the impact of technological development on the cost of components but
also on reductions in other costs, such as permitting, EPC and financing.
Other recent studies – such as the joint study from SolarPaces, Greenpeace and
ESTELA “Solar Thermal Electricity. Global Outlook 2016” (SolarPACES, 2016), the
KIC InnoEnergy report “Future renewable energy costs solar-thermal electricity” and
the IRENA 2016 study (developed with the support of DLR) give a less aggressive
forecast.
Figure 13 shows a more
conservative cost reduction
scenario for a 100MWe CSP
plant with a 4flh TES in Spain
with a DNI of 2050kWh/m2*yr.
According to the KIC
InnoEnergy, the LCOE of a PT
could be reduced by approx.
29% and for an ST by 27% due
to (technology) innovations.
The 2016 Global Outlook for
Solar Thermal Electricity
Figure 13: LCEO reduction potential by innovation for a (SolarPACES, 2016) – which
location in Spain (Source: KIC InnoEnergy, was jointly published by the
2014)
CSPvalue, S.L. CIF B04804712 C/ Sierra de la Contraviesa, 58 04240 Viator – Almería - España 25Pedro Teixeira, 8
28020 Madrid - España
T. +34 910 105 064
info@cspvalue.com
www.cspvalue.com
European Solar Thermal Electricity Association (ESTELA), Greenpeace International
and SolarPACES – highlights on the fact that large differences exist in the per kWhe
prices paid to CSP projects around the globe. Some of the parameters that influence
the costs per kWh are DNI, the size of the plant, PPA or FiT duration, escalation,
grants, financing conditions, requested return on investments. Taking into account
the expected trends for cost reduction, prices per kWhe are expecting a decline as
shown in Figure 14. The green lines represent the cost reduction curve for a plant
location with a DNI of 2600kWh/m2*yr while the red lines correspond to a location
with a DNI of 2200 kWh/m2*yr. ESTELA emphasizes on the fact that the targeted
cost reduction trend can only be achieved if an accumulated capacity of 30 GW e is
installed by 2025.
Figure 14: Required value for a 25-year PPA without escalation for a 150MW five-hour thermal
storage (green line:DNI = 2600kWh/m2*yr., red line: DNI =2200kWh/m2*yr.) (SolarPACES, 2016)
The following figures show the LCOE reduction potential by implementing the
different improvements and cost reduction assumptions as described in the IRENA
2016 report and summarized before chapter 5 of this report. Figure 15 and Figure 16
show that the LCOE for PT plants can be reduced by 37% until 2025 and for ST
plant by 43%.
CSPvalue, S.L. CIF B04804712 C/ Sierra de la Contraviesa, 58 04240 Viator – Almería - España 26Pedro Teixeira, 8
28020 Madrid - España
T. +34 910 105 064
info@cspvalue.com
www.cspvalue.com
Figure 15: LCOE reduction potential for PT (IRENA and DLR, 2016)
Figure 16: LCOE reduction potential for ST (IRENA and DLR, 2016)
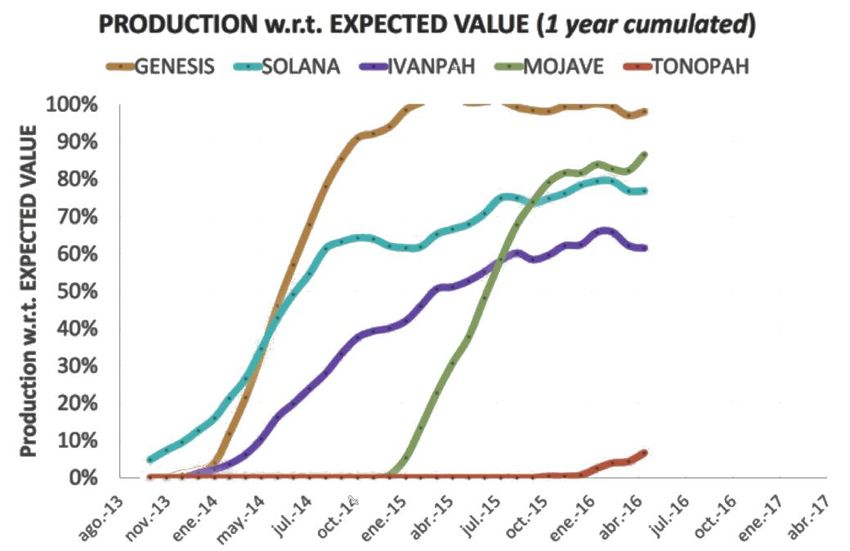
The different studies analysed in this report come to slightly different forecasts for
different locations and different financing assumptions. Figure 18 concentrates the
different scenarios in one graphical display, which is according to the author a
realistic and updated LCOE forecast. The graph shows a bandwidth for the LCOE for
PT and ST power plants today and in future for plant locations with DNI values
between 2000kWh/m2*yr (upper values of the spongy orange and blue circles) and
2900 kWh/m2*yr.(lower part). The same figure also displays the PPA price for Noor 2
and Noor 3 and for the last bidding window in South Africa as well the recently
announces feed-in tariff (FIT) in China.
CSPvalue, S.L. CIF B04804712 C/ Sierra de la Contraviesa, 58 04240 Viator – Almería - España 27Pedro Teixeira, 8
28020 Madrid - España
T. +34 910 105 064
info@cspvalue.com
www.cspvalue.com
Figure 17: LCOE bandwidth for DNI values between 2000 - 2900 kWh/m2*yr. for PT and ST
Plants today and in future compared to actual PPA and FiT
It should be highlighted that the PPA prices for Noor 2 and Noor 3 are below or in the
lower part of the LCOE bandwidth displayed in Figure 15 while the PPA prices in
South Africa are above the LCOE bandwidth. The reason can be found in the
different financing conditions. While the Noor project in Morocco benefited from the
“soft loan” support by the World Bank, the South African solar projects have been
“punished” by expensive financing parameters (with interest rates in the range of 12
– 15%). The LCOE and the PPA prices are very sensitive to the cost of capital.
Figure 18 displays this sensitivity for the different weighted average cost of capital
(WACC) value. WACC is a calculation of the cost of capital in which each category of
capital (mainly equity and debt) is proportionately weighted. Assuming a theoretical
case with zero cost of capital, the LCOE of CSP plant would be today approx. 8
$c/kWhe for either a PT or an ST plant and is expected to be in the range between 4-
5 $c/kWhe in 2025. These cost figures are pure technology costs and the difference
to the real PPA prices is market base rates, margins, and risk mark-ups. These
theoretical figures compared with the winning bid in a recent Dubai tender at 2.99
$c/kWhe for a PV plant tender with extremely favourable financing conditions in
Dubai allows a conclusion that CSP in future might be competitive; especially when
taking into consideration the value of the technology in combination with TES system.
CSPvalue, S.L. CIF B04804712 C/ Sierra de la Contraviesa, 58 04240 Viator – Almería - España 28Pedro Teixeira, 8
28020 Madrid - España
T. +34 910 105 064
info@cspvalue.com
www.cspvalue.com
Figure 18: Sensitivity of the LCOE to variations in the WACC (IRENA, 2016)
CSPvalue, S.L. CIF B04804712 C/ Sierra de la Contraviesa, 58 04240 Viator – Almería - España 29Pedro Teixeira, 8
28020 Madrid - España
T. +34 910 105 064
info@cspvalue.com
www.cspvalue.com
8 REFERENCES
Bolinger, Mark, and Seel, Joachim: “Utility-Scale Solar 2014. An Empirical
Analysis of Project Cost, Performance, and Pricing Trends in the United
States”, September 2015
CSP Alliance Report: “The Economics and Reliability Benefits of CSP with
Energy Storage”, September 2014
CSP Today: “Bokpoort CSP hits supply record; Abengoa to cut up to 10% of
jobs in Spain”, May 2016
Department of Energy (South Africa): “ State of Renewable Energy in South
Africa”, September 2015 (www.energy.gov.za)
DLR (German Aerospace Centre). “Assessment of the Cost Reduction
Potential for Concentrating Solar Power until 2025”, 2016
ESTELA, Protermosolar, DCSP: “Understanding the costs of solar thermal
electricity plants”, 2015
IRENA: “The Power to Change: Solar and Wind Cost Reduction Potential to
2025”, June 2016
KIC InnoEnergy “Future renewable energy costs solar-thermal electricity”,
2014.
Kramer, Susan: “CPUC Gets It Right: PG&E keep its Ivanpah contract”,
18.5.2016 (http://clenatechnica.com)
Mark Mehos, et all: “On the Path to SunShot: Advancing Concentrating
Solar Power Technology, Performance, and Dispatchability”, May 2016
Muñoz, Anton et all: “Dry cooling with night cool storage to enhance solar
power plants performance in extreme conditions areas”, 2012
NERSA: “Monitoring of renewable energy performance. Progress update for
first quarter 2016”, April 2016.
SolarReserve: “Crescent Dunes solar energy project: Next generation of
solar energy storage becomes a reality. Project update”, July 2016
SolarPACES, Greenpeace, ESTELA: “ Solar Thermal Electricity. Global
Outlook 2016”, 2016
CSPvalue, S.L. CIF B04804712 C/ Sierra de la Contraviesa, 58 04240 Viator – Almería - España 30Pedro Teixeira, 8
28020 Madrid - España
T. +34 910 105 064
info@cspvalue.com
www.cspvalue.com
Schweitzer, Axel, et all: “ULTIMATE TROUGH ® – the next generation
collector for parabolic trough power plants”
Turchi, C.:”Parabolic Trough Reference Plant for Cost Modeling with the
Solar Advisor Model (SAM)”, 2010
Weiss, Harald: “Groß-Solarkraftwerk mit Kinderkrankheiten”, VDI
Nachrichten 18. Juli 2014
Zhang, Sarah: “A Huge Solar Plant Caught on Fire, and That’s the Least of
Its Problems”, Wired.com (23.5.2016)
CSPvalue, S.L. CIF B04804712 C/ Sierra de la Contraviesa, 58 04240 Viator – Almería - España 31You can also read