Investing to Deliver Growth in Durable Franchises - 36th Annual J.P. Morgan Healthcare Conference Jan. 10, 2018 - Bausch ...
←
→
Page content transcription
If your browser does not render page correctly, please read the page content below

Investing to Deliver Growth in Durable Franchises
36th Annual J.P. Morgan Healthcare Conference

Jan. 10, 2018

Forward-Looking Statements
    This presentation contains forward-looking information and statements,             which risks and uncertainties are incorporated herein by reference. In
    within the meaning of applicable securities laws (collectively, “forward -         addition, certain material factors and assumptions have been applied in
    looking statements”), including, but not limited to, statements regarding          making these forward-looking statements, including that the risks and
    Valeant's future prospects and performance, the expected annualized                uncertainties outlined above will not cause actual results or events to differ
    revenues of selected products, the timing and number of expected product           materially from those described in these forward-looking statements, and
    launches and the anticipated revenues from new and recent product                  additional information regarding certain of these material factors and
    launches, the anticipated submission, approval and launch dates for certain        assumptions may also be found in the Company’s filings described above.
    of our pipeline products and R&D programs, the anticipated timing of               The Company believes that the material factors and assumptions reflected
    receipt of clinical and pre-clinical results or data for certain of our pipeline   in these forward-looking statements are reasonable, but readers are
    products and R&D programs, the anticipated timing of the loss of exclusivity       cautioned not to place undue reliance on any of these forward-looking
    of certain of our products and the expected impact of such loss of                 statements. These forward-looking statements speak only as of the date
    exclusivity on our financial condition, and the Company’s plans and                hereof. Valeant undertakes no obligation to update any of these forward -
    commitments. Forward-looking statements may generally be identified by             looking statements to reflect events or circumstances after the date of this
    the use of the words "anticipates," "expects," "intends," "plans," "should,"       presentation or to reflect actual outcomes, unless required by law.
    "could," "would," "may," "will," "believes," "estimates," "potential," "target,"
    or "continue" and variations or similar expressions. These forward-looking
    statements are based upon the current expectations and beliefs of
    management and are provided for the purpose of providing additional
    information about such expectations and beliefs and readers are cautioned
    that these statements may not be appropriate for other purposes. These
    forward-looking statements are subject to certain risks and uncertainties
    that could cause actual results and events to differ materially from those
    described in these forward-looking statements. These risks and
    uncertainties include, but are not limited to, the risks and uncertainties
    discussed in the Company's most recent annual and quarterly reports and
    detailed from time to time in the Company's other filings with the Securities
    and Exchange Commission and the Canadian Securities Administrators,

1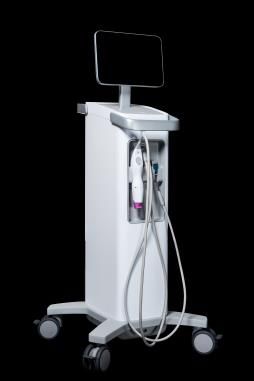
Non-GAAP Information
    Recent Assessment of Financial Performance Measures

    Recently, the Company’s management team undertook an evaluation of            appropriate to better reflect the underlying business. For example,
    how it would measure the financial performance of the Company going           commencing with the first quarter of 2017, Adjusted EBITDA (non-GAAP)
    forward. In evaluating its financial performance measures, the Company        no longer includes adjustments for Foreign exchange gain/loss arising from
    considered its recent changes to its strategy (which included a transition    intercompany transactions.
    away from growth by acquisition with a greater focus on R&D activity,
    strengthening of the balance sheet through the paydown of debt and            The Company began to use these new non-GAAP measures, and the new
    rationalization of the product portfolio through divestitures of non -core    methodologies used to calculate these non-GAAP measures, commencing
    assets) and sought to identify performance measures that best reflect the     with the first quarter of 2017. For the purposes of the Company’s actual
    Company’s current business operations, strategy and goals. As a result of     results for the first nine months and third quarter of 2016 and other historic
    that evaluation, new management identified the following primary financial    periods presented, the Company has calculated and presented the non -
    performance measures for the Company: GAAP Revenues (measure for              GAAP measures using the historic methodologies in place as of the
    both guidance and actual results), GAAP Net Income (measure for actual        applicable historic dates; however, the Company has also provided a
    results), Adjusted EBITDA (non-GAAP) (measure for both guidance and           reconciliation that calculates the non-GAAP measures using the new
    actual results) and GAAP Cash Flow from Operations (measure for actual        methodologies, to allow investors and readers to evaluate the non-GAAP
    results). These measures were selected as the Company believes that           measures (such as Adjusted EBITDA) on the same basis for the periods
    these measures most appropriately reflect how the Company measures the        presented.
    business internally and sets operational goals and incentives. For example,
    the Company believes that Adjusted EBITDA (non-GAAP) focuses
    management on the Company’s underlying operational results and
    business performance, while GAAP Revenue focuses management on the
    overall growth of the business.

    In addition, in connection with this evaluation of financial performance
    measures, the Company assessed the methodology with which it was
    calculating non-GAAP measures and made updates where it deemed

2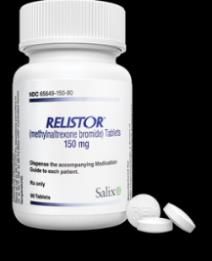
Non-GAAP Information
    Use of Non-GAAP Generally

    To supplement the financial measures prepared in accordance with U.S.              the GAAP equivalent for certain costs, such as amortization, that would
    generally accepted accounting principles (GAAP), the Company uses certain          otherwise be treated as a non-GAAP adjustment to calculate projected GAAP
    non-GAAP financial measures including (i) Adjusted EBITDA, (ii) Adjusted           net income (loss). However, because other deductions (e.g., restructuring,
    EBITA, (iii) Adjusted EBITA Margin, (iv) Adjusted Operating Income, (v)            gain or loss on extinguishment of debt and litigation and other matters) used
    Adjusted Gross Profit, (vi) Adjusted Gross Margin, (vii) Adjusted Selling A&P,     to calculate projected net income (loss) may vary significantly based on actual
    (viii) Adjusted G&A, (ix) Adjusted SG&A, (x) Adjusted R&D, (xi) Total Adjusted     events, the Company is not able to forecast on a GAAP basis with reasonable
    Operating Expense, (xii) Adjusted Net Income, (xiii) Organic Growth and (xiv)      certainty all deductions needed in order to provide a GAAP calculation of
    Organic Change. These measures do not have any standardized meaning                projected net income (loss) at this time. The amounts of these deductions
    under GAAP and other companies may use similarly titled non-GAAP financial         may be material and, therefore, could result in GAAP net income (loss) being
    measures that are calculated differently from the way we calculate such            materially different from (including materially less than) projected Adjusted
    measures. Accordingly, our non-GAAP financial measures may not be                  EBITDA (non-GAAP).
    comparable to similar non-GAAP measures. We caution investors not to place
    undue reliance on such non-GAAP measures, but instead to consider them             Management uses these non-GAAP measures as key metrics in the
    with the most directly comparable GAAP measures. Non-GAAP financial                evaluation of Company performance and the consolidated financial results
    measures have limitations as analytical tools and should not be considered in      and, in part, in the determination of cash bonuses for its executive officers.
    isolation. They should be considered as a supplement to, not a substitute for,     The Company believes these non-GAAP measures are useful to investors in
    or superior to, the corresponding measures calculated in accordance with           their assessment of our operating performance and the valuation of our
    GAAP.                                                                              Company. In addition, these non-GAAP measures address questions the
                                                                                       Company routinely receives from analysts and investors and, in order to
    The reconciliations of these historic non-GAAP measures to the most directly       assure that all investors have access to similar data, the Company has
    comparable financial measures calculated and presented in accordance with          determined that it is appropriate to make this data available to all investors.
    GAAP are shown in the appendix hereto. However, for guidance purposes,             However, non-GAAP financial measures are not prepared in accordance with
    the Company does not provide reconciliations of projected Adjusted EBITDA          GAAP, as they exclude certain items as described herein. Therefore, the
    (non-GAAP) to projected GAAP net income (loss), due to the inherent                information is not necessarily comparable to other companies and should be
    difficulty in forecasting and quantifying certain amounts that are necessary for   considered as a supplement to, not a substitute for, or superior to, the
    such reconciliations. In periods where significant acquisitions or divestitures    corresponding measures calculated in accordance with GAAP.
    are not expected, the Company believes it might have a basis for forecasting

3
Tangible Progress Toward Transformation
O U R M I S S I O N :
Improve people’s lives with our health care products.
STABILIZE TURNAROUND TRANSFORM
2016 2017-2018 2018+
Resolving legacy issues and de-risking the balance sheet
Investing in core franchises with attractive growth
Launching new products with meaningful opportunities
“We have built a world-class organization, and we are well positioned to grow as we
continue to transform Valeant.” – Joseph C. Papa, Chairman and CEO
4Progress Through 2017 Delivered on Commitments Focused on Core Business • As of Dec. 31, 2017, reduced total debt by more than • In 3Q17, ~77% of Valeant's total revenue is generated $6.5 billion since the end of 1Q16 from the Bausch + Lomb/International segment and the • Completed 13 sales including skin care brands (CeraVe®, Salix business AcneFree™ and AMBI ®), Dendreon Pharmaceuticals, • Bausch + Lomb/International segment (~57% of iNova Pharmaceuticals, Obagi Medical Products and Valeant’s revenue in 3Q17) generated organic Sprout Pharmaceuticals revenue growth 1,2 in the single digits during each of • Eliminated all long-term debt maturities until 2020 and all the first three quarters of 2017 mandatory amortization requirements • Salix (~20% of Valeant’s revenue in 3Q17) generated • From Sept. 30, 2016 to Sept. 30, 2017, reduced working organic revenue growth 1,2 of 16% and 6% during the capital days by approximately 45 days and inventory days second and third quarter of 2017, respectively on hand by more than 30 days • Generated $1,712 million in cash flow from operations for • Achieved dismissals and other positive outcomes in the nine months ending Sept. 30, 2017 approximately 70 litigations and investigations relating to • Recent New Product Milestones: historical matters during 2017 • Launched VYZULTA™ • Agreed to preliminary settlement to resolve the Allergan • Launched SILIQ™ shareholder securities litigation, subject to court approval (Valeant to pay
Diversified Portfolio with a Significant International Presence

                 Total Revenue Breakdown1                                               Global Footprint1

                                               Global
                          All Other           Consumer
                             20%                18%
                                                                                 International
                                                            Global                    40%
                                                          Vision Care
            Ortho Dermatologics                               9%
                    7%
                                                                Global
                                                               Surgical
                                                                                                      U.S.
                                                                 7%                                   60%
                      Salix
                                                       Global
                      17%
                                                      Ophtho Rx
                                                         7%
                                      International
                                           15%

 Purples: Reported within the Bausch + Lomb/International segment

 Greens: Reported within the BrandedRx segment

 6                                                1. YTD revenue as of 9.30.17
Bausch + Lomb/International
Key Products3
Global Footprint Provides Access to
Global Global Global Global
Fast-Growing International Markets3 Consumer
International
Vision Care Surgical Ophtho Rx
31% 27% 16% 13% 13%
International
72%
PreserVision® Thermage® SofLens® Stellaris Elite™ LOTEMAX® Gel
renu® Multi-Purpose JUBLIA® PROLENSA®
ULTRA® Stellaris® Cataract
U.S. Solutions and Retina
Tiazac® XC ALREX®
28% BioTrue®Multi-
BioTrue® ONEday Consumables
Besivance®
Purpose Solution Artelac® PureVision® enVista® IOL
VYZULTA™
LUMIFY™ Bedoyecta® Akreos® IOL
Global Vision Care organic revenue Bausch + Lomb/International Organic Growth (Y/Y)
growth 1,2 of 8% Y/Y in 3Q17 8%
6% 6% 6%
6%
Expanded presence of B+L on Amazon with
4%
69% growth Y/Y in 3Q17 2%
2%
0%
Launched VYZULTA™ in the U.S. and 0%
received CE Mark in Europe for Stellaris -2% 1Q16 2Q16 3Q16 4Q16 1Q17 2Q17 3Q17
Elite™
-4% -3%
-4%
-6%
1. Organic growth, a non-GAAP metric, is defined as an increase on a year-over-year
basis in revenues on a constant currency basis (if applicable) excluding the impact
7 of divestitures and discontinuations.
2. See Slides 2 and 3 and Appendix for further non-GAAP information.
3. YTD revenue as of 9.30.17Consumer and Vision Care 1
Bausch + Lomb U.S. Market Share – Soft Contact Lenses3
Consistent Growth 9.2% 9.0%
9.0% 8.8% 8.8% 8.8%
8.7%
• #1 vision care brand in China with 8.8%
8.6% 8.4%
five-year CAGR (2011–2016) of 8.4% 8.2% 8.2%
20% 8.1%
8.2% 8.0%
8.0%
7.8%
7.6%
• #1 item in the vitamin aisle across 7.4%
U.S. sales 2,5 Jan-17 Feb-17 Mar-17 Apr-17 May-17 Jun-17 Jul-17 Aug-17 Sep-17 Oct-17
Top U.S. Consumer Health Care Companies4
• Launched AQUALOX ® contact 5.10%
lenses in Japanese market
2.50%
0.40% 0.40%
• #1 multi-purpose solution in the -0.60%
-1.20%
-1.70% -1.80%
U.S. 2 -2.80%
-2.90% -3.30%
-3.90%
• LUMIFY™ (formerly known as -7.00%
Luminesse) approved by the
FDA on Dec. 22, 2017 and
launching in 2Q18 -10.90%
Peer Peer Peer Peer Peer Peer Peer Health & Peer Peer Peer Peer Peer Peer
Beauty
Category
* Graphic is representative of U.S. Consumer sales only and demonstrates Valeant’s continued growth in U.S. Consumer revenues retail sales.
1. Reported within the B+ L/International segment.
2. Data Source: IRI: Total U.S. MULO 52WE 11-26-17
8 3.
4.
Source: GfK sales through November 2017
Source: IRI Market Advantage – Total US MULO – B+L as of 3Q17
5. Based on Universal Product CodesVYZULTA™ - FDA Approved
and Now Launching U.S. Prostaglandin Market (TRx Data)
Prostaglandin analog with dual mechanism of action Xalatan, 0% All Other, 1%
that reduces intraocular pressure (IOP) in patients
with open-angle glaucoma or ocular hypertension
Travatan Z,
One Molecule, Two Pathways 13%
Proven IOP reduction
Demonstrated safety profile
Lumigan, 15%
Glaucoma Market Opportunity1 Latanoprost,
71%
Global glaucoma market represents ~$6 billion
Market is expected to grow at a CAGR of 15% over
the next four-year period, eventually accounting for
more than $11 billion in revenue by the end of 2020
North America market: ~$2.3 billion in annual sales IMS Smart TRx 12 months total TRx thru 11/2017
despite the dominance of generic latanoprost units /
TRXs
9
1. Source: The Glaucoma Drugs Market: Opportunities, Challenges, Strategies & Forecasts, SNS Research; Market Intelligence &
Consultancy Solutions, 2016.Salix1
XIFAXAN® Weekly TRx Growth >15% Since Primary
XIFAXAN® Highlights Care Team Added
Added Primary
• Investing in the future of this durable asset by 15
Care Team
studying new indications and new formulations
Initiated clinical trial in 4Q17
Thousands
14
• Duration of market exclusivity supported by a
solid patent estate and a challenging regulatory
pathway for the sole generic filer Labor Day
13
Holiday Week
We believe the second potential generic
competitor discontinued its clinical program July 4th Thanksgiving
Holiday Week Holiday Week
12
• PCPs show strong growth with +19% NRx growth Jan-17 Mar-17 May-17 Jul-17 Sep-17 Nov-17
(Nov. ’17 vs. Nov. ’16) and +15% TRx growth
YTD Growth in RELISTOR® Franchise2
6
Other Promoted Brands ~40%
• Growth across a number of brands, including: Thousands
RELISTOR® (~40% YTD TRx growth)
4
APRISO® (~8% YTD TRx growth)
• FDA accepted NDA for PLENVU ®, a bowel cleanser
used in preparation for colonoscopies 2
(PDUFA: Feb. 13, 2018) Jan-17 Mar-17 May-17 Jul-17 Sep-17 Nov-17
RELISTOR Franchise TRx
1. Reported within Branded Rx segment.
10 2. Source: Symphony HealthNew Products will Drive the
Turnaround in Dermatology
Launch
Large and Growing Market
• SILIQ™ initial launch in the U.S. demonstrates strength Opportunity in the U.S.2,3,4
of strategy and execution 7.5M Psoriasis Sufferers in the U.S.
• Early market access better than expected, continuing
to expand and gain additional coverage Mild - Moderate Psoriasis Moderate - Severe Psoriasis
• 2-year data on SILIQ™ released in Oct. 2017 (1-3, mild, 3-10% mod BSA) (>10% BSA)
demonstrated durable results with a PASI 100 of 59%
5.6M people mild- 1.9M people mod-
• 94% of patients started on SILIQ™ have stayed on mod severe
therapy, according to Specialty Pharmacy data
3.7M diagnosed 1.4M treated
PDUFA Date June 18, 2018 2.4M treated 12% treated
with Rx with a Biologic
• FDA accepted NDA for DUOBRII™ 1 (IDP-118), an
investigational topical treatment for plaque psoriasis 1.6M 170k
topical biologic
If approved, will be the first and only topical patients patients
combination lotion for adult patients containing a high
potency steroid with a retinoid for a synergistic effect
During Phase 2, more than 52% of patients
150,000 to 260,000 new cases of psoriasis are
achieved treatment success diagnosed each year
During Phase 3, there was achievement of a
“clear” to “almost clear” score
1. Provisional name
2. Rachakonda TD et al. J Am Acad Dermatol. 2014 Mar. Psoriasis prevalence among
11 adults in the United States https://www.ncbi.nlm.nih.gov/pubmed/24388724
3. Cowen. Therapeutic Outlook Dermatology. March 2016
4. IMS Claims Data. April 2015- March 2016, Iqvia. Data on fileDermatology Catalysts
Increase Dermatology Sales Force and Reallocate Towards Psoriasis
(>25% increase in sales force)
Submitted ALTRENO™1 (IDP-121) for • Additional Key Pipeline Candidates:
acne to the FDA IDP-120: Phase 2 (acne)
Submitted JEMDEL™1 (IDP-122) for IDP-123: Phase 3 (acne)
psoriasis to the FDA
IDP-124: Phase 3 (atopic dermatitis)
RETIN-A MICRO® 06 launching in Jan. IDP-126: Phase 2 (acne)
2018
FDA accepted NDA for DUOBRII™ 1
(IDP-118) - PDUFA date June 18, 2018
SILIQ™ ramped up launch with
increased sales force underway
“Based on the strength of our product pipeline over the next five
years, we believe Ortho Dermatologics can double in size.”
– Joseph C. Papa, Chairman and CEO
12
1. Provisional nameImproved Working Capital Efficiency is Contributing to
Debt Reduction
(in millions)
$719 Generated $1,712
($432) million in cash flow
from operations for the
nine months ending Sept.
($150) 30, 2017. In the third
quarter, generated cash
$1,712 flow from operations of
$1,575 $490 million
From Sept. 30, 2016 to
Sept. 30, 2017, reduced
working capital days by
Operating Cash Net Change in Salix Litigation Relative Change in Operating Cash
Operating Payments Working Capital
~45 days and inventory
Flow Flow
(Jan. 1, 2016 – Sept. 30, 2016) Activities (Jan. 1, 2017 – Sept. 30, 2017) days on hand by >30
days
13Reduced Debt and Extended Maturities
Long-Term Debt Maturity Profile as of Dec. 31, 2017 1,2
2024
2018 2019 2020 2021 2022 2023 Total
and beyond
Debt Maturities $0 $0 $2,690M $3,175M $5,321M $6,051M $8,512M $25,749M
Mandatory
$0 $0 $0 $0 $0 $0 $0 $0
Amortization
Total $0 $0 $2,690M $3,175M $5,321M $6,051M $8,512M $25,749M
Reduced Debt and Extended Maturities1
Eliminated all long-term debt Mar. 31, 2016 Dec. 31, 2017
2
maturities until 2020 and all $35
mandatory amortization requirements Cumulative debt repayment schedule $30
$25
As of Dec. 31, 2017, reduced total
(in billions)
debt by more than $6.5 billion since $20
the end of 1Q16 $15
$10
As of Dec. 31, 2017, ~85% of debt is
fixed rate debt, which provides $5
protection against rising rates $-
2016 2017 2018 2019 2020 2021 2022 2023 2024 2025 &
1. Debt values are shown at principal value. Beyond
2. Reflects the paydown of $923M in term loans from the sale of iNova; issuance of $1B of 5.500% senior
secured notes and repurchase of $1B of unsecured notes maturing in 2020; the paydown of $181M in
term loans from the sale of Obagi; issuance of $750M of add-on senior secured notes to repay $750M of
14 senior secured term loans; the paydown of $175M of Revolver using cash on hand; issuance of $1.5B
senior unsecured notes and repurchase of $1.5B of unsecured notes maturing in 2020; and the
paydown of $425M of senior secured term loans, using cash on hand.Delivering on Commitment to Simplify Operating
Model and Reduce Debt
Divestiture Date Closed Divestiture Date Closed
Sprout Dec. 20, 2017 Euvipharm (Vietnam) Jan. 25, 2017
Obagi Nov. 9, 2017 Ruconest Dec. 7, 2016
iNova Sept. 29, 2017
Paragon Nov. 9, 2016 ~$3.8B
Dendreon June 28, 2017 in total asset sales
Brodalumab EU Rights June 30, 2016 announced since
Armoxindo (Indonesia) May 17, 2017
beginning of 2016 1
Delta (Brazil) April 20, 2017 Synergetics OEM April 1, 2016
Skin Care Brands
(CeraVe®, AcneFree ™ March 3, 2017 Cosmederme (Canada) Jan. 22, 2016
and AMBI ®)
15
1. Includes future expected milestones.Making Progress in Innovation
enVista® Trifocal (Intraocular Lens) Submit IDE – H1 2018
New Material (Ophthalmic Viscosurgical Device); Initiated IDE
Study – 4Q17
Loteprednol Gel 0.38% (Ocular Inflammation) Submit NDA –
H1 2018
LATE PHASE IDP-120 (Acne) Initiate Phase 3 – H1 2018
IDP-123 (Psoriasis) Initiated Phase 3 – H2 2017
New XIFAXAN® formulation (new indication) Initiated Study –
4Q17
IDP-126 (Acne Combination) Initiated Phase 2 – H2 2017 Thermage FLX™
Bausch + Lomb ULTRA® contact lenses extended wear
Indication – PMA submitted Oct. 2017
DUOBRII™1 (IDP-118 Psoriasis) – 3Q17, PDUFA June 18, 2018
SUBMISSIONS ALTRENO™1 (IDP-121 Acne Lotion) – NDA submitted Oct. 2017
JEMDEL™1 (IDP-122 Psoriasis) – NDA submitted Dec. 2017
PLENVU®1 (NER1006) – H1, PDUFA Feb. 13, 2018
Stellaris Elite™ next generation surgical platform – H1 2017
Bausch + Lomb ULTRA® for Astigmatism contact lenses and
Biotrue® ONEday for Astigmatism daily disposables – H1 2017
SILIQ™ – 3Q17
Stellaris Elite™
Vitesse™ vitreous cutter – 4Q17
LAUNCHES Thermage™ FLX System – 4Q17
VYZULTA™ – Dec. 2017
LUMIFY™ – 2Q18
Completed or on Target
16
1. Provisional nameSignificant Seven
New Product Approvals Will Drive Long-Term Growth1
+$1BCatalysts: 2018 and Beyond
Bausch + Lomb Ortho Dermatologics Salix
VYZULTA™ Launch (now) Psoriasis / SILIQ™ sales force PLENVU®1 - PDUFA date Feb.
expansion 13, 2018
Stellaris Elite™ Launch (now)
FDA approvals expected XIFAXAN ® Next Generation
LUMIFY™ (formerly Clinical Trial
Luminesse) Launch (2Q18) • DUOBRII™1 (IDP-118) -
PDUFA date June 18, 2018 • New Formulations
SiHy Daily Launch (4Q18)
• ALTRENO™1 (IDP-121) • New Indications
Crystalsert® 2.6 Injector 510(k)
Approval (1H18) • JEMDEL™1 (IDP-122)
ULTRA® Toric / Multi-Focal
Launch (1Q19)
Consumer E-commerce
Growth (Amazon and Alibaba)
Corporate / Other
Preliminary resolution of Allergan class-action lawsuit
Additional debt repayments
OraPharma co-promotion of SPRIX ®
18
1. Provisional nameFinancials that follow were all previously disclosed in 3Q17 results on Nov. 7, 2017
Bausch + Lomb/International Segment – Key Products

 Global Consumer
 Product                  Description
                          A brand of eye vitamins for those diagnosed with moderate-to-advanced age-related
 PreserVision®
                          macular degeneration
 renu® Multi-Purpose
                          Multi-Purpose solutions that clean and disinfect soft contact lenses
 Solutions
 BioTrue® Multi-Purpose
                          Multi-Purpose solution that cleans and disinfects soft contact lenses
 Solution
                          First and only OTC eye drop developed with low-dose brimonidine tartrate for treatment of
 LUMIFY™
                          eye redness

 International
 Product                  Description
 Thermage®                Designated for use on different parts of the body to help with skin smoothing
 JUBLIA®                  Topical solution used to treat fungal infections of the toenails
 Tiazac® XC               Used for the treatment of hypertension
 Artelac®                 Product for providing strong long-lasting relief for dry eyes
 Bedoyecta®               A brand of vitamin B complex products

20
Bausch + Lomb/International Segment – Key Products
Global Vision Care
Product Description
SofLens® Daily disposable contact lenses
BioTrue® ONEday Daily disposable contact lenses
Bausch + Lomb ULTRA® Monthly disposable contact lenses
PureVision® Monthly disposable contact lenses
Global Surgical
Product Description
Stellaris Elite™ Next-generation phacoemulsification and vitrectomy platform
Stellaris® Cataract and
Stellaris disposable packs and accessories for cataract surgery and retina surgery
Retina Consumables
enVista® IOL Hydrophobic intraocular lens for placement during cataract surgery
Akreos® IOL Hydrophilic intraocular lens for placement during cataract surgery
21Bausch + Lomb/International Segment – Key Products
Global Ophtho Rx
Product Description
LOTEMAX® Gel Indicated for treatment of inflammation and pain following eye surgery
A nonsteroidal anti-inflammatory agent indicated to treat inflammation and reduce eye pain
PROLENSA®
in patients after cataract surgery
Eye drops indicated for temporary relief of the signs and symptoms of seasonal allergic
ALREX®
conjunctivitis
First and only topical ophthalmic flouroquinolone. Eye drops indicated for bacterial
Besivance®
conjunctivitis (pink eye)
First prostaglandin analog, with one of its metabolites being nitric oxide (NO), indicated for
VYZULTA™ the reduction of intraocular pressure (IOP) in patients with open-angle glaucoma or ocular
hypertension
22Branded Rx Segment – Key Products
Salix
Product Description
Tablets used to treat traveler’s diarrhea, irritable bowel syndrome with diarrhea (IBS-D) and
XIFAXAN®
for the reduction in risk of overt hepatic encephalopathy (HE) recurrence
RELISTOR® Tablets or injections to treat constipation caused by opioids
APRISO® Extended-release capsules indicated for the maintenance of remission of ulcerative colitis
Prescription corticosteroid in extended-release tablet form to help control active, mild-to-
UCERIS®
moderate ulcerative colitis
Ortho Dermatologics
Product Description
ELIDEL® Topical cream for the treatment of atopic dermatitis, also known as eczema
JUBLIA® Topical solution used to treat fungal infections of the toenails
RETIN-A Micro® Topical treatment of acne vulgaris
ONEXTON® Topical treatment of acne vulgaris
SILIQ™ Injection for the treatment of moderate-to-severe plaque psoriasis
23Branded Rx Segment – Key Products
Dentistry
Product Description
Concentrated, locally applied antibiotic that remains active for an extended period of time
ARESTIN®
for the reduction of pocket depth
A prescription rinse that helps perform important functions of saliva when suffering from
NeutraSal®
oral mucositis and/or hyposalivation (Dry Mouth) stemming from systemic disorders
24U.S. Diversified Products Segment – Key Products
Neuro & Other
Product Description
Extended-release tablet used to treat adults with a certain type of depression called major
WELLBUTRIN®
depressive disorder, and for the prevention of autumn-winter seasonal depression
XENAZINE® US Tablet used to treat the involuntary movements (chorea) of Huntington’s disease
Treatment for Wilson's disease (too much copper in the body), cystinuria (excess amount
CUPRIMINE® of certain proteins in the urine) and for patients with severe rheumatoid arthritis who have
not responded to other therapies
Used for treating Wilson's disease in patients who cannot take the medication known as
SYPRINE®
penicillamine
Generics
Product Description
Metformin Hydrochloride Extended-release tablet used in the management of type 2 diabetes
Tobramycin/ Treatment for bacterial infections of the eye
Dexamethasone
Bexarotene Used to treat the skin problems that happen with a type of cancer called cutaneous T-cell
lymphona, or CTCL
25U.S. Diversified Products Segment – Key Products
Solta
Product Description
Thermage® Designated for use on different parts of the body to help with skin smoothing
Non-invasive laser therapy providing a wide array of treatment options to address many
Fraxel®
forms of aging
Laser skin care treatment, clinically proven to help fight and prevent the effects of aging
Clear + Brilliant®
skin
26Key Product LOE / Divestiture 2017 Impact – Forecast
Business Product Line with Actual or LOE/Divested Rev/Profit LOE/Divested Rev/Profit Current vs Prior Estimate
Unit Anticipated LOE/Divestiture Date1 Prior Estimate (August) Current Estimate Favorable/(Unfavorable)
Revenue Profit Revenue Profit Revenue Profit
• Lotemax® LOE 1Q18 (anticipated)
Optho Rx $103M $100M $111M $106M +$8M +$6M
• Istalol® LOE 4Q17
• Divestitures Euvipharma and
Armoxindo 1Q17
• Zegerid® LOE early 2Q17
Int’l $24M $22M $35M $28M +$11M +$6M
• Glumetza® LOE 1Q17
• Wellbutrin® XL add’t Gx Sept ‘16
• Sublinox® add’t Gx Jan 2017
BAUSCH + LOMB / INTERNATIONAL $127M $122M $146M $134M +$19M +$12M
• Ruconest® Divested Dec. 2016
Salix $20M $19M $20M $19M $- $-
• Zegerid® add’t US Gx 2017
BRAND Rx $20M $19M $20M $19M $- $-
• Nitropress® LOE Dec 2016
• Ammonul® LOE 1Q16
• Edecrin® LOE 3Q16
• Bupap® LOE 1Q17
Neuro & • Xenazine® Gx and brand
$336M $296M $353M $310M +$17M +$14M
Other competition 2Q17
• Virazole® LOE Dec 2016
• Mephyton LOE 1Q18 (anticipated)
• Syprine LOE 1Q18 (anticipated)
• Isuprel® LOE 3Q17 (approved)
Generics • Zegerid® LOE April 2016 $5M $4M $5M $4M $- $-
DIVERSIFIED $341M $300M $358M $314M +$17M +$14M
OVERALL COMPANY $488M $441M $524M $467M +$36M +$26M
1. Anticipated date of loss of exclusivity or divestiture is based on the Company’s
current best estimate and actual date of LOE or divestiture, as the case may
27 be, may occur earlier or later. Changes from prior forecast are noted in red.Key Product LOE / Divestiture 2017 Impact – Y/Y
Business Product Line with Actual or LOE/Divested Rev/Profit LOE/Divested Rev/Profit Change
Unit Anticipated LOE/Divestiture Date1 2016A 2017E 2017E vs 2016A
Revenue Profit Revenue Profit Revenue Profit
• Lotemax® LOE 1Q18 (anticipated)
Optho Rx $129M $124M $111M $106M ($18M) ($18M)
• Istalol® LOE 4Q17
• Divestitures Euvipharma and
Armoxindo 1Q17
• Zegerid® LOE early 2Q17
Int’l $44M $32M $35M $28M ($9M) ($4M)
• Glumetza® LOE 1Q17
• Wellbutrin® XL add’t Gx Sept ‘16
• Sublinox® add’t Gx Jan 2017
BAUSCH + LOMB / INTERNATIONAL $173M $156M $146M $134M ($27M) ($22M)
• Ruconest® Divested Dec. 2016
Salix $78M $64M $20M $19M ($58M) ($45M)
• Zegerid® add’t US Gx 2017
BRAND Rx $78M $64M $20M $19M ($58M) ($45M)
• Nitropress® LOE Dec 2016
• Ammonul® LOE 1Q16
• Edecrin® LOE 3Q16
• Bupap® LOE 1Q17
Neuro & • Xenazine® Gx and brand
$694M $629M $353M $310M ($341M) ($319M)
Other competition 2Q17
• Virazole® LOE Dec 2016
• Mephyton LOE 1Q18 (anticipated)
• Syprine LOE 1Q18 (anticipated)
• Isuprel® LOE 3Q17 (approved)
Generics • Zegerid® LOE April 2016 $98M $93M $5M $4M ($93M) ($89M)
DIVERSIFIED $792M $722M $358M $314M ($434M) ($408M)
OVERALL COMPANY $1,043M $942M $524M $467M ($519M) ($475M)
1. Anticipated date of loss of exclusivity or divestiture is based on the Company’s
current best estimate and actual date of LOE or divestiture, as the case may
28 be, may occur earlier or later. Changes from prior forecast are noted in red.Divestitures Included in 2017 Financials 1
Divestiture Date Closed Revenue EBITDA
Obagi Nov. 9, 2017 ~$60M ~$20M
iNova Sept. 29, 2017 ~$195M ~$100M
Dendreon June 28, 2017 ~$165M ~$65M
Skincare Brands
(CeraVe, AcneFree and March 3, 2017
~$35M ~$15M
AMBI)
Other2 Various ~$5M ~$0M
TOTAL 1 ~$460M ~$200M
1. Excludes Sprout, which closed on December 20, 2017.
2. Primarily Delta (Brazil).
293Q17 Other Financial Information1
Three Months Ended Favorable (Unfavorable)
Sept. 30, 2017 Sept. 30, 2016 Reported Constant Currency3
Cash Interest Expense $424M $437M 3% 3%
Net Interest Expense1,2 $456M $435M (5%) (5%)
Non-cash adjustments
Depreciation1,2 $42M $43M 2% 2%
Non-cash share-based Comp1,2 $19M $37M 49% 49%
Additional cash items
Contingent Consideration /
$15M $107M
Milestones
Restructuring and Other $22M $20M
Capital Expenditures $43M $53M
Tax rate on Adj. EBT
15.5% 15.1%
& Other Revenue
1. See Slides 2 and 3 and this Appendix for further non-GAAP information.
2. Presentation reflects non-GAAP adjustments included in the three months ended Sept. 30, 2016. The
30 adjustments recorded for interest expense, depreciation, and non-cash share-based compensation were
$32M, $0M and $0M, respectively. These non-GAAP adjustments are no longer recorded in 2017.
3. See this Appendix for further information on the use and calculation of constant currency.Other Financial Information1 for Nine Months ended
Sept. 30, 2017
Nine Months Ended Favorable (Unfavorable)
Sept. 30, 2017 Sept. 30, 2016 Reported Constant Currency3
Cash Interest Expense $1,292M $1,280M (1%) (1%)
Net Interest Expense1,2 $1,383M $1,274M (9%) (8%)
Non-cash adjustments
Depreciation1,2 $124M $128M 3% 1%
Non-cash share-based Comp1,2 $70M $111M 37% 37%
Additional cash items
Contingent Consideration /
$183M $169M
Milestones
Restructuring and Other $72M $102M
Capital Expenditures $118M $181M
Tax rate on Adj. EBT
15.5% 15.1%
& Other Revenue
1. See Slides 2 and 3 and this Appendix for further non-GAAP information.
2. Presentation reflects non-GAAP adjustments included in the nine months ended Sept. 30, 2016. The
31 adjustments recorded for interest expense, depreciation, and non-cash share-based compensation were
$89M, $15M and $23M, respectively. These non-GAAP adjustments are no longer recorded in 2017.
3. See this Appendix for further information on the use and calculation of constant currency.Non-GAAP Adjustments EPS Impact (Quarter-to-Date)
Quarter Ended Quarter Ended
September 30, 2017 September 30, 2016
Income Earnings Per Income Earnings Per
$ in millions, except per share impact (Expense) Share Impact (Expense) Share Impact
Net Income GAAP $ 1,301 $ 3.69 $ (1,218) $ (3.49)
Acquisition-related adjustments excluding amortization of intangible assets (238) (0.68) 11 0.03
In-process research and development costs 0 0.00 31 0.09
Other (including Gain on Divestures) (311) (0.87) 24 0.07
Loss on Extinguishment of debt 1 0.00 - -
Restructuring and integration costs 6 0.02 20 0.06
Goodwill impairment 312 0.89 1,049 2.99
Asset Impairments 406 1.15 148 0.42
Amortization of finite-lived intangible assets 657 1.86 664 1.89
Amortization of deferred financing costs and debt discounts - - 32 0.09
Tax effect of non-GAAP adjustments (1,767) (5.02) (218) (0.62)
EPS difference between basic and diluted shares - - - 0.01
Adjusted Net Income (Non- GAAP) (a) $ 367 $ 543
Depreciation resulting from a PP&E step-up from acquisition - - - -
Previously accelerated vesting of certain share-based equity adjustments - - - -
Foreign exchange loss/gain on intercompany transactions - - (1) (0.00)
Amortization of deferred financing costs and debt discounts - - (32) (0.09)
Adjusted Net Income (Non- GAAP) [revised basis](b) $ 367 $ 510
(a) This subtotal reflects the Adjusted Net income(loss) (non-GAAP) reported by the Company for the periods ended Sept. 30, 2017 and 2016 using the methodology for calculating Adjusted Net
Income(loss) (non-GAAP) as of that date.
(b) As of the third quarter of 2016, Adjusted net income(loss) (non-GAAP) no longer includes adjustments for the following items: Depreciation resulting from a PP&E step-up resulting from
acquisitions and Previously accelerated vesting of certain share-based equity adjustments. Depreciation resulting from a PP&E step-up resulting from acquisitions was a component of
Acquisition-related adjustments excluding amortization of intangible assets. Previously accelerated vesting of certain share-based equity adjustments was a component of Other non-GAAP
charges. As of the first quarter of 2017, Adjusted net income(loss) (non-GAAP) also no longer includes adjustments for Foreign exchange loss/gain on intercompany transactions and Amortization
of deferred financing costs and debt discounts. For the purpose of allowing investors to evaluate Adjusted net income(loss) (non-GAAP) on the same basis for the periods presented, these
adjustments have been removed from the results for the third quarter of 2016.
32Non-GAAP Adjustments EPS Impact (Year-to-Date)
Year to Date Ended Year to Date Ended
September 30, 2017 September 30, 2016
Income Earnings Per Income Earnings Per
$ in millions, except per share impact (Expense) Share Impact (Expense) Share Impact
Net Income GAAP $ 1,891 $ 5.38 $ (1,894) $ (5.47)
Acquisition-related adjustments excluding amortization of intangible assets (297) (0.85) 64 0.18
In-process research and development costs 5 0.01 34 0.10
Other (including Gain on Divestures) (547) (1.56) 94 0.27
Loss on Extinguishment of debt 65 0.18 - -
Restructuring and integration costs 42 0.12 78 0.22
Goodwill impairment 312 0.89 1,049 3.00
Asset Impairments 629 1.79 394 1.12
Amortization of finite-lived intangible assets 1,915 5.45 2,015 5.76
Amortization of deferred financing costs and debt discounts - - 89 0.25
Tax effect of non-GAAP adjustments (3,013) (8.57) (450) (1.29)
EPS difference between basic and diluted shares 0.06
Adjusted Net Income (Non- GAAP) (a) $ 1,002 $ 1,473
Depreciation resulting from a PP&E step-up from acquisition - - (8) (0.02)
Previously accelerated vesting of certain share-based equity adjustments - - (23) (0.07)
Foreign exchange loss/gain on intercompany transactions - - 14 0.04
Amortization of deferred financing costs and debt discounts - - (89) (0.25)
Adjusted Net Income (Non- GAAP) [revised basis](b) $ 1,002 $ 1,367
(a) This subtotal reflects the Adjusted Net income(loss) (non-GAAP) reported by the Company for the period ended Sept. 30, 2017 and 2016 using the methodology for calculating Adjusted Net Income(loss) (non-GAAP) as of
that date.
(b) As of the third quarter of 2016, Adjusted net income(loss) (non-GAAP) no longer includes adjustments for the following items: Depreciation resulting from a PP&E step-up resulting from acquisitions and Previously
accelerated vesting of certain share-based equity adjustments. Depreciation resulting from a PP&E step-up resulting from acquisitions was a component of Acquisition-related adjustments excluding amortization of intangible
assets. Previously accelerated vesting of certain share-based equity adjustments was a component of Other non-GAAP charges. As of the first quarter of 2017, Adjusted net income(loss) (non-GAAP) also no longer includes
adjustments for Foreign exchange loss/gain on intercompany transactions and Amortization of deferred financing costs and debt discounts. For the purpose of allowing investors to evaluate Adjusted net income(loss) (non-
GAAP) on the same basis for the periods presented, these adjustments have been removed from the results for the third quarter of 2016.
333Q17 Top 10 Products – B+L / International
Top 10 products by revenues, trailing five quarters
Rank Product 3Q17 2Q17 1Q17 4Q16 3Q16
1 SofLens® $83M $76M $69M $79M $79M
2 Ocuvite® + PreserVision® $73M $71M $58M $70M $66M
3 renu® $57M $55M $51M $55M $60M
4 PureVision® $37M $31M $31M $37M $35M
Biotrue® MultiPurpose
5 $34M $36M $31M $32M $33M
Solution
6 LOTEMAX® $32M $37M $30M $38M $40M
7 BioTrue® ONEday $30M $31M $25M $23M $30M
8 Artelac® $21M $23M $22M $23M $22M
9 Bausch +Lomb ULTRA® $21M $19M $14M $11M $21M
10 Anterior Disposables $21M $23M $21M $22M $20M
343Q17 Top 10 Products – Branded Rx
Top 10 products by revenues, trailing five quarters
Rank Product 3Q17 2Q17 1Q17 4Q16 3Q16
1 XIFAXAN® $286M $233M $185M $251M $273M
2 GLUMETZA® $46M $37M $23M $24M $24M
3 APRISO® $42M $39M $29M $39M $38M
4 UCERIS®1 $37M $37M $29M $45M $41M
5 RETIN-A® Franchise $27M $24M $31M $32M $32M
6 ARESTIN® $26M $28M $24M $37M $28M
7 ELIDEL® $21M $18M $21M $23M $26M
8 JUBLIA® $19M $18M $21M $21M $39M
9 RELISTOR®2 $17M $16M $13M $15M $22M
10 SOLODYN® $14M $13M $32M $29M $26M
1. There are two UCERIS products within the Salix Reporting unit that were previously
being treated as separate products. These products are now being aggregated, and the
revenue numbers now reflect this change.
2. There are two RELISTOR products within the Salix Reporting unit that were previously
35 being treated as separate products. These products are now being aggregated, and the
revenue numbers now reflect this change. When aggregated, RELISTOR is now one of
the top 10 products in Branded Rx.3Q17 Top 10 Products – U.S. Diversified Products
Top 10 products by revenues, trailing five quarters
Rank Product 3Q17 2Q17 1Q17 4Q16 3Q16
1 WELLBUTRIN® $61M $58M $49M $67M $65M
2 XENAZINE® US $28M $32M $29M $33M $35M
3 ISUPREL® $23M $33M $38M $42M $30M
4 CUPRIMINE® $20M $20M $20M $22M $29M
5 SYPRINE® $18M $27M $20M $20M $26M
6 MEPHYTON® $14M $9M $17M $11M $15M
7 MIGRANAL® AG $14M $15M $12M $14M $15M
8 ATIVAN® $13M $16M $17M $7M $13M
9 GLUMETZA® $9M $8M $11M $0M $0M
10 Obagi Nu-Derm® $8M $9M $7M $8M $8M
36Bausch + Lomb / Int’l Segment Trailing Five Quarters1
Bausch + Lomb /
3Q17 2Q17 1Q17 4Q16 3Q16
International
Global Vision Care Revenue $208M $187M $170M $178M $198M
Global Surgical Revenue4 $161M $175M $154M $177M $155M
Global Consumer Revenue $392M $379M $375M $397M $401M
Global Ophtho Rx Revenue $149M $167M $143M $159M $162M
International Revenue4 $344M $333M $308M $349M $327M
Segment Revenue $1,254M $1,241M $1,150M $1,260M $1,243M
Segment Adjusted Gross
61% 62% 61% 62% 61%
Margin (non-GAAP)2,3
Segment Adjusted R&D
$14M $21M $21M $22M $23M
(non-GAAP)2
Segment Adjusted SG&A
$358M $370M $349M $348M $355M
(non-GAAP)2,3
Segment Adjusted
Operating Income $387M $377M $333M $412M $383M
(non-GAAP)2,3
1. Products with sales outside the United States impacted by F/X changes. Please note
rounding impact on percentages.
2. See Slides 2 and 3 and this Appendix for further non-GAAP information.
3. The non-GAAP measures for historic periods are calculated using the former methodologies
used as of that date. See this Appendix for a presentation of the non-GAAP measures on
the same basis for all periods presented and further information on the changes to the
methodologies.
4. As of the third quarter of 2017, one product has been removed from the Global Surgical
business unit and added to the International business unit. This change has been made as
management believes that the product better aligns with the International business unit. For
the purposes of allowing investors to evaluate the results of these two business units on the
37 same basis for all periods presented, this change also has been made for the results of each
of the historic quarters presented (2Q 2017, 1Q 2017, 4Q 2016 and 3Q 2016).Branded Rx Segment Trailing Five Quarters1
Brand Rx 3Q17 2Q17 1Q17 4Q16 3Q16
Salix Revenue $452M $387M $302M $414M $437M
Dermatology Revenue $148M $130M $192M $214M $223M
Dendreon Revenue $0M $83M $81M $77M $77M
Dentistry Revenue $32M $35M $28M $39M $29M
All Other Revenue $1M $1M $1M $1M $0M
Segment Revenue $633M $636M $604M $745M $766M
Segment Adjusted Gross
84% 83% 84% 84% 85%
Margin (non-GAAP) 2,3
Segment Adjusted R&D
$16M $15M $14M $18M $20M
(non-GAAP)2
Segment Adjusted SG&A
$160M $170M $167M $169M $147M
(non-GAAP) 2,3
Segment Adjusted
Operating Income $357M $341M $326M $438M $486M
(non-GAAP) 2,3
1. Products with sales outside the United States impacted by F/X changes. Please note rounding
impact on percentages.
2. See Slides 2 and 3 and this Appendix for further non-GAAP information.
3. The non-GAAP measures for historic periods are calculated using the former methodologies
38 used as of that date. See this Appendix for a presentation of the non-GAAP measures on the
same basis for all periods presented and further information on the changes to the
methodologies.U.S. Diversified Products Segment Trailing Five Quarters1
Diversified Products 3Q17 2Q17 1Q17 4Q16 3Q16
Neuro & Other Revenue $227M $248M $243M $276M $321M
Generics Revenue $82M $82M $85M $93M $120M
Solta Revenue $7M $9M $8M $9M $8M
Obagi Revenue $16M $16M $17M $17M $17M
Other Revenue $0M $1M $2M $3M $4M
Segment Revenue $332M $356M $355M $398M $470M
Segment Adjusted Gross
81% 83% 85% 83% 88%
Margin (non-GAAP)2,3
Segment Adjusted R&D
$1M $1M $2M $1M $2M
(non-GAAP)2
Segment Adjusted SG&A
$30M $36M $37M $33M $31M
(non-GAAP)2,3
Segment Adjusted
Operating Income $239M $255M $264M $296M $379M
(non-GAAP)2,3
1. Products with sales outside the United States impacted by F/X changes. Please note
rounding impact on percentages.
2. See Slides 2 and 3 and this Appendix for further non-GAAP information.
3. The non-GAAP measures for historic periods are calculated using the former methodologies
used as of that date. See this Appendix for a presentation of the non-GAAP measures on the
39 same basis for all periods presented and further information on the changes to the
methodologies.Selected U.S. Businesses Pipeline Inventory Trending
(Quarter-to-Date)
Months on Hand
Relative Change Sept.
As of As of Change As of As of Change
Business Units Change 30, 2017 vs
June 30, 2016 Sept 30, 2016 3Q16 June 30, 2017 Sept 30, 2017 3Q17
3Q17 vs 3Q16 Sept. 30, 2016
Derm 1.52 1.70 0.18 1.33 1.38 0.05 (0.13) (0.32)
Neuro 1.69 1.49 (0.20) 1.57 1.53 (0.04) 0.16 0.04
Ophtho 1.44 1.49 0.05 1.37 1.19 (0.18) (0.23) (0.30)
GI 1.31 1.47 0.16 1.32 1.37 0.05 (0.11) (0.10)
40Selected U.S. Businesses Pipeline Inventory Trending
(Year-to-Date)
Months on Hand
Change Sept.
Relative
As of As of Change As of As of Change 30, 2017 vs
Business Units Change
Dec. 31, 2015 Sept 30, 2016 YTD16 Dec. 31, 2016 Sept 30, 2017 YTD17 Sept. 30,
17 vs 16
2016
Derm 0.99 1.70 0.71 1.34 1.38 0.04 (0.67) (0.32)
Neuro 1.51 1.49 (0.02) 1.59 1.53 (0.06) (0.04) 0.04
Ophtho 1.32 1.49 0.17 1.44 1.19 (0.25) (0.42) (0.30)
GI 1.80 1.47 (0.33) 1.57 1.37 (0.20) 0.13 (0.10)
41Financial Summary – Adjusted (non-GAAP)
Presentation Reconciliation
YTD 2017
Operating
Total Gross Total Gross Selling, A&P R&D Operating Income
Profit Margin Expense G&A Expense Expense Expense (EBITA)
YTD 2017 GAAP $ 4,660 71% $ 1,421 $ 522 $ 271 $ 2,214 $ 424
Acquisition-related contingent consideration - 0% - - (297)
In-process research and development costs - 0% - - 5
Other (income)/expense - 0% - - (584)
Restructuring and integration costs - 0% - - 42
Other non-GAAP charges - 0% - (37) - (37) 37
Amortization of finite-lived intangibles - 0% - - 1,915
Asset Impairments - 0% - - 629
Goodwill impairment - 0% - - 312
YTD 2017 Non-GAAP $ 4,660 71% $ 1,421 $ 485 $ 271 $ 2,177 $ 2,483
YTD 2016
Operating
Total Gross Total Gross Selling, A&P R&D Operating Income
Profit Margin Expense G&A Expense Expense Expense (EBITA)
YTD 2016 GAAP $ 5,326 73% $ 1,547 $ 598 $ 328 $ 2,473 $ (716)
Amortization resulting from inventory step-up 38 1% - 38
Depreciation expense resulting from PP&E step-up/down 6 0% (2) - (2) 8
Acquisition-related contingent consideration - 0% - 18
Share-based compensation - 0% 2 2 (2)
In-process research and development costs - 0% - 34
Other (income)/expense - 0% (6) (6) (19)
Restructuring and integration costs - 0% - 78
Other non-GAAP charges 9 0% (98) (16) (114) 129
Amortization of finite-lived intangibles - 0% - 2,015
Asset Impairments - 0% - 394
Goodwill impairment - 0% - 1,049
YTD 2016 Non-GAAP (As Reported) (a) $ 5,379 74% $ 1,541 $ 500 $ 312 $ 2,353 $ 3,026
Depreciation expense resulting from PP&E step-up/down (6) 0% - 2 - 2 (8)
Share-based compensation - 0% - (23) - 2 (23)
YTD 2016 Non-GAAP (Revised Basis) (b) $ 5,373 74% $ 1,541 $ 479 $ 312 $ 2,357 $ 2,995
(a) These subtotals reflect Adjusted financial measures (non-GAAP) reported by the Company for the 2017 and 2016 periods presented using the methodology for calculating the Adjusted financial measures (non-GAAP) as of
those dates.
(b) As of the third quarter of 2016, these Adjusted financial measures (non-GAAP) no longer include adjustments for the following items: Depreciation resulting from a PP&E step-up resulting from acquisitions and Previously
accelerated vesting of certain share-based equity adjustments. Depreciation resulting from a PP&E step-up resulting from acquisitions was a component of Acquisition-related adjustments excluding amortization of intangible
assets. Previously accelerated vesting of certain share-based equity adjustments was a component of Other non-GAAP charges. For the purpose of allowing investors to evaluate these Adjusted financial measures (non-GAAP)
on the same basis for the periods presented, these adjustments have been removed from the results for the periods presented in 2016.
42Financial Summary – Adjusted (non-GAAP)
Presentation Reconciliation
YTD 2017
B&L / International
Operating
Segment Segment Selling, A&P R&D Operating Operating Margin/ EBITA
Gross Profit Gross Margin Expense G&A Expense Expense Expense Income (EBITA) Margin
YTD 2017 GAAP $ 2,229 61% $ 932 $ 145 $ 55 $ 1,132 $ 1,097 30%
Other non-GAAP charges - 0% - - - - - 0%
YTD 2017 Non-GAAP $ 2,229 61% $ 932 $ 145 $ 55 $ 1,132 $ 1,097 30%
YTD 2016
B&L / International
Operating
Total Gross Total Gross Selling, A&P R&D Operating Operating Margin/ EBITA
Profit Margin Expense G&A Expense Expense Expense Income (EBITA) Margin
YTD 2016 GAAP $ 2,261 62% $ 971 $ 154 $ 64 $ 1,189 $ 1,072 29%
Amortization resulting from inventory step-up 5 0% - - 4 0%
Depreciation expense resulting from PP&E step-up/down 6 0% - - 6 0%
Other non-GAAP charges 3 0% - - 4 0%
YTD 2016 Non-GAAP (As Reported) (a) $ 2,275 62% $ 971 $ 154 $ 64 $ 1,189 $ 1,086 30%
Depreciation expense resulting from PP&E step-up/down (6) 0% - - - - (6) 0%
YTD 2016 Non-GAAP (Revised Basis) (b) $ 2,269 62% $ 971 $ 154 $ 64 $ 1,189 $ 1,080 30%
(a) These subtotals reflect Adjusted financial measures (non-GAAP) reported by the Company for the 2017 and 2016 periods presented using the methodology for calculating the Adjusted financial measures (non-GAAP) as of
those dates.
(b) As of the third quarter of 2016, these Adjusted financial measures (non-GAAP) no longer include adjustments for the following items: Depreciation resulting from a PP&E step-up resulting from acquisitions and Previously
accelerated vesting of certain share-based equity adjustments. Depreciation resulting from a PP&E step-up resulting from acquisitions was a component of Acquisition-related adjustments excluding amortization of intangible
assets. Previously accelerated vesting of certain share-based equity adjustments was a component of Other non-GAAP charges. For the purpose of allowing investors to evaluate these Adjusted financial measures (non-GAAP)
on the same basis for the periods presented, these adjustments have been removed from the results for the periods presented in 2016.
43Financial Summary – Adjusted (non-GAAP)
Presentation Reconciliation
YTD 2017
Branded Rx
Operating
Segment Segment Selling, A&P R&D Operating Operating Margin/ EBITA
Gross Profit Gross Margin Expense G&A Expense Expense Expense Income (EBITA) Margin
YTD 2017 GAAP $ 1,566 84% $ 415 $ 82 $ 45 $ 542 $ 1,024 55%
Other non-GAAP charges - 0% - - - 0%
YTD 2017 Non-GAAP $ 1,566 84% $ 415 $ 82 $ 45 $ 542 $ 1,024 55%
YTD 2016
Branded Rx
Operating
Total Gross Total Gross Selling, A&P R&D Operating Operating Margin/ EBITA
Profit Margin Expense G&A Expense Expense Expense Income (EBITA) Margin
YTD 2016 GAAP $ 1,726 83% $ 498 $ 64 $ 85 $ 647 $ 1,078 52%
Amortization resulting from inventory step-up 33 2% - - 33 2%
Depreciation expense resulting from PP&E step-up/down (0) 0% - - (0) 0%
Other non-GAAP charges 4 0% (6) (6) (15) (27) 32 1%
YTD 2016 Non-GAAP $ 1,763 85% $ 492 $ 58 $ 70 $ 620 $ 1,143 55%
(a) These subtotals reflect Adjusted financial measures (non-GAAP) reported by the Company for the 2016 periods presented using the methodology for calculating the Adjusted financial measures (non-GAAP) as of those dates.
(b) As of the third quarter of 2016, these Adjusted financial measures (non-GAAP) no longer include adjustments for the following items: Depreciation resulting from a PP&E step-up resulting from acquisitions and Previously accelerated
vesting of certain share-based equity adjustments. Depreciation resulting from a PP&E step-up resulting from acquisitions was a component of Acquisition-related adjustments excluding amortization of intangible assets. Previously
accelerated vesting of certain share-based equity adjustments was a component of Other non-GAAP charges. For the purpose of allowing investors to evaluate these Adjusted financial measures (non-GAAP) on the same basis for the
periods presented, these adjustments have been removed from the results for the periods presented in 2016.
44Financial Summary – Adjusted (non-GAAP)
Presentation Reconciliation
YTD 2017
US Diversified
Operating
Segment Segment Selling, A&P R&D Operating Operating Margin/ EBITA
Gross Profit Gross Margin Expense G&A Expense Expense Expense Income (EBITA) Margin
YTD 2017 GAAP $ 865 83% $ 74 $ 30 $ 4 $ 108 $ 757 73%
Other non-GAAP charges - 0% - - - 0%
YTD 2017 Non-GAAP $ 865 83% $ 74 $ 30 $ 4 $ 108 $ 757 73%
YTD 2016
US Diversified
Operating
Total Gross Total Gross Selling, A&P R&D Operating Operating Margin/ EBITA
Profit Margin Expense G&A Expense Expense Expense Income (EBITA) Margin
YTD 2016 GAAP $ 1,340 88% $ 80 $ 27 $ 6 $ 113 $ 1,227 81%
Other non-GAAP charges 2 0% - - 2 0%
YTD 2016 Non-GAAP (As Reported) (a) $ 1,342 88% $ 80 $ 27 $ 6 $ 113 $ 1,229 81%
(a) These subtotals reflect Adjusted financial measures (non-GAAP) reported by the Company for the 2017 and 2016 periods presented using the methodology for calculating the Adjusted financial measures (non-GAAP) as of
those dates.
45Financial Summary – Adjusted (non-GAAP)
Presentation Reconciliation
Q3 2017
Total Total Selling, Operating
Gross Gross A&P G&A R&D Operating Income/
Profit Margin Expense Expense Expense Expense EBITA
GAAP $ 1,561 70% $ 465 $ 159 $ 81 $ 705 $ 38
Acquisition-related contingent consideration - 0% - - (238)
Other (income)/expense - 0% - - (325)
Restructuring and integration costs - 0% - - 6
Other non-GAAP charges - 0% - (14) - (14) 14
Amortization of finite-lived intangibles - 0% - - 657
Asset Impairments - 0% - - 406
Goodwill impairment - 0% - - 312
Non-GAAP $ 1,561 70% $ 465 $ 145 $ 81 $ 691 $ 870
Q3 2016
Total Total Selling, Operating
Gross Gross A&P G&A R&D Operating Income/
Profit Margin Expense Expense Expense Expense EBITA
GAAP $ 1,822 73% $ 459 $ 201 $ 101 $ 761 $ (863)
Amortization resulting from inventory step-up 2 0% - - 2
Acquisition-related contingent consideration - 0% - - 9
In-process research and development costs - 0% - - 31
Other (income)/expense - 0% - - 3
Restructuring and integration costs - 0% - - 20
Other non-GAAP charges 2 0% (19) - (19) 21
Amortization of finite-lived intangibles - 0% - - 664
Asset Impairments - 0% - - 148
Goodwill impairment - 0% - - 1,049
Non-GAAP (As Reported) (a) $ 1,826 74% $ 459 $ 182 $ 101 $ 742 $ 1,084
(a) These subtotals reflect Adjusted financial measures (non-GAAP) reported by the Company for the 2017 and 2016 periods presented using the methodology for calculating the Adjusted financial measures (non-GAAP) as of
those dates.
46You can also read