Attitudes towards and experiences of retirement and social security income during the COVID-recession and initial recovery ANU Centre for Social ...
←
→
Page content transcription
If your browser does not render page correctly, please read the page content below
Retirement income during COVID-19

    Attitudes towards and experiences of
    retirement and social security income
    during the COVID-recession and initial
                  recovery

       ANU Centre for Social Research and
                   Methods
Professor Nicholas Biddle1,2, Professor Robert Breunig2 and Dinith Marasinghe1

   1 ANU Centre for Social Research and Methods
   2 Tax and Transfer Policy Institute, Crawford School of Public Policy

Australian National University

4th May 2021

                                                                                 i
The ANU Centre for Social Research and Methods
Retirement income during COVID-19

Acknowledgements
The authors would like to thank a number of people who were involved in the development of
the ANUpoll questionnaires, including Diane Herz, Dr Benjamin Phillips, Dr Paul Myers, Matilda
Page, Diana Nguyen, Anna Lethborg and Charles Dove from the Social Research Centre, and
Professor Ian McAllister, Emeritus Professor Toni Makkai, Professor Matthew Gray, Associate
Professor Ben Edwards and Kate Sollis from the ANU. Financial support for the ANU COVID-19
Impact Monitoring Survey Program has been provided by the Australian Institute of Health and
Welfare. For this particular survey, the ANU received funding from the Minderoo Foundation,
for which we are particularly appreciative.

Abstract
In January 2021, the Social Research Centre on behalf of the ANU Centre for Social Research
and Methods undertook a survey of 3,459 Australians through the Life in AustraliaTM panel.
The aim of this paper is to explore the attitudes towards, and experiences of, retirement
income at the start of 2021 and provide comparisons with a 2015 survey. Our analysis suggests
that the general public would prefer a higher age pension than is currently legislated. There is
support for an even greater increase in the JobSeeker payment that is received by those of
non-retirement age who are actively seeking work. There is less support for changes to the
income test for the age pension and most Australians appear to be supportive of the currently
legislated increase in the superannuation guarantee. We find that there are three groups
within the population who have higher than average perceived longevity risk – females, those
with low levels of education, and those who live outside of a capital city.

                                                                                              ii
The ANU Centre for Social Research and Methods
Retirement income during COVID-19
Executive summary
Payment rates
• The current JobSeeker payment, for a single person with no children is $ $620.80 per fortnight,
a decline from $715.70 per fortnight that had been in place up until March 31st 2021. The
current Age Pension, (including supplements), for a single person with no children is $944.30
per fortnight. Both are too low according to our respondents, with the average JobSeeker
payment supported by the community being $711, and the average Age Pension being $1,115.
Our findings also suggest that respondents think there should be less of a gap between
JobSeeker and the Age Pension than the current gap.
Asset tests
• The level of the Age Pension is not the only policy setting that impacts people’s retirement
incomes. It would appear that the Australian population is split roughly evenly between those
who think a person’s primary residence should be included in the asset test, and those who
don’t, with the latter being the current policy setting.
Longevity risks
• The majority of Australians (55.7 per cent) who weren’t currently retired think that they will
not have enough money when they do. This was a very large increase from 2015, the last time
these questions were asked.
• Longevity risk perceptions were lower, however, for those who were currently retired.
• In a regression model, females; those who had not completed Year 12; and those who lived
outside of a capital city had a higher self-reported probability of running out of savings. Young
Australians (aged 18 to 24) and older Australians (aged 55 years and over) had a lower self-
reported probability of running out of money (compared to those aged 35 to 44 years), as did
those who spoke a language other than English, those who had a bachelor degree or higher,
and those who lived in the most advantaged suburbs.
Superannuation policy
• Most Australians accept that income in retirement need not be as high as income when
working. The Australian public, without any prompting, gave a very similar response to the
assumption in the literature, as well as the Retirement Income Review. When respondents
were asked what the replacement rate should be, the median response was 70 per cent and
the mean response was 70.8 per cent.
• There is strong support for the legislated change to the Superannuation Guarantee. Only 3.8
per cent of respondents said that ‘The rate should be decreased to below 9.5% or abolished
entirely’. A larger proportion of the population, but still a minority (20.4 per cent), said that
‘The rate should stay as it currently is (9.5%).’ The modal response, however, and a clear
majority of Australians (55.0 per cent) said ‘The rate should increase as legislated (to 12% by
July 2025)’ with a further minority (20.8 per cent) saying that ‘The rate should be increased
beyond 12%’.
• When asked ‘If you were able to access your superannuation early, and could direct some of
your superannuation to other uses’, 52.4 per cent of respondents said they would leave all the
savings in their superannuation. Of the remaining respondents who would draw down on their
superannuation, 26.9 per cent said they would use some or all of their savings to purchase a
home or reduce their current mortgage(s); 10.2 per cent said they would use some or all of
their savings to meet current living expenses; and 10.5 per cent said they would use some or
all of their savings to make other investments.
iii
The ANU Centre for Social Research and MethodsRetirement income during COVID-19
1 Introduction
Australia has a unique system for maintaining the income and general standard of living for
those who have retired or who are still working but beyond the typical retirement age. The
Australian retirement income system is a three-pillar system that comprises (1) a means-tested
age pension provided by the government; (2) compulsory Superannuation Guarantee (SG)
contributions by employers; and (3) voluntary savings, including home ownership.
Each pillar serves a distinctive purpose in the retirement income system. The Age Pension aims
to mitigate poverty and minimize income inequality in retirement. The second pillar,
compulsory SG, aims to smooth lifecycle consumption of retirees and minimise the cost to the
government of supporting those of retirement age. Lastly, the third pillar, voluntary savings,
supplements retirees with additional resources for retirement and allows individuals to make
their own choices about their retirement. A summary of each pillar is given below.
The Australian government recently undertook a substantial review of the retirement income
system. In November 2020 the final report from the Retirement Income Review (RIR)—see
Treasury (2020) was released. The authors state that the report ‘provides a fact base of the
current retirement income system in the context of an ageing society. Its objective is to
improve understanding of the system’s operations and the outcomes it is delivering for
Australians.’ The authors concluded that ‘the Australian retirement income system is effective,
sound and broadly sustainable. But it can be improved.’
A significant amount of administrative and survey data was used to support the conclusions of
the review. However, the report did not present much information on attitudes of the
Australian public towards the retirement income system. This information can provide an
additional set of evidence to the measures of sustainability, poverty, standard of living, and
inequality presented in the review. Attitudes towards the system can reflect people’s
preferences as well as their understanding of the system and any misconceptions they may
have. In this paper, we therefore, provide this complementary view of the Australian
retirement income system.
2 Background and data
In this section, we briefly discuss the three main pillars of Australia’s retirement income,
provide some international comparison for context and present the data which we use in our
analysis.
2.1 Age Pension
The age pension is a means-tested payment that was introduced in 1909 to provide a ‘safety
net’ for retirees who do not have the financial means to support a minimum standard of living.
Eligibility for the Age Pension is based on age, residency status and a means test. The age
pension is the main source of retirement income for a majority of retired Australians. In 2019,
approximately 65% of people over the eligibility age received the age pension.1 It is more likely
to be the main source of retirement income for individuals who were in low to middle-income
groups over their working lives.2 This suggests that the age pension not only provides a safety
net for low-income earners, but it supplements the retirement income of individuals who were
1
Treasury 2020, p.71
2
Productivity Commission 2015, p.44
4
The ANU Centre for Social Research and MethodsRetirement income during COVID-19
middle-income earners. As of the 1st of May 2020, the maximum Age Pension rate an individual
will be eligible to receive is $944.30 per fortnight (or $711.80 for each member of a couple).
Age pensioners can also supplement their retirement income through other payments from
the income support system. These include Commonwealth Rent Assistance, Disability support,
Carer Payment and Pensioner Education Supplement. In addition to these payments, Age
Pensioners are also eligible for Government concessions, such as subsidised aged care and
health services, as well as various tax offsets (seniors and pensioners tax offsets). In
conjunction with the concessions and tax offsets, the age pension plays a vital role in alleviating
poverty and diminishing income inequality amongst retirees (Productivity Commission 2015).
The Age Pension also provides a degree of protection against longevity and/or systematic
market risks (Harmer 2009;Coates et al. 2020).
Currently, individuals need to be 66 years old to be eligible for the age pension. This will rise
to 67 years for those born on or after 1 January 1957.
2.2 Compulsory Superannuation Guarantee
In 1992, the Compulsory Superannuation Guarantee (SG) was introduced, requiring all
employers to contribute to their employees’ superannuation. The SG requires Australian
workers to save a portion of their wages over their working lives, in exchange for a better
standard of living during their retirement. The current contribution rate is 9.5% of gross salary
and is legislated to rise to 12% by July 20253. Individuals can access their superannuation at
the ‘preservation age’. The preservation age is 55 for individuals born before 1 July 1960 and
60 for those born after 1 July 1964. Importantly, the preservation age for accessing
superannuation and the eligibility age for the Age Pension are different.
2.3 Voluntary savings
Voluntary savings give individuals the opportunity to allocate more of their working life income
to retirement consumption or to save for contingencies or bequests. Voluntary savings are
particularly important for those individuals not covered by the SG.4 Voluntary savings can be
made into the superannuation system (with associated tax benefits), through the accumulation
of wealth through owning one’s primary residence, and through other forms of wealth
accumulation (the stock market or other assets).
Different types of savings are treated very differently in the tax and social security systems.
Superannuation and owner-occupied housing are particularly tax effective savings vehicles and
receive the majority of Australians’ voluntary savings—see Varela, Breunig and Sobeck (2020).
In 2017-18, voluntary superannuation contributions accounted for 40% of total
superannuation contributions5. Employees can make additional voluntary contributions from
their pre-tax income via salary sacrifice or from post-tax income. Contributions from pre-tax
income are taxed concessionally at 15%. In addition to this, the Government also provides
other contributions and offsets to low- and middle-income earners. These include low-income
superannuation tax offset and Government co-contribution—see Sobeck and Breunig (2020).
In addition to savings through voluntary superannuation contributions, other voluntary savings
3
Contribution rates are based on an employee’s ordinary time earnings and do not include overtime payments
or parental leave
4
Self-employed; employees earning less than $450 per month; under 18 and work less than 30 hours per
week; individuals who engage in private or domestic nature for less than 30 hours per week
5
Treasury 2020, p.77
5
The ANU Centre for Social Research and MethodsRetirement income during COVID-19
include business assets, real estate and other financial assets. The tax treatment of different
savings vehicles in Australia varies widely with some savings vehicles essentially paying no tax
(or even negative tax) and others paying very high marginal rates (see Varela et al. (2020)).
2.4 International comparisons
There are several ageing and retirement indices that provide an indication of the quality of life
of older people and evaluate the strengths and weaknesses of retirement systems across
countries. According to an analysis by Chomik and Rodgers (2018), Australia ranks in the top
third of countries in most such indices. They consider a meta-index which shows Nordic
countries taking the top three places, followed by Australia and the US.
Australia’s retirement income system is relatively sustainable compared to other countries.
The ageing of the Australian population is slower than in other OECD countries (in large part
due to international migration). Public spending on pensions in Australia is the third lowest
among the developed countries and is expected to continue to remain relatively low. These
two factors result in lower public finance pressure than in many OECD countries. Australia’s
first pillar is more prominent than in other countries, with 78% of retirees covered by Age
Pension compared to the OECD average coverage of 30%. However, almost 38% of all
recipients in Australia receive only a partial age pension—their Age Pension benefit is reduced
by the means test. The benefit itself is modest, with a maximum worth below 30% of average
earnings – close to the average percentage across the OECD (OECD 2017). Australia’s age
pension scheme covers more people but with more modest payments than other OECD
countries.
Australia has one of the lowest mandatory contribution rates for pensions in comparison to
other OECD countries. In terms of private pension assets as a proportion of GDP, Australian
superannuation assets have grown to be one of the largest in the world – approximately 150%
of GDP in 2018. This reflects strong investment earnings (ASFA 2019) and therefore may be
impacted by future market shocks. There are no credits for either unemployment or childcare
absence within the Superannuation system, unlike most other OECD countries.
For a full-time career Australian with average earnings, net replacement rates are low (around
40%) when compared to other OECD countries. For low-income workers, replacement rates
are higher (at around 90%) which places Australia in the top third of OECD countries. Relative
incomes of those aged over 65 to the total population are low at 72% compared to the average
of 87%. The old-age relative income poverty rate is high at 23% compared to 14% across the
OECD in 2016, but these figures might be skewed since superannuation funds can be taken as
lump-sum.
2.5 Data in this paper
In January 2021, the Social Research Centre on behalf of the ANU Centre for Social Research
and Methods undertook a survey of 3,459 Australians through the Life in AustraliaTM panel.
This survey collected a range of outcome and attitudinal data related to COVID-19 and the
COVID-recession. In addition, a number of questions were asked regarding the retirement
income system.
Data were collected from the 18th of January through to the 1st of February 2021. Across the
full sample, 57.4 per cent of respondents were enumerated during the first three full days of
data collection (between the 19th and 21st of January). Of the entire sample, 95.1 per cent were
collected online and 4.9 per cent were collected over the telephone.
6
The ANU Centre for Social Research and MethodsRetirement income during COVID-19
One of the benefits of collecting data through the Life in AustraliaTM panel is that individuals
and their responses can be linked across time. For the January 2021 sample, 85.9 per cent had
been interviewed in an ANUpoll from 2020. The relatively low backwards linkage rate is due to
a sample refresh between November 2020 and January 2021, with forward linkage rates
significantly higher. Specifically, 92.4 per cent of those who completed the November 2020
survey (3,029 respondents in total) also completed the January 2021 survey. Going back even
further, 83.8 per cent of those who completed the January 2020 survey also completed the
January 2021 survey, with a corresponding rate of 90.4 per cent for those who completed the
August 2020 survey. More detail on the data collection for the survey is available in the
Appendix to this paper.
With this data and policy context in mind, the aim of this paper is to explore the attitudes
towards, and experiences of, retirement income at the start of 2021, with comparisons to a
previous survey in 2015. Limited comparisons are made with social security income, with a
subsequent wave of data collection (in April 2021) exploring aged care in more detail.
3 Attitudes towards the level and operation of the Age Pension
Although the Age Pension is one of the three pillars of the retirement income system, and one
that has very broad bi-partisan support, there are still divergent views on aspects of the system.
We asked participants about three aspects of the Age Pension, namely the level of payment
(for single recipients), income tests, and asset tests.
3.1 Views on the level of the Age Pension and JobSeeker
Until 1997, payments received as part of the age pension were growing at reasonably similar
rates to payments for those who were unemployed and actively seeking work. Since that time
however, the age pension has been indexed to earnings (to reflect changes in the general
standard of living of workers) whereas the unemployment benefit has been indexed to the
Consumer Price Index (to reflect changes in prices only). Over time, this has led to a divergence
in the levels of the two payments, to the extent that there have been a number of groups who
have advocated for an increase in the latter.
In the January 2021 survey, respondents were asked the following two questions about the
JobSeeker and Age Pension rates:
• The current JobSeeker payment, (including the Coronavirus supplement), for a single
person with no children is $715.70 per fortnight. From the 1st of April 2021 it will return
to $565.70 per fortnight. In your opinion, what do you think the JobSeeker payment
should be per fortnight?6
• The current Age Pension, (including supplements), for a single person with no children
is $944.30 per fortnight. In your opinion, what do you think the Age Pension rate for an
individual should be per fortnight?
The order of the two questions was randomised, with half being asked about Age Pensions first
and the other half asked about JobSeeker. Across the combined samples, the average7
JobSeeker payment as supported by the community is $711 per fortnight, whereas the average
Age Pension is $1,115 per fortnight (Figure 1).
6
It should be noted that as of April 1st, 2021, the current JobSeeker rate is $620.80.
7
The 20 responses of $2,000 or more to the age pension question are capped at $2,000, as were the 9
responses to the JobSeeker question of $2,000 or more
7
The ANU Centre for Social Research and MethodsRetirement income during COVID-19
Figure 1 Distribution of responses to preferred JobSeeker and age pension rate
Source: ANUpoll, January 2021.
Note: Data is unweighted
The ordering of the survey questions did matter. When respondents were asked about the
JobSeeker supplement before being asked about the Age Pension (that is, they were primed
for the current JobSeeker rates but not the current Age Pension rates), they give a lower
preferred value for JobSeeker ($677 per fortnight compared to $744 per fortnight). When
respondents are asked about the Age Pension before being asked about the JobSeeker
supplement (that is, they were primed for the current Age Pension rates but not the current
JobSeeker rates), they give a higher preferred value for the Age Pension ($1,194 per fortnight
compared to $1,034 per fortnight). Combined, and keeping in mind that, while possible, it is
very rare for respondents to move backwards in the survey to change their answers to
previously answered questions, these findings suggest that respondents think there should be
less of a gap between JobSeeker and the Age Pension than the current gap, not to mention
what the gap will be when the JobSeeker payment ends.
A minority of respondents (20.9 per cent) think that the Age Pension should be roughly equal
to its current rate (between $940 and $950) with only 8.6 per cent of respondents thinking it
should be lower. The vast majority of respondents (70.5 per cent) think the age pension should
be higher than it currently is.
8
The ANU Centre for Social Research and MethodsRetirement income during COVID-19
Around 13.8 per cent of respondents think JobSeeker should revert to roughly its pre-COVID
levels ($560 to $570) with a further 14.0 per cent thinking it should be even lower than its pre-
COVID levels. Only 9.1 per cent of respondents think that JobSeeker should stay at the level it
was at during the survey ($710 to $720), with 29.9 per cent of respondents thinking JobSeeker
should be somewhere between its pre-COVID levels and the level it was at the time of the
survey. The remaining roughly one-third of the sample (33.2 per cent) think JobSeeker should
be increased from its level at the time of the survey. On balance, it would appear that there is
very little support for JobSeeker to return to its pre-COVID level, with a little under three-
quarters of the population thinking it should be higher. Of course, respondents might give a
different response if they were explicitly reminded that the additional payments would need
to be paid out of taxation and if they were provided with information on the total cost of any
policy change. Nonetheless, in the abstract, it would appear that the general public is
supportive of higher rates.
There is a strong correlation between a person’s preferred JobSeeker rate and their preferred
Age Pension rate (correlation coefficient = 0.4366). This suggests that part of the variation in
how people view the adequacy of the age pension is a general view on transfer payments.
A person’s own experience with income support as well as their expected future requirements
are both likely to influence their views on the appropriate payment rates. In Table 1, we
present coefficient estimates from a model of the factors associated with the preferred
JobSeeker/Age Pension rates (as the relevant dependent variables). In addition to controlling
for the order in which the JobSeeker and Age Pension questions were asked, we also include a
set of demographic, socioeconomic and geographic variables as independent variables.
Those who are currently employed have a lower preferred JobSeeker rate, but no difference
in their preferred Age Pension rate. The first of these findings is not surprising as those who
are not currently employed are more likely to have relied on JobSeeker or an equivalent
payment in the past, currently rely on the payment, or expect to do so in the near future.
Demographically, there were no differences by sex in either of the rates. However, young
Australians (aged 18 to 24 years) have a slightly higher, but non-significant, preferred
JobSeeker rate (p-value = 0.153) and a lower, but non-significant, preferred Age Pension (p-
value = 0.154) with the next oldest age group (aged 25 to 34 years) having a significantly lower
preferred Age Pension. While it is perhaps not surprising that older Australians (those aged 65
years and over) have a lower preferred JobSeeker rate given they are unlikely to have to rely
on JobKeeper now they are eligible for the Aged Pension, it is perhaps a little more surprising
that older Australians (starting from those aged 55 years and over) have a lower preferred Age
Pension rate. This may indicate that their personal experiences on receiving the Age Pension,
or closer interactions with others on the Age Pension, resulting in them feeling that the
payment is overly generous.
Those born overseas in a non-English speaking country had a lower preferred JobSeeker rate,
whereas those born overseas in an English speaking country had a higher preferred Age
Pension rate. Those with a Bachelor Degree or above have a higher preferred JobSeeker
amount, but no difference in preferred Age Pension, whereas those with a Certificate III/IV
have a higher preferred Age Pension. Finally, those who live outside of Capital Cities have a
lower preferred JobSeeker rate, but no difference in preferred Age Pension. This may reflect
the different costs of living outside of Capital Cities and the amount of goods and services that
can be purchased with a given income.
9
The ANU Centre for Social Research and MethodsRetirement income during COVID-19
Table 1 Demographic, socioeconomic, and geographic factors associated with
preferred JobKeeper and Age Pension rate
JobKeeper Age Pension
Coeff. Signif. Coeff. Signif.
Currently employed -44.8 *** 7.8
Female -1.2 7.8
Aged 18 to 24 years 50.7 -49.9
Aged 25 to 34 years 16.8 -40.4 *
Aged 45 to 54 years -7.8 -16.8
Aged 55 to 64 years -13.5 -46.2 **
Aged 65 to 74 years -56.2 ** -69.1 ***
Aged 75 years plus -74.8 *** -91.5 ***
Indigenous 7.5 35.6
Born overseas in a main English speaking country 5.4 34.3 *
Born overseas in a non-English speaking country -56.3 ** 23.6
Speaks a language other than English at home -14.7 -40.9
Has not completed Year 12 or post-school qualification -35.5 -15.8
Has a post graduate degree 49.2 * 15.6
Has an undergraduate degree 46.1 ** 33.7
Has a Certificate III/IV, Diploma or Associate Degree -2.3 52.2 **
Lives in the most disadvantaged areas (1st quintile) -30.6 -4.4
Lives in next most disadvantaged areas (2nd quintile) -34.3 1.6
Lives in next most advantaged areas (4th quintile) -32.3 8.7
Lives in the most advantaged areas (5th quintile) -23.8 23.8
Lives in a non-capital city -30.7 ** -16.7
Asked about JobSeeker first in survey -67.0 *** -158.6 ***
Constant 815.7 *** 1193.3 ***
Adjusted R-Squared 0.042 0.1051
Sample size 2,912 2,932
Source: ANUpoll, January 2021.
Notes: Linear Regression Model. The base case individual is not employed; male; aged 35 to 44 years; non-
Indigenous; born in Australia; does not speak a language other than English at home; has completed Year
12 but does not have a post-graduate degree; lives in neither an advantaged or disadvantaged suburb
(third quintile); lives in a capital city; and was asked about the age pension first. Coefficients that are
statistically significant at the 1 per cent level of significance are labelled ***; those significant at the 5
per cent level of significance are labelled **, and those significant at the 10 per cent level of significance
are labelled *.
3.2 Operation of the Age Pension
The level of the Age Pension is not the only policy setting that impacts people’s retirement
incomes, nor is it the only policy setting that can and occasionally does vary. Financial outlays,
as well as equity within the system, is also impacted by eligibility requirements and how other
assets are factored into the eligibility and full or part-payment.
In order to measure the views of Australians on income tests and the age pension, respondents
were asked: ‘Which of the following statements best describes your views about getting the
Federal Government’s Age Pension?’. Across the four options that related to income tests, 26.7
per cent of respondents thought that ‘Everyone should receive the full amount of the age
pension as a right’; 49.2 per cent of respondents thought that ‘Everyone should receive at least
some of the age pension even when they have other income’; 22.5 per cent of respondents
thought that ‘Only people with no other income should receive an age pension’; and 1.5 per
cent of respondents thought that ‘Nobody should receive an age pension – people should
make their own financial arrangements for retirement.’
10
The ANU Centre for Social Research and MethodsRetirement income during COVID-19
There has been some change in these percentages since the question was last asked as part of
an ANUpoll (November 2015). Then, fewer Australians thought that everyone should receive
the full amount (16.0 per cent) whereas more Australians thought that only people with no
income should receive the Age Pension (30.0 per cent). The other two categories received
broadly similar results (51.5 per cent and 2.9 per cent respectively).
To understand the factors associated with views on the income test, we use the same
independent variables from the model presented in Table 1 (with the exception of whether or
not the person was employed and the question-order dummy), and estimate the factors
associated with supporting a different option than the part age pension (at least some of the
age pension even when they have other income). The factors are estimated using a
multinomial probit model, and exclude those who think nobody should receive the age pension
(due to small sample sizes)8.
In the first part of Table 2, we can see that support for the view that everyone should receive
the full age pension compared to a part age pension was lower for older Australians and those
with a degree (compared to those aged 35 to 44 years and those who did not have a degree
respectively) and higher for those who were born overseas. Support for the view that only
those with no other income should receive the age pension rather than a part age pension was
lower for young Australians (aged 18 to 34) and older Australians (aged 55 years and over),
and those with a Certificate III/IV.
In Table 2, we estimate the same base model, but also include the person’s response to the
question on the desired rate of the age pension as an additional explanatory variable. There
are conflicting potential drivers of this relationship. On the one hand, it may be that people
who support a higher age pension do so because they feel it should be fully or partially
restricted to those without other forms of income. On the other hand, it may be that there is
an underlying latent support for income to pensioners that positively impacts both views.
While there are some in the data who support a high pension but restrictions on who receives
it, on balance it would appear from the data that those who prefer a higher age pension are
also more supportive of the view that everyone should receive the full age pension.
Another key aspect of the retirement income system is the interaction between the Age
Pension pillar and the voluntary savings pillar. Specifically, while those with a range of assets
receive a lower age pension if those assets are above a certain value, one key asset is excluded.
Specifically, according to Services Australia9 ‘We include most real estate assets you own in
your assets test. But not your principal home and up to the first 2 hectares of land it’s on…We
include real estate you: rent out; leave vacant for any amount of time (i.e. a holiday home); let
someone else live in for free.’
To test support for this key aspect of retirement income in Australia, respondents were asked
‘Do you think home ownership should affect whether a person receives the Federal
Government’s Age Pension and, if so, should this affect all home owners or only those above
a certain threshold?’ with the following response options and percentages. Across the
(weighted) sample, 7.9 per cent said yes, all those who own their own home should receive a
lower age pension; 42.0 per cent said yes, but only those with a home valued above a certain
8
We had considered an Ordered rather than a Multinomial probit model. However, because there were some
characteristics that predicted a higher/lower probability of being in both category 1 and category 3 relative to
the base case of category 2, we focus on results from the multinomial model.
9
https://www.servicesaustralia.gov.au/individuals/topics/asset-types/30621#a4
11
The ANU Centre for Social Research and MethodsRetirement income during COVID-19
threshold should receive a lower age pension; whereas 50.1 per cent said no. It would appear
that the Australian population is split roughly evenly between those who think a person’s
primary residence should be included in the asset test, and those who don’t.
Using a multinomial probit model again (Table 3), there were very few demographic or
socioeconomic characteristics that predicted whether or not someone thought all those who
own their own home should receive a lower age pension, as opposed to only those with a
home valued above a certain threshold. However, support for the view that home ownership
should not affect the age pension was lower for young Australians (aged 18 to 24 years), but
higher for those with a Certificate III/IV and those who lived outside of the middle quintile of
suburbs based on socioeconomic characteristics. Finally, in Table 2, we can see that those who
support a higher age pension are more likely to support the current policy approach of the
value of a person’s current home not impacting on their age pension.
12
The ANU Centre for Social Research and MethodsRetirement income during COVID-19
Table 2 Demographic, socioeconomic, and geographic factors associated with whether or not respondent thought people with another
source of income should receive the full-pension, or no pension (compared to a part-pension)
Model 1 Model 2
All homes No homes All homes No homes
Coeff. Signif. Coeff. Signif. Coeff. Signif. Coeff. Signif.
Preferred pension rate 0.000 0.001 ***
Female -0.023 0.129 0.000 0.107
Aged 18 to 24 years -0.268 -0.535 *** -0.229 -0.466 **
Aged 25 to 34 years -0.042 -0.139 0.023 -0.078
Aged 45 to 54 years -0.031 0.193 0.111 0.257 *
Aged 55 to 64 years -0.079 0.284 ** 0.038 0.373 ***
Aged 65 to 74 years -0.341 * 0.171 -0.372 * 0.284 **
Aged 75 years plus -0.127 0.142 0.058 0.240
Indigenous -0.330 0.072 -0.364 -0.060
Born overseas in a main English speaking country -0.255 -0.096 -0.186 -0.096
Born overseas in a non-English speaking country 0.038 -0.168 0.020 -0.183
Speaks a language other than English at home -0.041 -0.219 0.040 -0.180
Has not completed Year 12 or post-school qualification 0.173 0.067 0.282 0.049
Has a post graduate degree -0.122 -0.065 -0.015 -0.007
Has an undergraduate degree -0.086 -0.110 0.003 -0.118
Has a Certificate III/IV, Diploma or Associate Degree 0.021 0.270 ** 0.116 0.263 **
Lives in the most disadvantaged areas (1st quintile) 0.147 0.287 ** 0.069 0.297 **
Lives in next most disadvantaged areas (2nd quintile) 0.318 * 0.261 ** 0.296 0.256 **
Lives in next most advantaged areas (4th quintile) 0.280 0.209 * 0.197 0.186
Lives in the most advantaged areas (5th quintile) 0.174 0.232 * 0.078 0.169
Lives in a non-capital city -0.130 -0.027 -0.160 -0.058
Constant -1.193 *** -0.148 -1.139 *** -0.901 ***
Sample size 3,264 2,927
Source: ANUpoll, January 2021.
Notes: Multinomial Probit Model. The base category is that homes above a certain threshold should be used. The base case individual is not employed; male; aged 35 to 44
years; non-Indigenous; born in Australia; does not speak a language other than English at home; has completed Year 12 but does not have a post-graduate degree;
lives in neither an advantaged or disadvantaged suburb (third quintile); lives in a capital city; and was asked about the age pension first. Coefficients that are statistically
significant at the 1 per cent level of significance are labelled ***; those significant at the 5 per cent level of significance are labelled **, and those significant at the 10
per cent level of significance are labelled *.
13
The ANU Centre for Social Research and MethodsRetirement income during COVID-19
Table 3 Demographic, socioeconomic, and geographic factors associated with whether or not respondent thought home ownership should
or should not affect the aged pension (compared to asset values above a certain threshold)
Model 1 Model 2
Full-pension Zero pension Full-pension Zero pension
Coeff. Signif. Coeff. Signif. Coeff. Signif. Coeff. Signif.
Preferred pension rate 0.001 *** 0.000
Female -0.045 -0.107 -0.010 -0.130
Aged 18 to 24 years -0.043 -0.351 0.104 -0.166
Aged 25 to 34 years 0.060 -0.305 ** 0.072 -0.250
Aged 45 to 54 years -0.168 -0.163 -0.136 -0.132
Aged 55 to 64 years -0.508 *** -0.277 ** -0.531 *** -0.328 **
Aged 65 to 74 years -0.660 *** -0.514 *** -0.610 *** -0.566 ***
Aged 75 years plus -0.847 *** -0.587 *** -0.784 *** -0.698 ***
Indigenous 0.232 -0.403 0.377 -0.251
Born overseas in a main English speaking country 0.448 *** -0.123 0.494 *** -0.044
Born overseas in a non-English speaking country 0.521 *** -0.053 0.569 *** 0.026
Speaks a language other than English at home 0.059 0.156 0.075 0.138
Has not completed Year 12 or post-school qualification -0.099 0.072 -0.078 -0.016
Has a post graduate degree -0.410 *** -0.178 -0.461 *** -0.160
Has an undergraduate degree -0.300 ** -0.006 -0.372 *** -0.014
Has a Certificate III/IV, Diploma or Associate Degree -0.080 -0.274 ** -0.155 -0.286 *
Lives in the most disadvantaged areas (1st quintile) 0.223 0.030 0.161 -0.008
Lives in next most disadvantaged areas (2nd quintile) 0.033 -0.170 -0.048 -0.198
Lives in next most advantaged areas (4th quintile) -0.143 -0.002 -0.243 * -0.058
Lives in the most advantaged areas (5th quintile) -0.015 0.093 -0.055 0.079
Lives in a non-capital city -0.084 0.101 -0.041 0.171
Constant -0.313 * -0.200 -1.144 *** 0.022
Sample size 3,211 2,877
Source: ANUpoll, January 2021.
Notes: Multinomial Probit Model. The base category is that someone should receive a part-pension. The base case individual is not employed; male; aged 35 to 44 years;
non-Indigenous; born in Australia; does not speak a language other than English at home; has completed Year 12 but does not have a post-graduate degree; lives in
neither an advantaged or disadvantaged suburb (third quintile); lives in a capital city; and was asked about the age pension first. Coefficients that are statistically
significant at the 1 per cent level of significance are labelled ***; those significant at the 5 per cent level of significance are labelled **, and those significant at the 10
per cent level of significance are labelled *.
14
The ANU Centre for Social Research and MethodsRetirement income during COVID-19
4 Savings for own retirement and longevity risk
A key aspect of the retirement income review was a discussion of what is known as ‘longevity
risk’, or someone running out of savings (voluntary and compulsory) prior to death. There is a
significant amount of literature from an actuarial perspective on the actual risk individuals are
exposed to (Antolin 2007; Barrieu et al 2012), with the RIR concluding that, when the age
pension is factored in, the risk to individuals is quite low and many people end up reaching the
end of their life with more savings than when they retire, partly because of appreciation in
assets. As noted in the RIR, however, perceptions don’t necessarily align with actual risk.
Furthermore, there is very little understanding of how the perceived risk varies across
individuals and across countries, with the literature tending to focus on perceptions of
mortality or perceptions of the adequacy of savings, rather than the combination of the two
(McGarry 2020)
In the January 2021 ANUpoll, those who weren’t currently retired were asked: ‘When you
retire, do you think you will have enough money to live comfortably?’ This captures the second
aspect of longevity risk, which is the adequacy of financial savings. Leaving aside those who did
not know the answer to the question or who said they did not plan on retiring: 6.1 per cent of
respondents said yes, definitely; 38.3 per cent said yes, probably; 36.4 per cent said no,
probably not; and 19.3 per cent said no, definitely not.
In early 2021, as Australia was continuing to emerge from the COVID-recession, the majority
of Australians who weren’t currently retired thought that they will not have enough money
(55.7 per cent) when they do. This was a very large increase from 2015, the last time these
questions were asked in an ANUpoll, when only 39.6 per cent of Australians thought they
would have enough money to live comfortably (13.4 per cent definitely not, 24.2 per cent
probably not). There were similar numbers in 2015 who said they probably would have enough
money to live comfortably in retirement (39.2 per cent) as in 2021, but a very large decline in
the per cent of people who said they definitely would have enough money (21.3 per cent in
2015, 6.1 per cent in 2021).
Longevity risk perceptions were lower for those who were currently retired, who were asked
a slightly different question: ‘Do you think you will have enough money to live comfortably for
the rest of your retirement?’ Leaving aside those who did not know: 16.8 per cent of
respondents said yes, definitely; 55.3 per cent said yes, probably; 21.5 per cent said no,
probably not; and 6.5 per cent said no, definitely not.10
The change in perceived longevity risk was much lower for those who were currently retired.
In 2015, around three quarters of retirees thought they had enough money to live comfortably
for the rest of their retirement (34.1 per cent said definitely and 40.8 per cent said probably).
This declined only slightly to 72.1 per cent by 2021, though it should be noted that there was
a bigger decline in the definitely group (to 16.8 per cent) and a large increase in the possibly
group (to 55.3 per cent).
10
We do not specify explicitly whether people should consider all three pillars of the retirement income
system or just their own savings (i.e. excluding the age pension). Future surveys could ask for the extent to
which Australians expect to rely on the age pension once their own savings have been exhausted. This survey
and others have shown that Australians, particularly young Australians, are sceptical about the sustainability of
the Age Pension despite the program being judged by experts to be financially sound and very sustainable.
This view may come from media reports of unsustainable pension systems in Western Europe and the U.S. and
Australians may automatically assume that the same holds true here.
15
The ANU Centre for Social Research and MethodsRetirement income during COVID-19
To try and obtain a more precise estimate of perceived longevity risk, respondents (including
those who were currently retired and those who were not) were told ‘I would like you to think
about your longevity risk, which is the risk of outliving your savings.’ They were then asked
‘What do you think is the per cent chance that you will run out of savings before you die?’ The
median response was 50 per cent, with a mean of 49.7 per cent. This was very similar to the
49.2 per cent of the combined retiree/non-retiree sample who said that they definitely or
probably would not have enough money to live comfortably during their retirement. There is
a tri-modal distribution (Figure 2) around the extremes and the median, with 10.9 per cent of
respondents saying exactly 0 per cent, 19.7 per cent saying exactly 50 per cent, and 17.6 per
cent saying exactly 100 per cent.
Figure 2 Distribution of longevity risk, by sex
Source: ANUpoll, January 2021.
Note: Data is unweighted
The benefit of the specific longevity risk question is that it is possible to make use of the much
greater variability in responses (compared to the categorical questions). In a regression model
using demographic, geographic and socioeconomic characteristics only (Model 1, Table 4),
females; those who had not completed Year 12; and those who lived outside of a capital city
had a higher self-reported probability of running out of savings. Young Australians (aged 18 to
24) and older Australians (aged 55 years and over) had a lower self-reported probability of
running out of money (compared to those aged 35 to 44 years), as did those who spoke a
language other than English, those who had a bachelor degree or higher, and those who lived
in the most advantaged suburbs. Controlling for these characteristics, those who were retired
16
The ANU Centre for Social Research and MethodsRetirement income during COVID-19
had a lower self-reported probability. In the final regression model, those who owned an
investment property, a self-managed superannuation fund or shares in an ASX listed company
had lower self-reported probability.
Table 4 Demographic, socioeconomic, and geographic factors associated with self-
reported longevity risk
Model 1 Model 2 Model 3
Coeff. Signif. Coeff. Signif. Coeff. Signif.
Currently retired -15.9 *** -14.9 ***
Has an investment property -10.5 ***
Has a self-managed superannuation account -4.7 **
Has shares in an ASX listed company -11.4 ***
Female 4.7 *** 4.8 *** 3.9 ***
Aged 18 to 24 years -12.3 *** -12.4 *** -14.4 ***
Aged 25 to 34 years -3.0 -3.3 -5.0 **
Aged 45 to 54 years -0.4 0.2 1.4
Aged 55 to 64 years -8.4 *** -4.5 * -3.0
Aged 65 to 74 years -22.9 *** -9.7 *** -8.0 **
Aged 75 years plus -31.4 *** -16.5 *** -15.2 ***
Indigenous 5.4 7.0 5.1
Born overseas in a main English speaking country 0.3 -0.3 -1.6
Born overseas in a non-English speaking country -0.9 -1.0 -1.5
Speaks a language other than English at home -7.1 *** -7.1 *** -7.6 ***
Has not completed Year 12 or post-school qualification 5.6 ** 5.4 ** 4.7 *
Has a post graduate degree -9.3 *** -9.3 *** -7.0 ***
Has an undergraduate degree -11.6 *** -11.7 *** -9.6 ***
Has a Certificate III/IV, Diploma or Associate Degree 0.1 0.1 0.4
Lives in the most disadvantaged areas (1st quintile) 1.7 1.3 0.7
Lives in next most disadvantaged areas (2nd quintile) 2.0 1.8 1.4
Lives in next most advantaged areas (4th quintile) -2.6 -3.1 -2.6
Lives in the most advantaged areas (5th quintile) -4.4 ** -5.0 ** -3.6 *
Lives in a non-capital city 4.1 ** 4.2 ** 3.6 **
Constant 57.8 *** 58.4 *** 63.7 ***
Adjusted R-Squared 0.1157 0.1290 0.1687
Sample size 3,183 3,176 3,157
Source: ANUpoll, January 2021.
Notes: Linear Regression Model. The base case individual is not employed; male; aged 35 to 44 years; non-
Indigenous; born in Australia; does not speak a language other than English at home; has completed Year
12 but does not have a post-graduate degree; lives in neither an advantaged or disadvantaged suburb
(third quintile); lives in a capital city; and was asked about the age pension first. Coefficients that are
statistically significant at the 1 per cent level of significance are labelled ***; those significant at the 5
per cent level of significance are labelled **, and those significant at the 10 per cent level of significance
are labelled *.
5 Superannuation replacement rate
Another key aspect of the retirement income system in Australia is the replacement rate. That
is, the level of income that retirees receive post-retirement, expressed as a proportion or per
cent of their pre-retirement income. It is assumed, including in the RIR, that this ratio need not
be close to 100 as costs are less once retired. One reason for this is that the earning of an
income in the workforce can entail significant expenses to the individual (transport costs,
materials, additional housing costs of living close to the types of jobs that people take up to
maximise their income). A second reason is more life course related, as retirees are less likely
to have dependents and other consumption tastes may have changed. Finally, and perhaps
17
The ANU Centre for Social Research and MethodsRetirement income during COVID-19
most importantly, those who are post-retirement age do not need to be saving for retirement
and in many cases have already paid all or the majority of the purchase price of their home.
According to the RIR, ‘The suggested benchmark replacement rate is 65-75 per cent’. This
aligns with the existing literature, with Munnell and Soto (2005) suggesting, for example, that
‘middle-class people need between 70 and 75 per cent of their pre-retirement earnings to
maintain their lifestyle once they stop working.’ There is, however, very little information in
Australia as far as the authors have been able to identify on what the general public thinks an
adequate replacement rate should be.
To identify the views of the general public in Australia, respondents to the January 2021
ANUpoll were therefore given the following information about the replacement rate: ‘When
an Australian worker retires, the term replacement rate is used to compare their retirement
income to their working income… The replacement rate is expressed as a per cent: 0% = no
income in retirement; 50% = half their income whilst working, 100% = the same income in
retirement as when working, and 200% = twice their income whilst working.’ They were then
asked ‘What is the replacement rate that you think the retirement income system should aim
to achieve for the average Australian retiree?’ with a minimum of 0 and a maximum of 200.
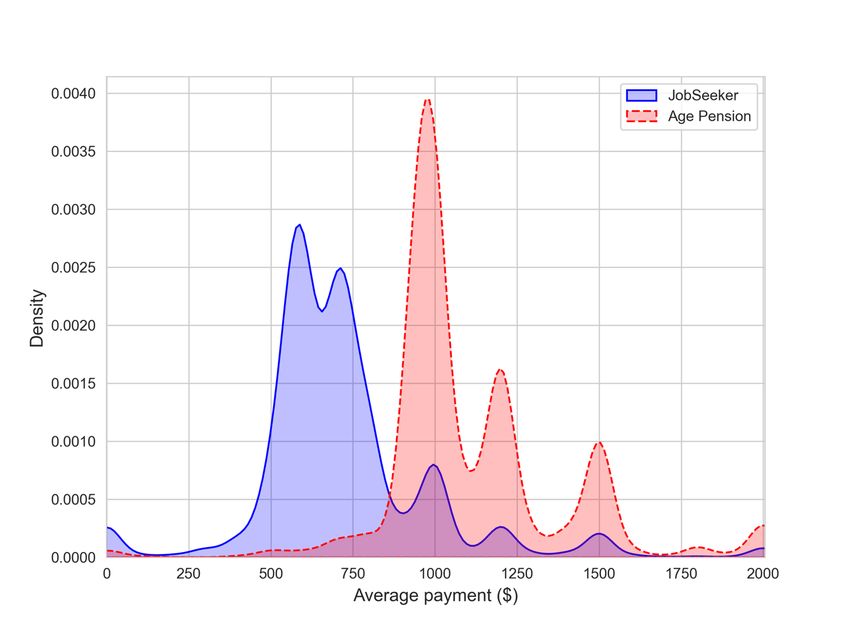
The Australian public, without any prompting, gave a very similar response to the assumption
in the literature, as well as the RIR, with the median response being 70 per cent and the mean
response 70.8 per cent. This could be a reflection of the financial literacy of Australians, many
of whom use financial planners who advise them of their requirements in retirement, as well
as reports like the RIR following (implicitly if not explicitly) community standards. While the
mean and median are close to the assumed value, there is significant divergence across the
population (Figure 3). There are three spikes in the distribution at 50 per cent (29.7 per cent
of respondents); 100 per cent (21.7 per cent of the distribution) and 75 per cent (14.4 per cent
of the distribution).
18
The ANU Centre for Social Research and MethodsRetirement income during COVID-19
Figure 3 Distribution of assumed replacement rate
Source: ANUpoll, January 2021.
Note: Data is unweighted
In order to explore this distribution in desired replacement rate, we estimated a regression
model controlling first for demographic, geographic, and socioeconomic characteristics (Table
5). In this model, females reported a higher preferred replacement rate, whereas older
Australians (aged 65 years and over) and those who were born overseas in an English speaking
country reported a lower replacement rate.
Controlling for the above characteristics (in Model 2), those with higher current household
income reported a lower preferred replacement rate, suggesting in part that Australians focus
on absolute income rather than relative income.
6 Superannuation policy
There are currently two important policy debates related to the Superannuation Guarantee
(SG) pillar of the retirement income system – what the rate of compulsory savings should be
and whether savings should be available pre-retirement for other forms of expenditure.
With regards to the first policy debate, respondents were told ‘The current Superannuation
Guarantee requires employers to pay the equivalent of 9.5% of wages and salaries, not
including overtime. It is currently legislated for the rate to increase to 10% from July 2021 and
then gradually to 12% by July 2025.’ They were then asked ‘Which of the following statements
best describes your views about the Superannuation Guarantee?’
19
The ANU Centre for Social Research and MethodsRetirement income during COVID-19
In answer to this question, only 3.8 per cent of respondents said that ‘The rate should be
decreased to below 9.5% or abolished entirely’. A larger proportion of the population, but still
a minority (20.4 per cent) said that ‘The rate should stay as it currently is (9.5%).’ The modal
response, however, and a clear majority of Australians (55.0 per cent) said ‘The rate should
increase as legislated (to 12% by July 2025)’ with a further minority (20.8 per cent) saying that
‘The rate should be increased beyond 12%’. This does not, of course, necessarily mean that
the rate should be increased as legislated. Public opinion is only one aspect of the decision,
and respondents might give a different answer if they were given more, or different
information. However, the findings from the January 2021 ANUpoll suggest that there is broad
support for the current legislated change.
With regards to the second policy debate, use of superannuation for other financial needs
before retirement, respondents were asked about their own hypothetical behaviour, rather
than their support for any policy change. Specifically, respondents were asked ‘If you were able
to access your superannuation early, and could direct some of your superannuation to other
uses, which of the following would you be most likely to do?’.
Leaving aside those who do not have any superannuation savings or who already have access
to superannuation, 52.4 per cent of respondents said they would leave all the savings in their
superannuation. Of the remaining sample who would draw down on their superannuation,
26.9 per cent said they would use some or all of your savings to purchase a home or reduce
their current mortgage(s); 10.2 per cent said they would use some or all of their savings to
meet current living expenses; and 10.5 per cent said they would use some or all of their savings
to make other investments.11
Using a binary probit model and controlling for demographic, geographic and socioeconomic
characteristics only (Table 6), older Australians (aged 55 years and over) were less likely to say
they would access their superannuation early, whereas Indigenous Australians and those born
overseas in a non-English speaking country said they were more likely to.
Using a more complicated multinomial probit model, but still comparing against those who
said they would leave all their savings in superannuation:
• Young Australians (aged 18 to 24 years) and older Australians (aged 55 years and over)
said they would be less likely to use their superannuation for a home purchase, whereas
those born overseas in a non-English speaking country said they would be more likely
to;
• Indigenous Australians, those born overseas in a non-English speaking country, and
those who lived in the most disadvantaged quintile of suburbs said they would be more
likely to use their superannuation to meet current living expenses, whereas those with
a Bachelor degree or those who lived in the most advantaged of suburbs said they
would be less likely to; and
• Younger Australians, those born overseas in a non-English speaking country, those who
speak a language other than English at home and those with a Certificate III/IV said they
11
There is not a strong correlation between views on the superannuation guarantee and views on
superannuation access. Using a simple multinomial probit model, answers to the question on the
superannuation guarantee were not significantly associated with answers about the early use of super (leave
savings in superannuation).
20
The ANU Centre for Social Research and MethodsRetirement income during COVID-19
would be more likely to use their savings to make other investments, whereas older
Australians (aged 55 years and over) said they would be less likely to.
While this is a hypothetical question, we also have information on actual behaviour during the
COVID-19 period, when restrictions on access to early superannuation were relaxed. As part of
a set of ten questions on financial related activities in the previous 12 months, 17.9 per cent
of respondents said that they had drawn on savings for retirement and 13.3 per cent of
respondents said that they had accessed superannuation early.
Using separate binary probit models and controlling for demographic, geographic and
socioeconomic variables only (Model 1, Table 7), young Australians (aged 18 to 24) were less
likely to say they drew on retirement savings, as were those with a Bachelor Degree. Older
Australians, those who speak a language other than English and those in the two most
disadvantaged suburbs were more likely to say they had drawn on retirement savings. Young
Australians (aged 18 to 24 years) and older Australians (Aged 55 years and over) were less likely
to say they had accessed their superannuation early, as were those with a Bachelor Degree or
higher. Those who speak a language other than English were more likely to say they accessed
their superannuation early.
Controlling for these variables and including other financial stress measures (Model 2), the
probability of drawing down on savings was higher for those who: Postponed major purchases;
Received government assistance; Fallen behind paying bills; Spent less on groceries and
essential items; Re-negotiated mortgage or rental payments to pay less; and Cut back on non-
essential services (e.g. children’s extra-curricular activities; gym; haircuts). The probability of
accessing superannuation early was higher for those who: Received government assistance;
Fallen behind paying bills; Spent less on groceries and essential items; and Re-negotiated
mortgage or rental payments to pay less.
There is a strong correlation between the hypothetical question on superannuation behaviour
and people’s actual behaviour during the COVID-19 pandemic. This is true when we extend the
modelling presented in Table 6 (not presented), or when we look at the bivariate relationship.
More specifically, of those who drew upon their superannuation during 2020, 87.8 said they
would make use of early access to superannuation if they were able to, compared to only 41.0
per cent of those who did not access superannuation during 2020. Although the sample sizes
are quite small, of those who did say they accessed superannuation in 2020, 42.3 per cent said
they would use it for a home purchase, 32.9 per cent said they would use it for living expenses,
and 12.6 per cent said they would use it for other investments.
21
The ANU Centre for Social Research and MethodsYou can also read