Analyzing the Risk of Well Plug Failure after Abandonment
←
→
Page content transcription
If your browser does not render page correctly, please read the page content below
Oil & Gas Science and Technology – Rev. IFP, Vol. 62 (2007), No. 3, pp. 311-324
Copyright © 2007, Institut français du pétrole
DOI: 10.2516/ogst:2007026
                                                                                                                        Dossier
                                                                                          Closure and Abandonment of Oil and Gas Wells
                                                                                         Fermeture et abandon des puits de pétrole et de gaz

                 Analyzing the Risk of Well Plug Failure
                          after Abandonment
                         M. Mainguy*, P. Longuemare, A. Audibert** and E. Lécolier
                    1 Institut français du pétrole, IFP, 1-4, avenue de Bois-Préau, 92852 Rueil-Malmaison Cedex – France
               email: marc.mainguy@total.com - pascal.longuemare@ifp.fr - annie.audibert-hayet@total.com - eric.lecolier@ifp.fr

                                     * Present address: CSTJF, avenue Larribau, 64018 Pau Cedex France
                                  ** Present address: TOTAL, place de la Coupole, 92400 La Défense France

           Resumé — Analyse du risque de rupture de la cimentation des puits après leur abandon — À la fin
           de leur exploitation, les puits de pétrole ou de gaz doivent être obturés au moyen d’une barrière solide
           consolidée. La procédure d’obturation doit assurer l’efficacité de l’étanchéité du puits afin d’éviter, d’une
           part, tout risque environnemental induit par une migration des fluides du gisement vers la surface ou vers
           un aquifère et, d’autre part, des interventions onéreuses sur le système d’obturation. Les travaux publiés
           dans ce domaine portent sur l’analyse du comportement de la barrière solide consolidée (bouchon de
           ciment) soumise à un changement local de la pression ou de la température mais ne considèrent pas
           l’effet des variations de pression, température et de contraintes autour du puits en phase d’exploitation et
           durant le retour progressif à l’équilibre suite à la fin de l’exploitation. Dans ce travail, la perturbation des
           contraintes en place est estimée en utilisant le couplage entre un simulateur de réservoir et un simulateur
           de géomécanique. Ces simulations fournissent l’évolution des variables thermiques, hydrauliques et
           mécaniques dans les roches de couverture qui constituent le lieu de positionnement des bouchons
           d’obturation. Les variations de contraintes sont ensuite utilisées comme données d’entrée d’un modèle
           mécanique pour définir le chargement dans le temps subi par un puits injecteur à l’issue de l’exploitation.
           Ce modèle permet de calculer localement l’évolution des sollicitations au niveau du bouchon de ciment.
           Les résultats obtenus avec le modèle mécanique au niveau du puits pour un ciment conventionnel de type
           Classe G montrent que le risque principal est la rupture en traction. Il est ainsi observé que les matériaux
           d’étanchéité relativement déformables ou initialement pré-contraints apparaissent comme les mieux
           adaptés face à l’évolution des conditions en fond de puits qui peuvent se produire après la fin
           d’exploitation du champ.

           Abstract — Analyzing the risk of well plug failure after abandonment — All oil and gas wells will
           have to be plugged and abandoned at some time. The plugging and abandonment procedure must
           provide an effective isolation of the well fluids all along the well to reduce environmental risks of
           contamination and prevent from costly remedial jobs. Previous works have analyzed the plug
           behavior when submitted to local pressure or thermal changes but no work has looked to the effects
           of external pressure, thermal and stress changes resulting from a global equilibrium restoration in a
           hydrocarbon reservoir once production has stopped. This work estimates those changes after
           abandonment on a reservoir field case using a reservoir simulator in conjunction with a
           geomechanical simulator. Such simulations provide the pressure and thermal changes and the
           maximum effective stress changes in the reservoir cap rock where critical plugs are put in place for
312                            Oil & Gas Science and Technology – Rev. IFP, Vol. 62 (2007), No. 3

           isolating the production intervals. These changes are used as loads in a well bore stress model that
           explicitly models an injector well and predict stress rearrangements in the plug after abandonment.
           Results obtained with the well bore stress model for a conventional class G cement plug show that the
           main risk of failure is tensile failure because of the low tensile strength of the cement. Actually, soft
           sealing materials or initially pre-stressed plug appears to be more adapted to the downhole
           conditions changes that may occurs after well plugging and abandonment.

INTRODUCTION AND METHODOLOGY                                      de-bonding. Several authors have analyzed the risk of the
                                                                  cement sheath failure or de-bonding during the well com-
In the oil and gas industry, most of oil and gas wells drilled    pletion and production phases (see e.g. Thiercelin et al.
for exploration and field production will have to be              1997, Bosma et al. 1999, Philippacopoulos and Berndt
plugged and abandoned at one time. The well plugging and          2001, Ravi et al. 2002) but less work has been concerned
abandonment procedure aims at preventing fluid leakages           with cement plug behavior after abandonment. Akgün and
along the well so that all the fluids will remain perma-          Daemen (1999) have analytically and numerically ana-
nently confined in the separate strata containing them            lyzed the plug behavior when submitted to an axial load
before plugging. To do so, several critical intervals of the      due to water, drilling mud, gas, or backfill pressures. These
well must be plugged from the bottom hole to the surface          authors provide recommendations on the plug length to
with a particular attention being paid to the production          radius ratio to reduce tensile stress in the plug. Bosma et al.
interval (Kelm and Faul, 1999). The sealant material is           (2000) numerically analyzed the thermal expansion of a
often cement-based materials for oil and gas wells but ben-       rubber-based plug that has been installed in bottom-hole
tonite clay is also used for sealing water wells (Calvert and     condition after cooling the well. The plug thermal expan-
Smith, 1994). For oil and gas wells, the cement setting           sion ensures an efficient sealing of the well, but, if not con-
process is of high concern and can fail because of fluid          trolled, may lead to its self-destruction or well damage.
instability at the interface between the cement slurry and        Nevertheless, the previous works assume no pressure, tem-
the drilling fluid below the slurry (Crawshaw and Frigaard,       perature, and stress changes at the plug-rock location after
1999). Moreover, even when the cement is properly placed          plug setting, which may result from external conditions to
and initially provides an effective hydraulic seal for the        the well. This assumption may not hold for plugged wells
reservoir fluids, downhole condition changes after well           located in a field that continues to produce or for plugged
plugging and abandonment may induce damage to the                 wells located in a field for which pressure, thermal, and
zonal isolation and lead to fluids leakage.                       stress state are not in equilibrium at the beginning of aban-
   Because of environmental and cost concerns, operating          donment. This is for instance the case for salt cavern
companies have to pay a large attention to the plugging and       abandonment where the salt creep and the brine thermal
abandonment procedures in order to ensure a “successful           expansion can lead to pressure build-up after cavern aban-
abandonment” of their wells. Improperly abandoned wells           donment (see e.g. Bérest et al., 2001).
can become a significant threat to groundwater quality and            If it is possible to evaluate, by different tests or measure-
marine ecosystems. Furthermore, the cost of a remedial job        ments, the pressure, thermal and stress changes during the
to prevent from well leakage could be dramatic for offshore       reservoir production, we have no idea of those changes
wells. Consequently, plugging and abandonment operations          around reservoir wells after reservoir abandonment. Because
require a careful attention and to adapt the sealant material     it seems difficult to measure those changes after abandon-
to the well downhole conditions. The choice of the best           ment, this work aims first at forecasting such changes on a
sealing material used for well plugging is not obvious and        realistic field case using reservoir and geomechanical mod-
operating companies work on new cement formulations               els. The second objective of this work is to analyze the plug
with high performance ensuring zonal isolation during the         behavior when submitted to the downhole condition
entire life of the well. Actually, high compressive cements       changes resulting from reservoir abandonment. This will
are not always the best solution and the mechanical proper-       make possible to analyze the plug behavior during
ties of the sealing material must be adapted to the well          abandonment and therefore to see if conventional cement
downhole condition changes after permanent plugging.              materials can withstand the load resulting from reservoir
   From the mechanical point of view, the plug sealing            equilibrium restoration after abandonment. In order to reach
capacity loss is related to cement failure or cement-rock         these goals, a new multi-scale approach has been developed.
M Mainguy et al. / Analyzing the Risk of Well Plug Failure after Abandonment 313
This multi-scale approach is based on the successive use of 1 DOWNWHOLE CHANGES AFTER RESERVOIR
three distinct models at different scales as sketched on ABANDONMENT
Figure 1. The scales of the reservoir and geomechanical
models are respectively of 1 kilometer and 10 kilometers, Reservoir production induces down-hole condition changes
whereas the scale of the well bore stress model used for the such as pressure, thermal and total stress changes. Those
local analysis is of ten meters. First, a reservoir model is changes will occur after the end of reservoir production and
built to simulate the thermal and hydraulic changes during well abandonment until an equilibrium is reach at down-hole
the reservoir production. Then, the reservoir simulation is conditions. However, down-hole condition changes that
extended over several periods of time until pressure and occur after well plugging may lead to a reduction of the plug
thermal restorations occur in the reservoir. This extension sealing capacity because of plug failure or cement-rock de-
in time of the reservoir model forms the reservoir model for bonding. Therefore, it is of high concern to estimate the pres-
sure, thermal and stress changes that will develop in the
abandonment. Second, a geomechanical model is built in
reservoir after abandonment. Such changes are case depen-
association with the reservoir model. This model is an
dent and have been estimated using coupled reservoir-geo-
enlargement of the reservoir domain with constitutive laws
mechanics simulations on a reservoir case study built from
affected to the different rocks. The geomechanical model
real field data (see Mainguy et al., 2005).
receives the thermal and pressure loads from the reservoir
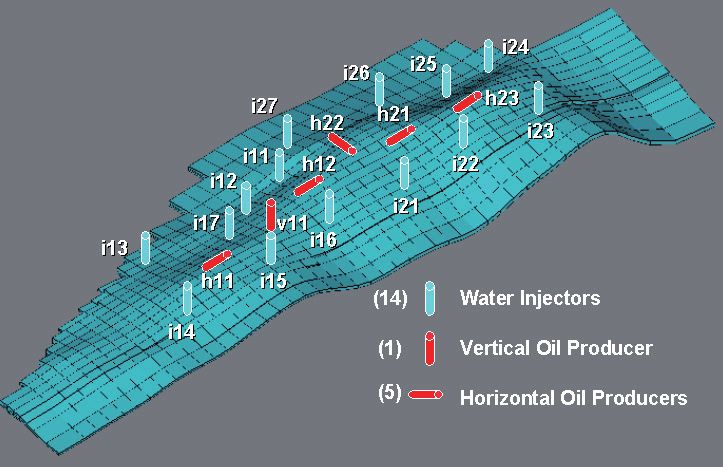
Figure 2 displays the well pattern of the reservoir model
model, making possible to forecast the stress history in the
used by Mainguy et al. (2005) for simulating reservoir pro-
reservoir during production and abandonment. Then, when
duction and abandonment. The reservoir model gives the
selecting the geomechanical cells where the reservoir wells
pressure and thermal changes during 20 years of production
are located, it is possible to derive the loads (boundary con-
and the reservoir simulation has been extended over
ditions) that apply to the plugged wells during abandon- 400 years to analyze the pressure and thermal restorations
ment. Section 2 of this paper presents the results of the after the end of production. Reservoir production leads to a
reservoir and geomechanical models and the maximum high pressure drop in the reservoir during the first 3 years of
loads that apply to a reservoir cell where a water injector is production followed with Enhanced Oil Recovery due to
located (combination of hydraulic and thermal loads due to cold water injection. The pressure decrease is slightly uni-
cold water injection). Third, a local well bore stress model form in the reservoir whereas the thermal decrease is mainly
is built (see Section 3) to evaluate how the loads resulting located around water injectors. After abandonment, reservoir
from reservoir abandonment (pore pressure and temperature re-pressurization is due to an active aquifer located beneath
restoration) can affect the long term plug behavior. Finally, the reservoir. We assume a partial re-pressurization of the
Sections 4 and 5 use the local well bore stress model to ana- reservoir compared to the initial over-pressurized state and a
lyze the long term behavior of a standard class G cement full recovery of initial temperature. The reservoir re-pressur-
plug and the influence of the material thermo-elastic prop- ization is achieved after 130 years of abandonment whereas
erties on the mechanical integrity of the plug. the thermal recovery approximately takes 400 years.
Well bore stress model
Reservoir model
Size ~ 10 m
Size ~ 1 km
Size ~10 km
Geomechanical model
Figure 1 Figure 2
Multiscale approach. Well distribution of the thermal and fluid flow model.314 Oil & Gas Science and Technology – Rev. IFP, Vol. 62 (2007), No. 3
Besides, reservoir seal is generally not included in reservoir 0m
models. However, operators recommend settling at least one
Overburden 1
plug over the reservoir in the reservoir cap. The reservoir
model is made of 3 reservoir layers and 2 cap rock layers. -1500 m
The fluid flow and thermal model do not provide any
information on the mechanical behavior of the field during Overburden 2
production and abandonment. Therefore, this model has
-3000 m
been coupled with a stress simulator to predict stress Cap rock (2 layers)
changes during reservoir production and after abandonment. Flank
Reservoir layer 1
Flank
The model not only includes the reservoir and cap rock but Reservoir layer 2
also its containment (over-burden, flanks and base rock as Reservoir layer 3
-4300 m
displayed on Fig. 3). The model is composed of seven dif-
Base rock
ferent regions, called rock-zone (RZ), each RZ having its
own yield criterion and mechanical properties. From the sur- -7300 m
face to the base, the rock-zones are overburden 1 (RZ 1):
overburden 2 (RZ 2); cap rock (RZ 3 composed of 2 layers); Figure 3
reservoir layer 1 (RZ 4); reservoir layer 2 (RZ 5); reservoir Sketch of the domains.
layer 3 (RZ 6); reservoir flanks and base (RZ 7). Region
thicknesses are given by Figure 3. Flanks have been mod-
elled over a lateral extension equal to three times the one of
the reservoir to provide a representative description of the
reservoir containment. production, the reservoir re-pressurization leads to a progres-
All RZ are isotropic materials. RZ 3 to 6 are modelled as sive decompaction of the reservoir with a final permanent
porous media and their mechanical properties are defined vertical displacement of about 50 cm remaining in the first
with regard to their petrophysical properties defined in the reservoir layer. Because the reservoir unloading during the
fluid flow model: cap-rock RZ3 is shale, RZ4 is identified as abandonment phase is associated with elastic strain, the per-
an Adamswiller sandstone, RZ5 is identified as a Berea sand- manent displacement remaining at the end of the abandon-
stone and RZ6 is identified as a Darley Dale sandstone. The ment is associated with plastic strain during the production
materials of the remaining RZ are non-porous materials. period and to the difference between the initial and final pres-
Table 1 gives the elastic properties of all RZ (E = Young’s sures in the reservoir (partial re-pressurization).
modulus, ν = Poisson’s ratio and b = Biot’s coefficient). RZ One well is chosen in order to closely analyze the pres-
3 to 6 have the same thermal expansion coefficient that is sure, thermal and stress changes resulting from reservoir
equal to 1.62·10-5°C-1. RZ 3 to 6 are elastoplastic materials. abandonment. The well under consideration is the vertical
RZ 3 is supposed to be ideally plastic and is modelled with a injector well I21 (see Fig. 2). Figures 4 and 5 display the
Mohr-Coulomb yield criterion (cohesion = 30 MPa, friction temperature and pressure evolutions with time in the 3
angle = 20 degrees and dilatancy angle = 5 degrees). The cells of the reservoir layers and the 2 cells of the cap rock
behaviour of reservoir RZ (i.e. RZ4, RZ5 and RZ6) is simu- layers crossed by vertical injector I21. A large thermal
lated with a modified Cam-Clay model (slope of the critical decrease from 111°C to 42°C occurs during production in
state line = 1, consolidation stress = 36 MPa, and hardening reservoir layers 1 and 2 where cold water is injected. In
parameter = 10 (RZ4), 15 (RZ5), 20 (RZ6)). comparison, the cap rock layer in contact with the reser-
voir undergoes a maximal thermal decrease of 27°C
TABLE 1 whereas the thermal decrease is minimal in the first cap
Rock-zone elastic properties rock layer and the third reservoir layer (about 20°C). Note
that the cooling of these two layers continues after the end
Rock-zone RZ1 RZ2 RZ3 RZ4 RZ5 RZ6 RZ7
of injection because of heat exchanges with cooler cells.
E (GPa) 8 15 10 8 9 10 20 After 50 years, the temperatures of all layers are similar
ν (-) 0.3 0.2 0.3 0.1 0.15 0.2 0.25 with a small difference of 5°C max and all values slowly
tend toward the initial value of 111°C. The three reservoir
b (-) - - 0.6 1 1 1 -
layers behave similarly during production and abandon-
ment: the pressure decrease of 25 MPa during production
The stress simulations show that the reservoir behavior is is followed by a pressure increase up to 35.5 MPa during
first characterized by reservoir compaction due to oil produc- abandonment. The pressure drop of the cap rock layers is
tion. The vertical displacement is about 70 cm at the crest of also significant (20 MPa for the layer in contact with the
the reservoir after 20 years of production. After the end of reservoir and 12 MPa for the other one). The pressureM Mainguy et al. / Analyzing the Risk of Well Plug Failure after Abandonment 315
120 50
100 40
Temperature (°C)
Pressure (MPa)
80 30
Cap Rock 1
Cap Rock 2 Cap Rock 1
Reservoir 1 Cap Rock 2
60 20 Reservoir 1
Reservoir 2 Reservoir 2
Reservoir 3 Reservoir 3
40 10
0 50 100 150 200 250 300 350 400 0 100 200 300 400
Time (Years) Time (Years)
Figure 4 Figure 5
Evolution with time of temperature in reservoir and cap rock Evolution with time of pressure in reservoir and cap rock for
for cells crossed by well I21. cells crossed by well I21.
decrease of the cells located in the two cap rock layers is This effect leads to an increase of the compressive stress dur-
due not only to the pressure decrease in the reservoir but ing abandonment as it can be observed on Figure 6 that dis-
also to the cooling of these cells that leads to additional plays the diagonal components of the effective stress change
pressure decrease. during production (0-20 years) and abandonment (20-400
The stress simulations show that the effective stress years) in the cell crossed by well I21 and located in the cap
changes in the cap rock is mainly governed by two phenom- rock layer in contact with the reservoir. Shear stress varia-
ena that act in opposite manners. On one hand, the pressure tions are negligible compared to the variation of diagonal
decrease in the cap-rock during production tends to increase components. Note that the convention of rock mechanics is
the compressive effective stress. On the other hand, the reser- used so that positive stresses are compressive stresses.
voir compaction during production leads to cap rock bending The second extreme condition is achieved by assuming
downward over the central part of the reservoir (arch effect) that all the pressure change is transmitted to the solid skele-
and then tends to decrease the vertical compressive stress in ton of the cap rock (this is done by considering that the Biot’s
the cap rock due to continuity of vertical displacements. coefficient of the cap rock is equal to 1). In that case, the cap
Stress variation in the cap-rock combines a local effect (pore rock behaves as the reservoir and the compressive stress
pressure variation) and a structural effect (decrease of vertical decreases during abandonment because of the reservoir re-
compressive stress due to reservoir compaction). During pressurization. This can be observed on Figure 7 that displays
abandonment and reservoir re-pressurization, the two phe- the diagonal components of the effective stress in the cell
nomena are still opposed: the pressure increase reduces the crossed by well I21 and located in the cap rock layer in con-
compressive effective stress whereas the reservoir uncom- tact with the reservoir. Shear stress variations are negligible
paction increases the compressive stress in the cap rock. compared to variation of diagonal components.
Because large incertitude exists on the pressure changes in
the cap rock layers (sensitivity to the layer thickness, effect
of the transmissivity between the reservoir and cap rock lay- 2 WELL BORE STRESS MODEL FOR ABANDONMENT
ers, uncertainty on the cap rock petrophysical properties) the
extreme conditions for the plug have been estimated by look- The previous results are based on a large scale analysis of the
ing separately at the two phenomena that drive the effective reservoir and its containment using coarse reservoir and geo-
stress changes in the cap rock. mechanics cells. For instance, at the scale of the reservoir
The first extreme condition is achieved by considering that cell, the well is not explicitly meshed and the difference
the cap rock is not affected by pressure changes (this is done between bottom hole pressure and reservoir cell pressure is
by considering a null Biot’s coefficient of the cap rock in the accounted for using a productivity/injectivity index. In the
geomechanical model). Therefore, for that case, the effective same way, the stress changes obtained with the geomechani-
stress change during abandonment is only governed by the cal model cannot be directly used to analyze the local behav-
structural effect associated with the reservoir un-compaction. ior of the plugged well as for instance micro-annuli formation.316 Oil & Gas Science and Technology – Rev. IFP, Vol. 62 (2007), No. 3
S'xx
35 35
S'yy
Effective Stresses (MPa)
Effective Stresses (MPa)
S'zz
25 25
15 15
S'xx
S'yy
S'zz
5 5
0 100 200 300 400 0 100 200 300 400
Time (years) Time (years)
Figure 6 Figure 7
Maximum compressive stress change during abandonment Maximum tensile stress change during abandonment for well
for well I21. I21.
Therefore, the local behavior of the plugged well must be ric axes x or y (8 elements in the plug and 19 elements in the
analyzed using a local well bore stress model that explicitly rock). The remaining 8 elements correspond to the number
models the bore-hole, the plug plus eventually casing and of rotation in the x-y plane.
cemented annulus, and the surrounding rock formation. The rock material is the shale constituting the cap rock of
Actually, in this approach, the thermal changes of the reser- the reservoir. The shale is modeled as an elastic isotropic
voir model and the effective stress changes of the geome- material of thermo-elastic properties given in Table 2. The
chanical model are the input data in the well bore stress plug is supposed to be made of a conventional cement plug
model. By using such a model, it becomes possible to com- material. This choice of material allows us to assess the risk
pute the effective stress changes in the plug and therefore to of plug failure for the most encountered material used for
analyze the risk of plug failure or of cement/rock de-bonding.
In what follows, we present the well bore stress model built
for the injector well I21.
The geometry modeled in the well bore stress model is a Horizontal major effective stress
one-meter thick horizontal section of the cap rock perpen-
dicular to the well axis. This geometry is crossed in its mid-
dle by the well bore. The injector well is modeled as an open
hole well (no casing nor primary cementing) with a well
Horizontal minor effective stress
radius of 10 cm. The well bore model is 10 meters wide in
both horizontal directions. In the present case, a lower hori-
Cap rock
zontal extension would have been sufficient, but this lateral
extension was required to perform additional analysis such
as the influence of heterogeneous distribution of mechanical
properties in the horizontal plane. Last, symmetry considera-
tions on loads and geometry allow us to restrict our model-
ing to one quarter of the well and rock sections in the hori-
zontal direction. Hence, mechanical loading is applied on Cement plug
the lateral, lower and upper boundaries of the well bore
model.
Figure 8 sketches a horizontal section of the well bore
stress model and Figure 9 displays the mesh used to dis-
cretize the plug and the rock in the Finite Element software. Figure 8
The mesh is composed of 27×8×5 elements: 5 elements Sketch of the horizontal boundary conditions and loads in the
along well axis direction and 27 elements along the symmet- well bore stress model for injector well I21.M Mainguy et al. / Analyzing the Risk of Well Plug Failure after Abandonment 317
120
Asymptotic surface
(β = 28.9 deg)
90
q (MPa)
60
Uniaxial compressive
30 strength = 41 MPa
Uniaxial tensile
strength = 5 MPa
0
-40 -20 0 20 40 60 80 100 120
p (MPa)
Figure 9
Figure 10
Well bore mechanical domain and mesh for injector well I21. Hyperbolic yield criterion for the standard class G cement of
Philippacopoulos and Berndt (2001).
well abandonment. The cement material properties are taken tensile strength materials, a tensile cut-off model must be
from Philippacopoulos and Berndt (2001) who characterized used to account for their specific behavior in tension. For that
from a mechanical point of view several plain and fiber rein- reason, the cement failure surface is modeled with an hyper-
forced well cements used for geothermal wells. The cement bolic yield criterion (see Abaqus Analysis user’s manual) that
considered as a reference material in the well bore stress is a continuous combination of a linear Drucker-Prager crite-
model is a standard class G cement with 40% silica flour rion at high confining stress and the maximum stress condi-
mix. Table 2 gives the thermo-elastic properties of the tion of Rankine (tensile cut-off). Note that unlike in the
cement: elastic properties (Young’s modulus and Poisson’s “smeared cracking model” that uses damage elasticity to
ratio) are determined at 200°C and the thermal expansion model the material non linear response at low confining
coefficient is chosen equal to the one of the rock. The last stress, the hyperbolic yield criterion models the whole non
section of the paper presents sensitivity tests with respect to linear behavior of the material with an elasto-plastic theory.
this last parameter. However, because the present analysis focuses on the risk of
plug failure, the failure surface is only used to detect the plug
failure but not to predict the plastic deformation in the plug.
TABLE 2
For the same reason, the material hardening is not accounted
Shale and cement thermo-elastic properties for in the well bore stress model. The cement failure surface
Material Shale Cement is built using the values of the internal friction angle = 29
degrees, uniaxial compressive strength = 41 MPa and uniax-
E (GPa) 10 10
ial tensile strength = 5 MPa given by Philippacopoulos and
ν (-) 0.3 0.18 Berndt (2001). These last two values have been used to fit the
α (°C-1) 1.6·10-5 1.6·10-5 hardening parameter = 94.5 MPa and the hydrostatic tension
strength = 1.9 MPa of the hyperbolic yield criterion. Finally,
Figure 10 displays the hyperbolic yield criterion used in the
A cement failure surface is defined in the well bore model well bore stress model.
in order to detect the possible cement failure. The constitu- Several phases arise during the whole life of the well and
tive model commonly used for oil well cement combines a it is important to take into account the effects of these differ-
“smeared cracking model” for tension with a plasticity model ent phases on the stress rearrangement in the vicinity of the
for compression (see e.g. De Borst and Nauta 1985, Bosma well. This is done in the well bore stress model by consider-
et al. 1999). In the following, the cement yield surface is ing several steps in the modeling as displayed on Figure 11.
characterized with a Drucker-Prager type criterion that is Step 1 provides the initial configuration of the well bore
well suited for frictional materials such as rock, sand and stress model. This configuration models the mechanical equi-
concrete for which the mean stress affects the material yield librium of rock drilled with a circular open hole and sub-
and failure strengths. Because cements are inherently low jected to the initial stress tensor (before reservoir production).318 Oil & Gas Science and Technology – Rev. IFP, Vol. 62 (2007), No. 3
Step 2 applies the thermal and effective stress changes result- after curing and no stress variation during transition between
ing from the 20 years of reservoir production. The thermal liquid to solid states) and also in its solid state at the end of
changes given by the reservoir history in the second cap rock step 4. Step 5 is the main step of the modeling during which
layers (see Fig. 4) are homogeneously applied to the rock. we apply the thermal and effective stress changes resulting
Simultaneously, the maximum effective stress changes (see from abandonment between 20 years and 400 years. The well
Fig. 6 or 7) computed with the stress simulator during pro- bore model is made of the cap rock and the cement plug. The
duction (0-20 years) are applied over the rock boundaries. state of stress in the model at the beginning of step 5 is the
The horizontal major and minor effective stress changes are one at the end of step 3 in the cap rock and an isotropic total
applied to the lateral sides, respectively, of the rock section stress equal to pore pressure (no effective stress) in the
(see Fig. 8) whereas the vertical effective stress changes are cement plug. The thermal changes given by the reservoir his-
applied to the top and bottom rock sections. At the end of tory (see Fig. 4) are homogeneously applied to the rock and
step 2, the hole configuration is deformed such as the penny- the cement plug. Simultaneously, the extreme effective stress
shape displayed on step 3. Then step 4 installs the plug in the changes (see Fig. 6 or 7) computed with the stress simulator
deformed configuration of step 3 assuming that the cement is during abandonment (20-400 years) are applied as loads over
under no internal effective stress (isotropic total stress equal the lateral boundaries of the well bore model. The top and
to pore pressure) after setting (i.e. no shrinkage or expansion bottom boundaries of the cement plug are modeled as free
Step 1: Initial configuration (0 year) : Step 2: Application of load resulting from Step 3: Deformed configuration due to
mechanical equilibrium of the well bore reservoir production (0-20 years) reservoir production (20 years)
submitted to initial in situ stress tensor
Step 4: Setting and solidification of the plug Step 5: Application of load resulting from Step 6: Final configuration (400 years)
in the deformed configuration (20 years) reservoir abandonment (20-400 years)
Figure 11
Main steps modeled in the well bore mechanical model.M Mainguy et al. / Analyzing the Risk of Well Plug Failure after Abandonment 319
boundaries with no total stress change because the bore hole mum effective stress changes highlighted in Section 2. The
pressure is assumed to remain at the hydrostatic pressure dur- plug behavior is first analyzed when the rock domain is
ing abandonment. The model also assumes a constant pore loaded with the maximum compressive stress change dis-
pressure in the cement. Step 5 provides stress and strain in played on Figure 6 and second when the rock domain is
the plug during abandonment and can be used to analyze the loaded with the maximum tensile stress change displayed on
risk of plug failure during this period as sketched on step 6. Figure 7. In order to analyze the risk of plug failure during
De-bonding between rock and cement is expected to hap- abandonment, we display the effective stress changes in the
pen because of their different material properties. Micro- plug in the (p’-q) plane with the hyperbolic yield criterion of
annulus is particularly critical for the well zonal isolation the standard class G cement (see Fig. 10). Because it would
because it creates a path for formation fluids and renders the be difficult to represent stress changes in all the plug, we only
well unsafe (see e.g. Ravi et al. 2002). The modeling of the present the effective stress changes computed at a Gauss
plug-rock de-bonding requires a specific treatment of the point located in the cement plug, closed to the cement/rock
interface to prevent from inter-penetration of the plug and the interface and to the top of the plug and closed to the x = y
rock. Furthermore, various interaction models can be used to plane. Therefore, in the following, the next plots of the effec-
model the behavior of the surfaces when in contact. In what tive stress changes in the plug only display the stress history
follows, we assume that the plug and the rock remain fully at the Gauss point previously defined.
bonded once the plug is sealed. This means that the plug-rock
system could be considered as a single continuum material 3.1 Case of a Maximum Compressive Load
with different mechanical properties for the plug and the
rock. This assumption prevents us from a direct observation The maximum compressive load is obtained with the stress
of possible plug-rock de-bonding with the well bore mechan- simulator by assuming that the cap rock is not affected by the
ical model. However the cement/plug debonding can still be pressure changes. The resulting stress changes computed
predicted by looking at the tensile stresses at the cement-plug with the stress simulator are displayed on Figure 6 and are
interface. characterized with a decrease of the compressive stresses
during production and an increase of the compressive stress
during abandonment. In order to closely look at the load that
3 INTEGRITY OF CEMENT PLUG UNDER MAXIMUM will affect the well after abandonment, Figure 12 displays the
LOADS effective stress changes since the beginning of abandonment
(i.e. at 20 years). This figure shows that the vertical compo-
This section presents the results of the simulation performed nent (S’zz) increases of about 2 MPa during abandonment
with the well bore stress model built for the injector well I21. whereas in the same time the horizontal components (S’xx
The thermal load applied to the rock and the plug is given on and S’yy) increase of 3 to 4 MPa. Figure 13 displays the
Figure 4. The risk of plug failure is analyzed for the maxi- effective stress changes since abandonment in the (p’-q)
4.0 2.0
Effective Stress Changes (MPa)
3.0 1.5
400 years
150 years
q (MPa)
2.0 1.0
100 years
1.0 S'xx 0.5
S'yy
50 years
S'zz
0.0 0.0
0 100 200 300 400 0 1 2 3 4
Time (years) p' (MPa)
Figure 12 Figure 13
Maximum effective stress increase since the beginning of Maximum compressive load in the (p’,q) plane.
abandonment.320 Oil & Gas Science and Technology – Rev. IFP, Vol. 62 (2007), No. 3
6 maximum compressive load computed for the injector well
does not induce a risk of shear failure for a conventional
Stress path in the plug cement plug. This comes from the high compressive strength
Yield Surface of conventional cement materials. For the standard class G
4 cement considered here, the deviatoric stress must exceed
14 MPa to induce the cement shear failure. However, the
q (MPa)
deviatoric stress computed in the plug is far from this value
and would require a deviatoric component of the load path of
2 8 MPa whereas only 1.5 MPa is approximately applied at
400 years (see Fig. 13).
0 3.2 Case of a Maximum Tensile Load
-2 0 2 4
p' (MPa) The maximum tensile load during abandonment is obtained
when the whole pressure change is transmitted to the solid
Figure 14 skeleton of the cap rock. The resulting effective stress
Effective stress path in the plug and comparison with the changes (see Fig. 7) show an increase of the compressive
cement yield surface for the maximum compressive load. stresses during production followed with a decrease during
abandonment. Figure 15 displays the effective stress changes
since the beginning of the abandonment. The compressive
stresses slightly increase between 20 years and 50 years
plane: the deviatoric and mean effective (compressive) because of the warming of the second cap rock layer during
stresses increase from 0 MPa to 1.5 and 3 MPa, respectively. the same period of time (see Fig. 4). Actually, the expected
Figure 14 displays in the (p’,q) plane the stress path in the decrease of the effective stress due to the re-pressurization of
plug together with the cement yield surface. This stress path the cap rock between 20 and 50 years (see Fig. 5) is fully
compensated with the increase of the effective stress that
has to be compared with the load path displayed on figure 13.
results from the thermal increase in the cap rock. After
At 400 years, the deviatoric stress computed in the plug is
50 years, the thermal effect on the effective stress change is
larger than the deviatoric stress applied to the rock whereas minor compared to the pressure effect so that the effective
the mean stress in the plug is lower than the value applied to stress decreases from 50 to 200 years. The effective stress
the rock. The stress path in the plug is entirely located in the changes since abandonment decrease of about 7 MPa for the
elastic region and the plug stress state at 400 years is far from vertical component and 4 MPa for the horizontal compo-
the failure surface of the cement. As a main conclusion, the nents. After 200 years, the slight increase of the effective
2.0 4
400 years
S'xx
Effective Stress Changes (MPa)
0.0 S'yy
3
S'zz
150 years
-2.0
q (MPa)
2
-4.0 100 years
1
-6.0
50 years
-8.0 0
0 100 200 300 400 -6 -4 -2 0 2
Time (years) p' (MPa)
Figure 15 Figure 16
Maximum effective stress decrease since the beginning of Maximum tensile load in the (p’,q) plane.
abandonment.M Mainguy et al. / Analyzing the Risk of Well Plug Failure after Abandonment 321
stresses results from the slow warming of the cap rock (see 6
Fig. 4) whereas there are no pressure change after 200 years
(see Fig. 5). Figure 16 displays the effective stress changes Stress path in the plug
since abandonment in the (p’-q) plane. The load is first char- Yield Surface
acterized with a compressive stress state at 50 years accord- 4
ing to the thermal effect. Then, from 50 years to 200 years,
q (MPa)
the mean effective stress becomes tensile and decreases close
to the value of 5 MPa. In the same time the deviatoric stress
reaches 3 MPa. Last, from 200 to 400 years, the thermal 2
effect induces a slight decrease of the mean tensile stress
together with a slight increase of the deviatoric stress.
Figure 17 displays in the (p’,q) plane the stress path in the
0
plug together with the cement yield surface. On the contrary -2 0 2 4
to the previous results obtained for a compressive load, the p' (MPa)
failure surface is reached at 150 years. This means that the
plug failed at 150 years because it cannot withstand the Figure 17
decrease of the effective stresses applied at the boundaries of Effective stress path in the plug and comparison with the
the rock domain. Note that as for the compressive load, at 100 cement yield surface for the maximum tensile load.
years the deviatoric stress computed in the plug is larger than
the deviatoric stress applied to the rock whereas the mean
stress in the plug is lower (in absolute value) than the value
applied to the rock (see Figs. 16 and 17). Let us also remind performed for the maximum tensile load for which the risk of
that the yield surface displayed on Figure 17 cannot grow plug failure is maximal. The plug elastic properties consid-
because the plastic yielding is not modeled. As a main conclu- ered for the sensitivity analysis are the Young’s modulus, the
sion, the maximum tensile load computed under the assump- Poisson’s ratio and the thermal expansion coefficient. The
tion of a cap rock highly sensitive to the pressure changes car- sensitivity analysis performed on this last parameter allows
ries a high risk of tensile failure of a conventional cement plug us to analyze the effects of the reservoir thermal changes on
(or debonding at the interface). This result mainly arises from the plug stress changes during abandonment. The rock
the null internal effective stress state that exists in the plug mechanical properties are unchanged with respect to the val-
after curing. Therefore, a significant decrease of the compres- ues defined in Section 3. The thermo-elastic properties used
sive stress during abandonment directly induces tensile for the standard cement (see Table 2) are used as reference
stresses in the plug. Consequently a significant tensile strength values in the sensitivity analysis. The variation of each of
of the plug material is necessary to prevent from plug tensile these parameters around its reference value is analyzed inde-
failure. In this case, the cement-based material must be able to pendently of the two other parameters, which means that
withstand a mean tensile stress greater than 2 MPa otherwise when we analyze the effect of one parameter, the two others
it fails. Another way to withstand the tensile load that applies remain fixed. The effect of these changes is analyzed on the
on the plug after abandonment consists in pre-stressing the modification of the stress path in the (p’-q) plane during
plug. The pre-stress could be thermally generated by cooling abandonment at the same Gauss point as defined in Section
the area of plug installation as analyzed in Bosma et al. (2000) 3. Furthermore, we assume that the plug failure properties are
for an elastomeric plug. not modified during the sensitivity analysis and defined as in
Section 3 (see Fig. 10). This assumption appears to be not
realistic because one may expect that the uniaxial compres-
4 SENSITIVITY TESTS ON PLUG PROPERTIES
sive and tensile strengths will change when the elastic prop-
The previous work has analyzed the behavior of a conven- erties of cement change. Actually, this assumption is useful
tional cement plug when loaded with the maximum tensile to perform the sensitivity analysis without having to change
and compressive loads resulting from reservoir abandon- all failure mechanical properties of the plug when each elas-
ment. Especially, it has been shown that conventional cement tic property varies. Therefore, the sensitivity analysis allows
plug could fail under tension after reservoir abandonment. In us to assess the influence of the plug elastic properties on the
order to identify the sealing material properties that will plug stress path during abandonment and if the risk of plug
reduce the risk of plug failure after abandonment, this section failure increases or not. However, we will only detect the
studies how the plug elastic properties could be adapted to failure of standard class G cement, which will not be always
the rock properties and to the thermal and effective stress relevant as mentioned previously with respect to the plug
changes after abandonment. The sensitivity analysis is only elastic properties.322 Oil & Gas Science and Technology – Rev. IFP, Vol. 62 (2007), No. 3
6 6
S'xx
35 Yield Surface 35 Yield Surface
S'yy
Effective Stresses (MPa)
= 0.10
Effective Stresses (MPa)
S'zz E = 2 GPa
ν = 0.18
4 E = 4 GPa 4 ν = 0.30
25 25
E = 10 GPa ν = 0.49
q (MPa)
q (MPa)
E = 20 GPa
15
2 2
15
S'xx
S'yy
S'zz
5 5
00 100 200 300 400 00 100 200
-2 0 2 4 -2 0 2 300 400
4
Time (years) Time (years)
p' (MPa) p' (MPa)
Figure 18 Figure 19
Effect of plug Young’s modulus on the effective stress path Effect of plug Poisson’s ratio on the effective stress path in
in the plug. the plug.
4.1 Effect of Young’s Modulus ν = 0.49). Actually, additional tests have shown that the
effect of the Poisson’s ratio is more relevant when the plug is
Figure 18 displays, in the (p’,q) plane, the stress path since loaded with the maximum compressive load.
abandonment in the plug computed with the well bore stress
model using different values of the plug Young’s modulus
4.3 Effect of Thermal Expansion Coefficient
(i.e. 2 GPa, 4 GPa, 10 GPa, and 20 GPa). The reference value
of the plug Young’s modulus is 10 GPa, for which tensile Figure 20 displays, in the (p’,q) plane, the stress path since
failure occurs at 150 years. Figure 18 shows that the devia- abandonment in the plug computed with the well bore stress
toric stress in the plug increases with the plug Young’s mod- model using different values of thermal expansion coefficient
ulus. Therefore, a higher value of the plug Young’s modulus (i.e. 1·10-6°C-1, 1.6·10-5°C-1, 3·10-5°C-1, and 5·10-5°C-1). Let
raises the risk of plug failure. On the contrary, the risk of fail- us remind that the rock and plug temperatures increase of
ure is reduced for a plug with lower Young’s modulus. This approximately 23°C between 20 years and 400 years (see
is due to the fact that soft sealing material can be more easily
deformed so that the mean effective stress is reduced (in
absolute value) in the plug. Therefore, sealing materials with
low Young’s modulus appear to be more suitable for aban-
6
donment. Nevertheless, one has to remind that the failure sur-
Yield Surface
face used in this sensitivity analysis has not been changed in α = 1. E-6 1/°C
order to agree with the elastic properties. Then, the difficulty α = 1.6 E-5 1/°C
comes from the fact that we must look for a plugging mater- 4 α = 3. E-5 1/°C
ial with low Young’s modulus but also, at the same time, α = 5. E-5 1/°C
q (MPa)
with significant tensile strength.
4.2 Effect of Poisson’s Ratio 2
Figure 19 displays, in the (p’,q) plane, the stress path since
abandonment in the plug computed with the well bore stress
model using different values of the Poisson’s ratio (i.e. 0.10, 0
-2 0 2 4
0.18, 0.30, and 0.49). This figure shows that the plug
p' (MPa)
Poisson’s ratio does not significantly affect the plug stress
path during abandonment. Indeed, the stress path remains Figure 20
unchanged for Poisson’s ratio equal to 0.10, 0.18 and 0.30 Effect of plug thermal expansion coefficient on the effective
and only a slight change exists for a high Poisson’s ratio (i.e. stress path in the plug.M Mainguy et al. / Analyzing the Risk of Well Plug Failure after Abandonment 323
Fig. 4). Figure 20 shows that the thermal expansion coeffi- A well bore stress model is built in the second part of the
cient greatly affects the stress paths in the plug: paper to analyze how the pressure, thermal and stress change
— For a plug thermal expansion coefficient lower than that affect the long term durability of the sealing materials used to
of the rock, the risk of plug failure increases because the plug the well. The well bore stress model explicitly depicts
rock expands more than the plug. Therefore, as the the well geometry and accounts for the stress history before
plug/rock interface is supposed to be fully bounded, the plug setting. The behavior of a conventional class G cement
rock expansion triggers tensile thermal stresses in the plug is analyzed when loaded with the thermal and the maxi-
plug. This effect can be observed at 50 years on Figure 20: mum compressive or tensile effective stress changes coming
the stress state is slightly compressive for the plug with from the reservoir and geomechanical simulations. Results
the reference thermal expansion coefficient whereas it obtained for the case at hand show that tensile failure occurs
becomes tensile for the plug with the low thermal expan- when the plug is loaded with the maximum tensile effective
sion coefficient. Therefore, for the case at hand, low ther- stress change whereas no failure happen for the maximum
mal expansion coefficients increase the risk of tensile fail- compressive stress change. This is due to the low tensile
ure in the plug. strength of the cement in contrast with its higher compressive
— For a plug with higher thermal expansion coefficient than strength that prevents from shear or compressive failures.
the rock one, the reverse phenomenon takes place. The The sensitivity tests performed at the end of the paper
higher thermal expansion of the plug than the rock one demonstrate that soft sealing materials or initially (thermally)
generates compressive thermal stresses in the plug. pre-stressed cementitious plugs appear to be more adapted to
Therefore the plug tensile failure can be avoided when the the downhole condition changes that may occurs after well
plug thermal expansion coefficient reaches about twice the plugging and abandonment. Further works need to be per-
rock thermal expansion coefficient. Furthermore, for a formed on the well bore stress model to account for the initial
higher thermal expansion coefficient, the thermal stresses stress state that develops in the plug during and after curing.
in the plug completely cover the extreme load applied at The risk of debonding at the cement/rock interface must also
the boundaries of the well bore stress domain so that the be closely analyzed in future studies because it will largely
plug stress state remains compressive (see Fig. 20). reduce the plug sealing capacity.
CONCLUSION ACKNOWLEDGEMENTS
The sealing materials used for well plugging and abandon- This work corresponds to the first phase of the JIP WAOE on
ment must be adapted to the downhole condition changes Well AbandOnmEnt that begun in January 2003. IFP thanks
that take place after well abandonment. Actually, if the plug ConocoPhillips, ENI E&P Division, Petrobras, Statoil, and
wells are located in a field for which pressure, thermal, and Total E&P for their financial support and for authorizing IFP
stress state are not in equilibrium at the beginning of aban- to publish this work. The authors acknowledge C. Richard
donment, the downhole condition changes during abandon- De Miranda from Petrobras, P. Brossollet, D.
ment can lead to plug failure or micro-annulus formation Fourmaintraux, B. Fraboulet and A. Onaisi from Total E&P,
inducing fluid leakage along the well. Therefore this work N. Moroni from ENI E&P Division, N. Nodland from Statoil
estimates the pressure, thermal and stress changes after reser- and E. Steinar from ConocoPhillips for their active participa-
voir abandonment for a realistic reservoir field case. The tion to this research program.
pressure and thermal changes come from a reservoir model
that has been extended over a long period of time to analyze
the fluid and thermal equilibrium restoration after the end of REFERENCES
production. The effective stress changes during production
and abandonment result from a geomechanical model that Akgün, H. and Daemen, J.J.K (1999) Design implications of analyt-
uses the thermal and pressure changes of the reservoir model ical and laboratory studies of permanent abandonment plugs. Can.
Geotech. J., 36, 21-38.
as loading. A particular attention has been paid to the effec-
Bérest P., Bergues J., Brouard B., Durup J.G. and Guerber B.
tive stress change in the cap rock overlaying the reservoir and (2001) A salt-cavern abandonment test. Int. J. Rock Mech. Min.,
where critical plugs are installed. It is shown that the effec- 38, 343-355.
tive stress changes in this area are governed either by the De Borst, R. and Nauta, P. (1985) Non-orthogonal cracks in a
pressure increase during abandonment either by the compres- smeared finite element model. Eng. Computation., 2, 35-46.
sive stress increase due to reservoir uncompaction during Bosma, M., Cornelissen, E.K. and Schwing, A. (2000) Improved
abandonment. In the first case, the effective stress change experimental characterisation of cement/rubber zonal isolation
materials. Proc. SPE international oil and gas conference and exhi-
since abandonment is characterized by a maximum tensile bition, Beijing, China, 7-10 November 2000.
stress change whereas, in the second case, a maximum com- Bosma, M., Ravi, K., van Driel, W. and Schreppers, G.J. (1999)
pressive stress change is highlighted. Design approach to sealant selection for the life of the well. Proc.324 Oil & Gas Science and Technology – Rev. IFP, Vol. 62 (2007), No. 3
SPE annual technical conference and exhibition, Houston, Texas, 3- Mainguy, M., Longuemare, P. and Wozniak, J.-M. (2005) Coupled
6 October 1999. reservoir and geomechanics simulations to assess the risk of well
Calvert, D.G. and Smith, D.K. (1994) Issues and techniques of plug- plug failure after reservoir abandonment, Proceedings of the Third
ging and abandonment of oil and gas wells. Proc. SPE annual techni- Biot Conference on Poromechanics, Norman, Oklahoma, 2005,
cal conference and exhibition, New Orleans, 25-28 September 1994. Edited by: Y.N. Abousleiman, A.H.-D. Cheng, F.-J. Ulm.
Crawshaw, J.P. and Frigaard, I. (1999) Cement Plugs: Stability and Philippacopoulos, A.J. and Berndt, M.L. (2001) Mechanical prop-
Failure by Buoyancy-Driven Mechanism. Paper SPE 56959, erty issues for geothermal well cements. Geotherm. Resour. Council
Offshore Europe Conference, Aberdeen, Scotland, 7-9 September Trans., 25, 119-124.
1999. Ravi, K., Bosma, M. and Gastebled, O. (2002) Safe and economic
Fourmaintraux, D., Bois, A.-P., Franco, C., Fraboulet, B., and gas wells through cement design for life of the well. Proc. SPE gas
Brossollet, P. (2005) Efficient Wellbore Cement Sheath Design technology symposium, Calgary, Alberta, Canada, 30 April - 2 May
Using the SRC (System Response Curve) Method, paper SPE 2002.
94176, SPE Europec/EAGE Annual Conference, Madrid, Spain, 13- Thiercelin, M.J., Dargaud, B., Baret, J.F. and Rodriguez W.J.
16 June 2005. (1997) Cement design based on cement mechanical response. Proc.
Kelm, C.H. and Fall, R.F. (1999) Well abandonment - A “best SPE annual technical conference and exhibition, San Antonio,
practices” approach can reduce environmental risk, Proc. SPE Texas, 5-8 October 1997.
Asia pacific oil and gas conference and exhibition, Jakarta, 20-22
April 1999. Final manuscript received in March 2007
Copyright © 2007 Institut français du pétrole
Permission to make digital or hard copies of part or all of this work for personal or classroom use is granted without fee provided that copies are not made
or distributed for profit or commercial advantage and that copies bear this notice and the full citation on the first page. Copyrights for components of this
work owned by others than IFP must be honored. Abstracting with credit is permitted. To copy otherwise, to republish, to post on servers, or to redistribute
to lists, requires prior specific permission and/or a fee: Request permission from Documentation, Institut français du pétrole, fax. +33 1 47 52 70 78,
or revueogst@ifp.fr.You can also read


