A model and predictions for COVID 19 considering population behavior and vaccination - Nature
←
→
Page content transcription
If your browser does not render page correctly, please read the page content below
www.nature.com/scientificreports
OPEN A model and predictions
for COVID‑19 considering
population behavior
and vaccination
Thomas Usherwood1,2,3, Zachary LaJoie1,2,3 & Vikas Srivastava1,2*
The effect of vaccination coupled with the behavioral response of the population is not well
understood. Our model incorporates two important dynamically varying population behaviors: level
of caution and sense of safety. Level of caution increases with infectious cases, while an increasing
sense of safety with increased vaccination lowers precautions. Our model accurately reproduces the
complete time history of COVID-19 infections for various regions of the United States. We propose
a parameter dI as a direct measure of a population’s caution against an infectious disease that can
be obtained from the infectious cases. The model provides quantitative measures of highest disease
transmission rate, effective transmission rate, and cautionary behavior. We predict future COVID-
19 trends in the United States accounting for vaccine rollout and behavior. Although a high rate of
vaccination is critical to quickly ending the pandemic, a return towards pre-pandemic social behavior
due to increased sense of safety during vaccine deployment can cause an alarming surge in infections.
Our results predict that at the current rate of vaccination, the new infection cases for COVID-19 in the
United States will approach zero by August 2021. This model can be used for other regions and for
future epidemics and pandemics.
Coronavirus Disease 2019 (COVID-19) began as a localized outbreak in Wuhan, China in December 2019 and
quickly spread internationally to become a global pandemic. More than a year later, over 113 million people have
become infected with COVID-19 with more than 2.5 million deaths worldwide1. To combat the spread of this
virus, the Pfizer–BioNTech COVID-19 vaccine was approved in the United Kingdom on December 2, 20202, and
the Pfizer–BioNTech and Moderna vaccines were subsequently approved for emergency use authorization in
the United S tates3. In light of these recent developments, the potential impact of the distribution for COVID-19
vaccines is tremendous. Giving the public, health officials, and government, model-based trend predictions and
additional guidance on effective vaccine distribution and potential problems is critical. In the last year, many
papers have been published on modeling the COVID-19 pandemic4–13. Several modeling studies are based on
differential equation compartment models involving compartments for susceptible, infectious, and recovered
individuals, commonly referred to as SIR models14–19. Introducing additional compartments allows researchers
to study the effect of vaccination and examine how to optimally distribute a vaccine. Matrajt et al.20 used an age-
stratified population to determine the consequence of vaccine effectiveness and population coverage of the vac-
cine to indicate the optimal vaccine allocation. Bubar et al.21 accounted for the possibility of ruling out individuals
with antibodies from receiving the vaccine using a serological test, and added an age-dependent effectiveness
of the vaccine. Effects of vaccination have been examined in past outbreaks such as the 2009 H1N1 Swine Flu
outbreak and the 2014–2016 Ebola e pidemic22–27. These studies have introduced population compartments that
separate the population by their location and give insights into what locations should receive vaccines first28.
A critical aspect of COVID-19 vaccination that remains unexplored is a population’s behavioral changes
during the prolonged period of vaccination. While behavioral responses have not been addressed with respect
to vaccines, efforts have been made to study the effects of non vaccine related behavioral changes for previous
pandemics. These studies vary from the models on the effectiveness of social measures like quarantining and
social distancing29–31 to characterizing the nature of spread of the d
isease32,33. One particular example that was
reasonably effective in modeling behavioral changes during a pandemic was the closed-loop feedback in the
1
School of Engineering, Brown University, Providence, RI 02912, USA. 2Center for Biomedical Engineering, Brown
University, Providence, RI 02912, USA. 3These authors contributed equally: Thomas Usherwood and Zachary
LaJoie. *email: vikas_srivastava@brown.edu
Scientific Reports | (2021) 11:12051 | https://doi.org/10.1038/s41598-021-91514-7 1
Vol.:(0123456789)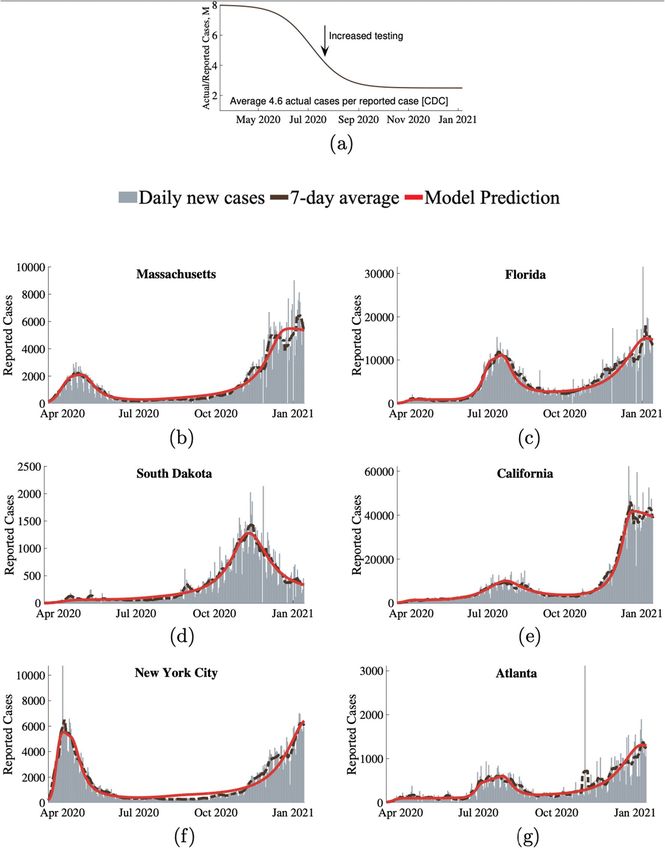
www.nature.com/scientificreports/

                                            compartmental SIR model presented by Perra et al.29. The authors examined behavioral changes by modeling the
                                            rate at which individuals enter self-imposed quarantine dependent on the number of infectious individuals. Over
                                            the last year, the time history of new infected regional cases has fluctuated drastically and has posed significant
                                            challenges for the infectious disease modeling community. A model that can represent the region/population
                                            specific COVID-19 cases accurately for the entire period of this pandemic has not yet been reported. We propose
                                            a mathematical model and a framework that incorporates the naturally occurring behavioral responses of a
                                            population to infectious cases coupled with possible additional behavioral changes exhibited during vaccination
                                            that has the ability to represent infection dynamics for the entirety of available COVID-19 case data in the United
                                            States (US) regions. We define “level of caution” to represent a population’s precautionary/safe behavior during
                                            an ongoing pandemic that results from a combination of increased social distancing, use of personal protection
                                            equipment, improved hygiene, and lockdown regulations. We also introduce “sense of safety” to represent a
                                            population’s return to normal, pre-pandemic behavior as more and more people are vaccinated. We introduce
                                            suitable mathematical forms to represent these two important behavioral aspects and incorporate these dynamic
                                            functions into our differential SIRDV model framework.
                                                Fitting our model to available daily new infection case data for four major US states (Massachusetts, Cali-
                                            fornia, Florida and South Dakota) and two major US cities (Atlanta and New York City) for the first year of
                                            the pandemic, we show that our modeling framework is versatile at capturing a large range of developments of
                                            the COVID-19 pandemic over time, and it provides valuable insights into each population’s underlying social
                                            behavior. Introducing a vaccine to the population in our model, we analyzed the interaction between vaccine
                                            distribution rate and vaccine related additional behavioral responses of the population. We used our model to
                                            predict future trends for the pandemic with the advent of vaccine distribution.

                                            Results
                                            We find that the time dependent infectious disease transmission rate β(t) is best given by β = β0 fI fV , where
                                            β0 is the population maximum infection transmission rate observed in the absence of any preventative societal
                                            measures. fI and fV are level of caution and sense of safety functions, respectively, proposed as:

                                                                                       fI = e−dI I
                                                                                                                                                             (1)

                                                                                             1       1 −dV V
                                                                                       fV = + 1 −         e  .
                                                                                             fI      fI
                                            The function fI models caution in a population, where its individuals take measures to reduce disease transmis-
                                            sion through social distancing, personal protective equipment, hygiene, and local government mandates. The
                                            population’s level of caution to the number of infectious cases is determined by a factor dI , which was observed
                                            to change several times over a long duration in a given population due to changing population awareness and
                                            response, pandemic fatigue, seasons, and changing government mandates. These changes in sensitivity of the
                                            population to the number of infectious cases gives rise to the multiple peaks in the number of new infected cases
                                            observed nearly universally during the COVID-19 pandemic. fI approaches 0 in the limiting case of very high
                                            values of level of caution factor dI , reflecting extreme cautionary measures by the population against the pan-
                                            demic and leads to negligible disease transmission. A dI value approaching 0 gives fI as 1, reflecting a population
                                            whose behavior is approaching pre-pandemic levels of minimal disease related precautionary actions.
                                                In addition, we included a competing sense of safety in our model, in which measures to reduce disease
                                            transmission are gradually decreased due to an increasing proportion of the population becoming vaccinated,
                                            offsetting the effects of a reduced transmission rate arising from an underlying level of caution. However, as
                                            modeled in Eq. (1), the net transmission rate will never exceed the base maximum transmission rate β0. As the
                                            sense of safety factor dV approaches a very small value (population not dropping its guards down due to vaccina-
                                            tions), the sense of safety function fV approaches 1 and fV has no effect on β . On the contrary, a high dV reflects
                                            an increased sense of safety, causing cautionary measures against the disease transmission to be significantly
                                            reduced, leading to fV = f1I . In this case, infection-related level of caution is completely negated and the disease
                                            transmission rate β approaches the population’s highest transmission rate β0.

                                            Infection data fit and interpretation for COVID‑19 in the United States.                   We show that our mod-
                                            eling framework mathematically incorporates the dynamic level of caution within a SIRDV differential frame-
                                            work (shown in Fig. 7, represented by Eq. (2) and discussed in detail in the modeling approach section) is able to
                                            fit and predict the entire COVID-19 case history for the selected representative populations within the US. The
                                            model works for both pre-vaccine and during vaccination periods. Before vaccines become available, the vac-
                                            cinated population fraction V in Eq. (1) stays zero giving fV = 1 and naturally leading to no effects from vaccine
                                            related sense of safety. For conciseness, we show results for selected key populations. The model can be applied
                                            to other regions/populations within or outside of the United States as well. The model was fit to four US states
                                            (Massachusetts, California, Florida, and South Dakota) and two major US cities (New York City and Atlanta).
                                            These regions were chosen to represent a variety of population densities and varying geographical locations. We
                                            accounted for the fact that the reported cases were lower than the actual infection cases in the population due
                                            to lack of testing and asymptomatic cases using a factor M. M has a high value at the beginning of the pandemic
                                            due to lack of testing and reduces to a lower value as testing becomes more available. The simplified M shown in
                                            Fig. 1a is assumed following the Centers for Disease Control and Prevention’s assessment that only 1 out of 4.6
                                            COVID-19 cases were reported in the US for 2020. As shown in Fig. 1, our behavioral model was able to accu-
                                            rately model and fit representative states and cities across the United States with few parameters for each region.
                                            Estimated parameters for each region are shown in Table 1.

          Scientific Reports |   (2021) 11:12051 |               https://doi.org/10.1038/s41598-021-91514-7                                                    2

Vol:.(1234567890)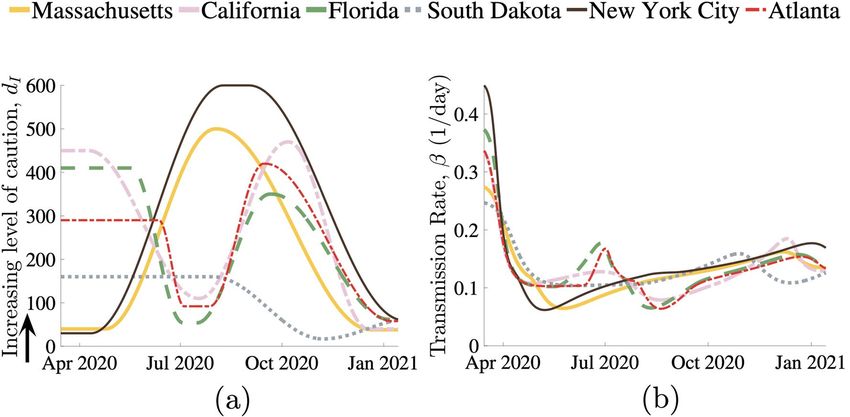
www.nature.com/scientificreports/

                                  Figure 1.  Results of our behavioral model’s fit to COVID-19 data across six populations in the United States.
                                  (a) Shows M representing the ratio of actual infectious cases to reported cases. Reported new infection case
                                  data versus model fit for (b) Massachusetts, (c) Florida, (d) South Dakota, (e) California, (f) New York City,
                                  and (g) Atlanta. Gray bars represent the daily reports of new COVID-19 cases. The dashed brown lines are the
                                  corresponding 7-day average. Our model’s predictions for reported daily cases are shown as the solid red lines.

                                      The level of caution factor dI in Eq. (1) is shown in Fig. 2a for different regions over the first year of the
                                  COVID-19 pandemic. A high level of caution factor indicates that the population was quick to adapt their behav-
                                  ior in response to an increase in infections by taking increasingly stringent measures to reduce their transmission
                                  rate. Level of caution in a specific population changes due to addition or removal of local government regula-
                                  tions, new information regarding the disease, seasonal changes in behavior, pandemic fatigue, news leading to

Scientific Reports |   (2021) 11:12051 |               https://doi.org/10.1038/s41598-021-91514-7                                                   3

                                                                                                                                              Vol.:(0123456789)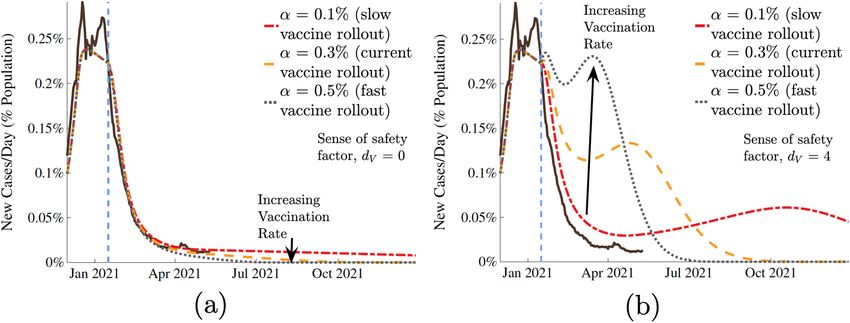
www.nature.com/scientificreports/

                                             Region          µ [%]     1/γ [days]   β0 [1/days]   dI (behavior period)
                                                                                                  40 (March 15–Apr 24)
                                                                                    0.28
                                             Massachusetts                                        500 (Aug 2–Aug 3)
                                                                                    (R0 = 2.8)
                                                                                                  38 (Dec 21–)
                                                                                                  450    (March 15–Apr 9)
                                                                                    0.35          110    (Jul 18–Jul 19)
                                             California
                                                                                    (R0 = 3.5)    470    (Oct 6–Oct 7)
                                                                                                  40    (Dec 18–)
                                                                                                  160 (March 15–Jul 30)
                                                                                    0.25
                                             South Dakota                                         17 (Nov 7–Nov 8)
                                                                                    (R0 = 2.5)
                                                                                                  63 (Jan 26–)
                                                             0.5       10                         410    (March 15–May 17)
                                                                                    0.38          54    (Jul 3–Jul 16)
                                             Florida
                                                                                    (R0 = 3.8)    350    (Sep 20–Sep 22)
                                                                                                  62    (Jan 6–)
                                                                                                  30 (March 15–Apr 11)
                                                                                    0.45
                                             New York City                                        600 (Aug 9–Sep 1)
                                                                                    (R0 = 4.5)
                                                                                                  60 (Jan 19–)
                                                                                                  290   (March 15–Jun 11)
                                                                                    0.35          92    (Jul 4–Jul 27)
                                             Atlanta
                                                                                    (R0 = 3.5)    420   (Sep 14–Sep 15)
                                                                                                  58    (Jan 8–)

                                            Table 1.  Parameters for the four states and two cities for the 2020 COVID-19 pandemic. The initial basic
                                            reproduction number, R0 = βγ0 , represents the expected number of secondary infections if an infectious
                                            individual was placed in the population, without any social preventative measures. dI values represent its
                                            constant value in each of the corresponding behavioral periods. Smooth transitions between constant values of
                                            dI were applied.

                                            Figure 2.  (a) Level of caution factor dI and (b) disease transmission rate β over the course of COVID-19 in six
                                            populations across the United States.

                                            additional fear or any other factor that causes widespread changes in behavior and disease transmission rate. As
                                            expected, the results show that sudden drops in level of caution factor dI tend to precede surges in new cases due
                                            to relaxed social measures. Conversely, a reduction in the influx of new cases will occur due to significant increase
                                            in dI . This level of caution is independent of the baseline maximum transmission rate, β0, and therefore provides
                                            a measure to compare social outlook towards the disease between different populations/regions. Time varying
                                            COVID-19 transmission rate β for each of the selected regions is shown in Fig. 2b. β0 describes transmission in
                                            the earliest stages of the pandemic for a population, when knowledge of the disease and social measures against
                                            it were limited. Therefore, this value also describes the transmission that a specific population can be expected
                                            to return to when the precautions against the infection becomes minimal, either as infectious cases approaches
                                            zero or as social response to the disease becomes very low. In addition to the infectious disease’s inherent con-
                                            tagious characteristics, the base transmission rate depends on factors such as population density, contact rate,
                                            and everyday pre-pandemic behavior of its individuals. Likely due to such factors, we found that bustling New
                                            York City, was on the higher end of the baseline transmission rate with basic reproductive ratio for New York

          Scientific Reports |   (2021) 11:12051 |                   https://doi.org/10.1038/s41598-021-91514-7                                                4

Vol:.(1234567890)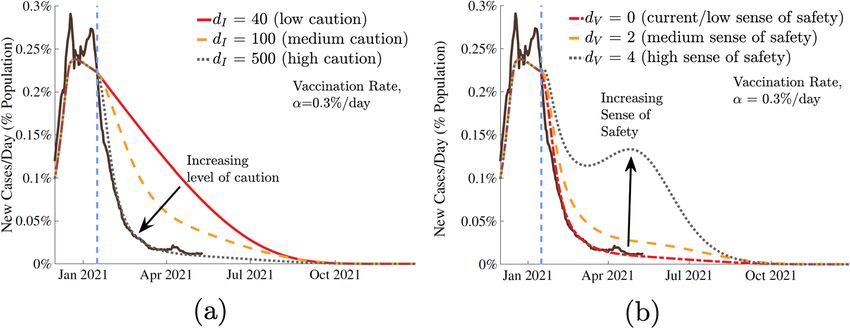
www.nature.com/scientificreports/
Figure 3. Effect of (a) sense of caution factor, dI , and (b) sense of safety factor, dV on pandemic trajectory.
The dashed blue bar represents the introduction of a vaccine with 95% effectiveness, at a fixed rate of 0.3% of
the population per day. Extreme values of dI represent the extremes of social behavior: the most responsive
(black dotted) and the least (red). Sensitivity analysis in (a) considered a fixed sense of safety dV = 0, and in (b)
considered a fixed level of caution dI = 500.
City obtained to be R0 = γβ = 4.5), whereas a less densely populated state like South Dakota has a much lower
baseline transmission rate and a lower R0 value of 2.5. R0 values for other regions can be found from Table 1.
To illustrate direct correlations between our model fit predictions and real life events, we take New York City
as an example. Starting March 22, New York implemented the “New York State on PAUSE’ executive order, closing
all non-essential businesses, canceling all non-essential gatherings, and mandated social distancing. This local
government regulation is directly represented in the model results for level of caution which shows a significant
increase in dI following this mandate (Fig. 2a). Corresponding model results also show a sharp transition from
one of the highest levels of disease transmission rates (Fig. 2b) to one of the lowest levels of transmission rates
following this government mandate. Between September 1, 2020 and January 15, 2021, the model based dI values
show that the level of caution in New York City transitioned from one of the highest values to one of the low-
est. When we examine real events, we find that starting September 2020, a series of citywide re-openings were
introduced, including the opening of gyms, malls (at 50% capacity), public K-12 schools, and indoor dining (25%
occupancy). This reopening coincided with the holiday season in the US at the end of the year 2020 and resulted
in a significant spike in the new infection cases directly correlating with our model predictions. Therefore, the
level of caution parameter dI is a metric that quantifies a population’s behavior in response to an infectious disease
outbreak; estimates of future dI values will allow predictions of new infectious cases. There are clear trends in
COVID-19 cases captured by our model that directly relate to local government mandated health regulations.
These results suggest that we may be able to incorporate possible behavioral changes into our model representing
future government regulations, along with changes in vaccination rates, to predict infection outcomes.
Future COVID‑19 dynamics with vaccination. The model incorporates the effect of vaccination and
the behavioral response of the population to growing number of people getting vaccinated due to the popula-
tion’s sense of safety. This sense of safety counteracts the underlying level of caution that a population always has
in response to the number of infectious cases. Predictions from our model with the presence of vaccination show
that the future trajectory of the pandemic will strongly depend on population’s behavior in response to the dis-
ease and vaccination. In Fig. 3, we show a range of potential infection outcomes for different levels of caution to
the infection and different senses of safety due to vaccination. The selected range of dI and dV represent reason-
able extremes of the level of caution and sense of safety factors. For the future trend predictions, we use starting
values based on California’s data, as a representative population (to avoid multiple curves and repetition) which
has reasonable correlation with overall United States COVID-19 trends. The results, normalized as population
fractions, provide critical COVID-19 future trends and insights that will be applicable to other regions as well.
We have assumed a vaccine effectiveness η of 95% based on the initial estimates of the two leading vaccines34. η
can be suitably selected for any other vaccination types or in the case of a different pandemic or epidemic with
different vaccine effectiveness. The results are shown for estimated actual cases.
Figure 3a models a population that does not alter their underlying behavior in response to introduction of a
vaccine, and instead only responds to the increasing infectious cases by increasing personal safety measures. All
simulated curves show a swift reduction in cases following the vaccine, though decisive action and stronger level
of caution in response to the infection does show a considerable reduction in total infections. Figure 3b shows
a scenario in which the population responds to the introduction of a vaccine by relaxing the social measures
meant to slow the transmission. Although this sense of safety and increased normalcy may be a natural response
to vaccines becoming more available, our predictions show that unfailing and continuing commitment to social
preventative measures can significantly reduce the total number of future infections and even prevent a new
surge and new peak that can happen if the population relaxes too soon. Note, regardless of the value of the sense
Scientific Reports | (2021) 11:12051 | https://doi.org/10.1038/s41598-021-91514-7 5
Vol.:(0123456789)www.nature.com/scientificreports/
Figure 4. Impact of vaccination rate, α, with two social responses to the vaccine. The population in (a) shows
no changes in behavior in response to the vaccine, while the population in (b) relaxes its preventative measures
as the vaccine is distributed.
of safety factor dV , the number of new cases per day drops to zero around the same time; however, the peak
number of cases while progressing toward this point is very different for different dV values.
We treat vaccination as a one-time event where an individual would receive an entire dose of the vaccine,
despite the fact that some current vaccines require two doses that must be delivered at different t imes35. Given
the much longer time scale of COVID-19 predictive curves, compared to the time gap between the two doses of
m-RNA vaccines, it is reasonable to model vaccination rate by ignoring the time gap between the two doses and
take the two doses combined as a single completed vaccine without significant loss of predictive accuracy. Unless
otherwise noted, all vaccine distribution in this paper was modeled at a fixed rate of 0.3% of the population per
day (0.6% receiving single dose of the two dose vaccines per day). This number represents approximately 2 mil-
lion vaccine doses that are currently administered daily in the US. Because of the asymptomatic and unreported
cases, the constant rate vaccination was applied proportionally to both the susceptible ( αs ) and recovered ( αR )
populations. For the remainder of the simulations (after Jan 2021), we assume that sense of caution, dI , remains
fixed at a high level (dI = 500).
The effects of the vaccination rate α were examined (Fig. 4). We chose three values of α: the current rate of
vaccination of 0.3% of the population per d ay36, a low (0.1% per day), and a high rate (0.5% per day). Note, the
vaccination rate of 0.1% is not expected in the US but is shown to illustrate the consequences of low vaccination
rate. As the vaccine distribution rate increases, the number of cases per day tends to zero quickly. However, as is
shown in Fig. 4a,b, the population’s social response to the vaccine, dV , has a significant effect on the pandemic
trajectory. In cases where preventative measures were abandoned more quickly and the population had an
increased sense of safety in response to the vaccines (high values of dV ), increased vaccination rates still result
in cases quickly tending toward zero, but before this happens, the number of cases per day increases rapidly.
This behavior worsens as dV increases, and this sharp increase occurs earlier as vaccination rate α increases. Our
results show that in the US, COVID-19 can be reasonably controlled by late summer of 2021 proceeding with the
currently planned vaccination rate. The results elucidate the importance of local health and government authori-
ties becoming aware of the fact that the sense of safety and vaccine distribution rate are related parameters.
As has been shown, a faster vaccination rate significantly decreases the duration of the pandemic. However, if
authorities intend to distribute a vaccine very quickly, they must be extra cognizant of the population’s behavioral
response to it, as population relaxing its cautious practices could result in a noticeable increase in cases post vac-
cine rollout. If neglected, this peak under extreme circumstances could be disastrous. Therefore, based on our
results, we recommend that proper disease transmission mitigating behavior be maintained, while welcoming
a fast vaccine distribution rate.
To further quantify the relative effects of the sense of safety and the vaccine distribution rate on the total
number of infectious cases, the total number of individuals infected (as population fraction) after the start of
vaccination were plotted with respect to α and dV in Fig. 5. This was done for a special case of a very high level
of caution during vaccine rollout. As expected, for a given value of vaccination rate, the number of total infected
cases increases as the sense of safety factor increases along the x-axis. This behavior is especially pronounced
for low vaccination rates, when large increases in the sense of safety can result in significant numbers of total
infections, up to 26% as is shown in the yellow region of Fig. 5). Also, note that for very high value of dV , as the
vaccination rate increases from 0, the number of infected cases quickly increases and then start to decrease again
(pink box). For a very slow vaccination rate, vaccinated population dependent behavioral effects are limited due
to our proposed relation for the sense of safety function fV , but quickly increase as the vaccinated individu-
als increase. This explains the increase in the total infections as one travels vertically in the pink box in Fig. 5.
However, total infections then begin to decrease due to a critical vaccination rate being achieved, shown in the
teal box. This reinforces the argument for the necessity of maximizing vaccine distribution; low vaccination
rates can lead to behavior-related spikes in total cases, but these effects are mitigated as widespread vaccination
outweighs these behavioral factors.
Scientific Reports | (2021) 11:12051 | https://doi.org/10.1038/s41598-021-91514-7 6
Vol:.(1234567890)www.nature.com/scientificreports/
0.3%
0.18
0.25%
0.1
0.14
0.2%
0.15%
0.1% 22
0.
0.05% 0.18 0.26
0.22
0%
0 0.5 1 1.5 2 2.5 3 3.5 4
Sense of Safety
Figure 5. Contour plot of the sense of normalcy, dV , and vaccination rate, α, versus the total infections since
the start of vaccination (red values shown as proportion of the total population). Shown for a high level of
caution case (dI = 500). The pink box shows a possibility of increasing number of total infected cases with
increasing vaccination rate at very high sense of safety, and the teal box shows that once the vaccination rate
crosses a threshold, the total number of infection cases drop with vaccination rate even at a very high sense of
safety.
0.3%
0.25%
New Cases/Day (% Population)
0.2%
0.15%
0.1%
0.05%
0%
Jul 2020 Jan 2021 Jul 2021 Jan 2022 Jul 2022
Figure 6. Results for certain fractions of the population remaining unvaccinated. The entire COVID-19 case
history and future predictions are shown in terms of estimated actual new infection cases for California as a
representative example. Gray bars represent the daily reports of new COVID-19 cases. The dashed brown lines
are the corresponding 7-day average. Our model predictions for the entire duration are also shown as green,
gray and yellow curves.
We can expect some portion of the population to be unwilling or unable to receive a COVID-19 vaccine.
The effect of the size of this group on the duration and severity of the pandemic was examined in Fig. 6. If large
populations refuse vaccination, the duration of the pandemic can be prolonged.
Methods
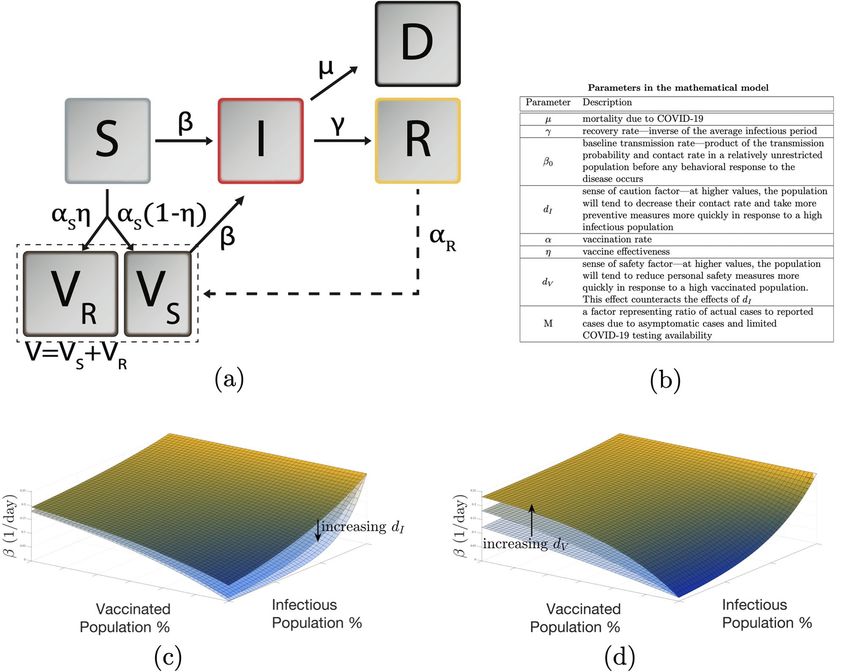
Mathematical model. As shown in Fig. 7a, our model extends the general SIRD framework by adding the
effect of vaccination and incorporating behavior based dynamics as an important capability specific to our study.
The model consists of five compartments: Susceptible (S), Vaccinated (V), Infectious (I), Recovered (R), and
Deceased (D). Here S, V, I, R, and D represent time dependent fractional variables with respect to the total popu-
lation of the region of interest. Beginning in the susceptible compartment, individuals can follow the standard
infection pathway through the infectious compartment then to either recovered or deceased. Alternatively, they
can enter the vaccinated compartment following a fixed rate of vaccination α, where depending on the vaccine
effectiveness η, a subset of the vaccinated population VS can become infected. The remainder of the vaccinated
group VR is successfully vaccinated and have no risk of becoming infected. Currently, the reinfection rate is very
low and its effect can be neglected for the timescale of our study. Note that given the uncertainty in how rapidly
the vaccines will be deployed in the future, for our predictions, we have used constant vaccination rates and have
shown sensitivities to different vaccination rates. Time dependent vaccination rates can be easily implemented
by selecting a suitable function for α(t) in our model. Our SIRDV model for a region/population is described by
the following equations:
Scientific Reports | (2021) 11:12051 | https://doi.org/10.1038/s41598-021-91514-7 7
Vol.:(0123456789)www.nature.com/scientificreports/
Figure 7. (a) SIRDV compartment model with susceptible (S), vaccinated (V), infectious (I), recovered (R),
and deceased (D) populations. Flow between between compartments is shown with arrows. (b) Description
of model parameters. (c) and (d) Show variations in disease transmission rate β, due to social response to
infectious and vaccinated populations. (c) β for a range of level of caution factor dI (100, 200, 400), and (d) β for
a range of sense of safety factor dV (1, 2, 4).
dS
= −βSI − α
dt
dV
= −β(1 − η)VI + α
dt
dR
= γI (2)
dt
dI
= βS + β(1 − η)V − µγ − γ I
dt
dD
= µγ I
dt
where β represents the dynamic transmission rate, µ represents the mortality rate, and γ represents the recovery
rate. The family of curves represented by this set of equations with constant parameters is considerably limited
as it assumes that the population does not change its behavior at all over the course of the outbreak.
The significant differences and variations in disease transmission across different populations and over the
course of the COVID-19 pandemic have shown that an understanding and modeling of dynamic population
behavior changes is critical in predicting a real-world pandemic. To model these population behavioral attributes,
we have incorporated a simple framework for a behavior-based, time-dependent net disease transmission rate β
that is dependent on both the current infectious and vaccinated populations. With β0 as population maximum
transmission rate, fI (0 < fI ≤ 1) level of caution function and fV (1 ≤ fV ≤ f1I ) as sense of safety function, we
propose the following mathematical forms for behavior dependent transmission rate:
Scientific Reports | (2021) 11:12051 | https://doi.org/10.1038/s41598-021-91514-7 8
Vol:.(1234567890)www.nature.com/scientificreports/
fI = e−dI I
1 1 −dV V
fV = + 1 − e (3)
fI fI
β = β0 fI fV
All the model parameters are described in Fig. 7b. The resultant effects of infectious and vaccinated populations
on disease transmission rate β are shown in Fig. 7c,d for a range of dI and dV values. As shown, transmission
rate decays to a smaller value at high infectious populations due to more cautionary and preventive actions with
a higher level of caution. This decay slows significantly as a higher percentage of the population gets vaccinated
due to the sense of safety from vaccination. The sensitivity of β to infectious population size is determined by
the population’s dI , while the extent to which preventative measures are abandoned due to vaccine distribution is
determined by dV . Note, from the mathematical form in Eq. (3), in the absence of vaccines, V = 0 =⇒ fV = 1,
which is physically and intuitively correct.
Model fit to specific regions. Combining Eq. (2) with our dynamic behavior model in Eq. (3), we are able
to fit the complex, multimodal infection curves observed during the course of the COVID-19 pandemic.
We take the disease mortality rate and infectious period, µ and γ (inverse of γ represents infectious period) as
constants. The baseline transmission rate β0 was determined to be the parameter which was able to best fit the first
rise in cases, where there was limited social response to the rise in infections. To represent the behavioral changes
that were evident in the multiple peaks of the pandemic, we introduced multiple behavioral regions for each
population. The model fit shows that each region had different level of caution factors (infection responsiveness)
dI , which provides an estimate of how public perception of the disease varied in each region over the course of the
pandemic. Each behavioral response is represented by a fixed dI and smooth transitions were implemented via
cosine interpolation, as displayed in Fig. 2a. To reduce the risk of overfitting our model, we limited the number
of behavioral response changes for each location and found that, for the locations that were selected, a minimum
of either three or four behavioral regions was sufficient to accurately represent the complete reported infection
data. The differential equation model was implemented in MATLAB.
Model parameters were fit to daily new cases time series of four states and two cities: Massachusetts, Cali-
fornia, Florida, South Dakota, New York City, and Atlanta. These regions were chosen to represent a variety of
population densities, locations across the US, and responses to the pandemic. To determine the parameters, we
used MATLAB’s bound-constrained optimization function37, minimizing the root mean square error between our
model predictions and the reported number of cases per day. Simulations for each population began on March
15 and had an initial infected population equal to the number of new cases in the previous γ1 days, to estimate
those who were still in the infectious period.
The reported infection case data is limited by the fact that tests were not universally available during the
beginning stages of the pandemic. Additionally, certain infected populations did not show any s ymptoms38, but
still may have transmitted the disease, further complicating estimates of new cases. To compare the actual case
predictions from the model against the reported case, we introduced a factor M, which represents the number
of actual cases per reported case. At the early stages of the pandemic, the awareness and testing was lacking but
later on it improved significantly. We account for this by using a value of M = M0 for the initial stages of the
pandemic which transition to a lower value of M = Mf well into the pandemic when testing becomes widely
available. The transition between the two values of M is taken to be smooth using a sigmoidal function and is
shown in Fig. 1a. The variation of M with time can be represented with
M0 − Mf
M = Mf + , (4)
1 + eδM (t−tM )
where δM and tM describe the smooth transition from M0 to Mf .
Disease dynamics with vaccination. After fitting the model to reported real-world data, the effects of
vaccination and its potential effects on behavioral response (sense of safety) were examined. Specifically, we
chose the state of California as a representative case, which displayed an average infectivity rate of COVID-19
among the states and cities that we surveyed and an infection curve that was somewhat representative of the
overall United States. Varying the vaccine distribution rate α, the sense of safety parameter dV , and the fraction
of unvaccinated individuals Sunvaccinated in our model, we evaluated the progression of the disease by examining
the predicted number of cases reported per day in the future. The predicted results are presented in Figs. 3, 4,
5, and 6.
Discussion
We have developed an infectious disease dynamics model which accounts for behavioral changes in a popula-
tion considering level of caution due to growing infectious individuals as well as a counteracting trend towards
increasing normalcy, relaxing precautionary measures due to a sense of safety from increasing vaccine deploy-
ment. Our mathematical model accurately captures the infection trends for the first year of the COVID-19 pan-
demic for all of the US regions examined with a small number of parameters. A comparison of model parameters
between different regions allows comparative insights between them. It demonstrates direct relationships between
population behavior model parameters and major government actions that impact population behavior. It allows
measurement of several important population and infectious disease specific quantities including highest disease
transmission rate β0, disease transmission rate at any given time β , and a measure of population’s behavior to
Scientific Reports | (2021) 11:12051 | https://doi.org/10.1038/s41598-021-91514-7 9
Vol.:(0123456789)www.nature.com/scientificreports/
reduce the disease transmission through parameter dI , where, in the absence of significant vaccination, 100dI
>> 1
indicates safe response, and 100 < 1 represents lack of caution. We found that although faster vaccine rollout
dI
will bring the COVID-19 end more quickly, there exist scenarios where fast vaccine rollout can give false sense
of safety to the population, which will lead to a large short-term increase in infectious cases. This sense of safety
could also cause weakening of restrictions by the local authorities, further exacerbating the pandemic, especially
for areas hit with strains exhibiting lower vaccine efficacy in spite of decent vaccine coverage. We also found that
if a large proportion of the population chooses to stay unvaccinated, this can have an adverse effect on the length
of the pandemic. Prudence is required on the part of authorities to understand, predict, and limit any potential
surge by increasing encouragement of all cautionary measures to prevent the spread of the virus. Our results
indicate that in the United States, COVID-19 can be reasonably controlled by August 2021.
While our model is built on significant physical insights, population’s future behavioral aspects, presence
of asymptomatic cases, a lack of exact knowledge about future vaccination rates, and other factors create some
uncertainties. Therefore, although the quantitative predictions from our study are important, all possible uncer-
tainties should be considered. Due to a reasonable homogeneity of vaccine distribution in the U.S., we have
assumed that the vaccination rate is constant over the period of interest and for each population. It is important
to note that vaccine roll out rate varies from region to region, especially when considering different parts of the
world. In addition, for a specific region, the vaccination rate can vary significantly over a period of time. In this
case, the vaccination rate α can be assumed to be time dependent function in our model. In our predictions, we
have not considered varying efficacies of vaccines against different SARS-COV-2 variants. In the future, as more
data on the efficacy is available, this information can be incorporated in the model based predictions.
The results allow new insights into future COVID-19 trends and sensitivity of pandemic dynamics to various
behavioral and other model parameters. As more exact information becomes available, new data can be directly
incorporated in our model to produce more accurate results. Our study involved a reasonably diverse range of
populations and their responses to the pandemic. The numerical values and ranges for the model parameters
found in this study could be used as estimates to predict potential infection outcomes for scenarios where limited
data is available (e.g., future pandemics). The proposed model provides a new framework for predicting infection
dynamics of future pandemics and epidemics. As model based predictions get increasingly accurate, we expect
that they will help guide informed policy decisions for the general public.
Data availability
COVID data was obtained from the Center for Systems Science and Engineering (CSSE) COVID-19 Data
Repository at Johns Hopkins U niversity39. Estimates for the total population of each region were obtained from
the United States Census Bureau40.
Received: 11 March 2021; Accepted: 27 May 2021
References
1. World Health Organization. WHO Coronavirus Disease (COVID-19) Dashboard (2021).
2. Ledford, H., Cyranoski, D. & Noorden, R. V. The UK has approved a COVID vaccine—Here’s what scientists now want to know.
Nature 588, 205–206 (2020).
3. Commissioner, O. o. t. COVID-19 Vaccines. FDA (2021).
4. Bertozzi, A. L., Franco, E., Mohler, G., Short, M. B. & Sledge, D. The challenges of modeling and forecasting the spread of covid-19.
Proc. Nat. Acad. Sci. 117, 16732–16738 (2020).
5. Estrada, E. Covid-19 and sars-cov-2 modeling the present, looking at the future. Phys. Rep. 869, 1–51 (2020).
6. Giordano, G. et al. Modelling the covid-19 epidemic and implementation of population-wide interventions in Italy. Nat. Med. 26,
855–860 (2020).
7. Kaxiras, E., Neofotistos, G. & Angelaki, E. The first 100 days: Modeling the evolution of the covid-19 pandemic. Chaos Solitons
Fractals138 (2020).
8. Korolev, I. Identification and estimation of the seird epidemic model for covid-19. J. Econ. 220, 63–85 (2021).
9. Tsay, C., Lejarza, F., Stadtherr, M. A. & Baldea, M. Modeling, state estimation, and optimal control for the us covid-19 outbreak.
Sci. Rep. 10, 10711 (2020).
10. Kucharski, A. J. et al. Early dynamics of transmission and control of covid-19: A mathematical modelling study. Lancet. Infect. Dis
20, 553–558 (2020).
11. He, S., Peng, Y. & Sun, K. Seir modeling of the covid-19 and its dynamics. Nonlinear Dyn. 101, 1667–1680 (2020).
12. Prem, K. et al. The effect of control strategies to reduce social mixing on outcomes of the covid-19 epidemic in Wuhan, China: A
modelling study. Lancet Public Health 5, e261–e270 (2020).
13. Kennedy, D. M., Zambrano, G. J., Wang, Y. & Neto, O. P. Modeling the effects of intervention strategies on covid-19 transmission
dynamics. J. Clin. Virol.128 (2020).
14. Roda, W. C., Varughese, M. B., Han, D. & Li, M. Y. Why is it difficult to accurately predict the covid-19 epidemic?. Infect. Dis.
Modell. 5, 271–281 (2020).
15. Liu, M., Thomadsen, R. & Yao, S. Forecasting the spread of covid-19 under different reopening strategies. Sci. Rep. 10, 20367 (2020).
16. Acemoglu, D., Chernozhukov, V., Werning, I. & Whinston, M. D. Optimal targeted lockdowns in a multi-group sir model. Working
Paper 27102, National Bureau of Economic Research (2020).
17. Postnikov, E. B. Estimation of covid-19 dynamics “on a back-of-envelope”: Does the simplest sir model provide quantitative
parameters and predictions?. Chaos Solitons Fractals 135 (2020).
18. Brauer, F. Mathematical epidemiology: Past, present, and future. Infect. Dis. Modell. 2, 113–127 (2017).
19. Kermack, W. O. & McKendrick, A. A contribution to the mathematical theory of epidemics. Proc. R. Soc. A 115, 700–721 (1927).
20. Matrajt, L., Eaton, J., Leung, T. & Brown, E. R. Vaccine optimization for COVID-19: Who to vaccinate first? medRxiv
2020.08.14.20175257 (2020).
21. Bubar, K. M. et al. Model-informed COVID-19 vaccine prioritization strategies by age and serostatus. medRxiv 2020.09.08.20190629
(2020).
Scientific Reports | (2021) 11:12051 | https://doi.org/10.1038/s41598-021-91514-7 10
Vol:.(1234567890)www.nature.com/scientificreports/
22. Feng, Z., Towers, S. & Yang, Y. Modeling the effects of vaccination and treatment on pandemic influenza. AAPS J. 13, 427–437
(2002).
23. Scherer, A. & McLean, A. Mathematical models of vaccination. Br. Med. Bull. 62, 187–199 (2002).
24. Chowell, G., Tariq, A. & Kiskowski, M. Vaccination strategies to control Ebola epidemics in the context of variable household
inaccessibility levels. PLoS Negl. Trop. Dis. 13 (2019).
25. Lee, B. Y., Haidari, L. A. & Lee, M. S. Modelling during an emergency: The 2009 H1N1 influenza pandemic. Clin. Microbiol. Infect.
19, 1014–1022 (2013).
26. Larson, R. C. & Teytelman, A. Modeling the effects of H1N1 influenza vaccine distribution in the United States. Value Health J.
Int. Soc. Pharmacoecon. Outcomes Res. 15, 158–166 (2012).
27. Potluri, R. et al. Impact of prophylactic vaccination strategies on Ebola virus transmission: A modeling analysis. PLoS ONE 15
(2020).
28. Yu, Z. et al. Efficient vaccine distribution based on a hybrid compartmental model. PLoS ONE 11 (2016).
29. Perra, N., Balcan, D., Gonçalves, B. & Vespignani, A. Towards a characterization of behavior-disease models. PLoS ONE6 (2011).
30. Sardar, T., Nadim, S. S., Rana, S. & Chattopadhyay, J. Assessment of lockdown effect in some states and overall India: A predictive
mathematical study on COVID-19 outbreak. Chaos Solitons Fractals 139 (2020).
31. Kim, S., Seo, Y. B. & Jung, E. Prediction of COVID-19 transmission dynamics using a mathematical model considering behavior
changes in Korea. Epidemiol. Health 42 (2020).
32. Sarkar, K., Khajanchi, S. & Nieto, J. J. Modeling and forecasting the COVID-19 pandemic in India. Chaos Solitons Fractals 139
(2020).
33. Reiner, R. C. et al. Modeling COVID-19 scenarios for the United States. Nat. Med. 1–12 (2020).
34. Kim, J. H., Marks, F. & Clemens, J. D. Looking beyond covid-19 vaccine phase 3 trials. Nat. Med. (2021).
35. News, V. K., Kaiser Health. Biden Aims for 100 Million COVID Vaccinations in First 100 Days (2021).
36. Massachusetts Department of Public Health. COVID-19 Vaccination Program Mass.gov (2021).
37. MathWorks. Matlab bound constrained optimization using fminsearch (2021).
38. Nogrady, B. What the data say about asymptomatic COVID infections. Nature 587, 534–535 (2020).
39. Dong, E., Du, H. & Gardner, L. An interactive web-based dashboard to track COVID-19 in real time. Lancet. Infect. Dis 20, 533–534
(2020).
40. Bureau, U. C. County Population Totals 2010–2019 (2019).
Acknowledgements
Authors would like to thank John Antolik and Thomas Bohac for discussions during the early phase.
Author contributions
T.U. and Z.L. performed simulations and helped develop the model. V.S. conceptualized and led the development
of the model. All authors contributed to the writing of the manuscript.
Competing interest
The authors declare no competing interests.
Additional information
Correspondence and requests for materials should be addressed to V.S.
Reprints and permissions information is available at www.nature.com/reprints.
Publisher’s note Springer Nature remains neutral with regard to jurisdictional claims in published maps and
institutional affiliations.
Open Access This article is licensed under a Creative Commons Attribution 4.0 International
License, which permits use, sharing, adaptation, distribution and reproduction in any medium or
format, as long as you give appropriate credit to the original author(s) and the source, provide a link to the
Creative Commons licence, and indicate if changes were made. The images or other third party material in this
article are included in the article’s Creative Commons licence, unless indicated otherwise in a credit line to the
material. If material is not included in the article’s Creative Commons licence and your intended use is not
permitted by statutory regulation or exceeds the permitted use, you will need to obtain permission directly from
the copyright holder. To view a copy of this licence, visit http://creativecommons.org/licenses/by/4.0/.
© The Author(s) 2021
Scientific Reports | (2021) 11:12051 | https://doi.org/10.1038/s41598-021-91514-7 11
Vol.:(0123456789)You can also read


