Demographic assessment of black petrels (Procellaria parkinsoni) on Great Barrier Island (Aotea Island) - MPI
←
→
Page content transcription
If your browser does not render page correctly, please read the page content below
Demographic assessment of
black petrels (Procellaria
parkinsoni) on Great Barrier
Island (Aotea Island)
New Zealand Aquatic Environment and Biodiversity Report No. 244

 J. Zhang,
 E.A. Bell,
 J.O. Roberts

ISSN 1179-6480 (online)
ISBN 978-1-99-002595-2 (online)

August 2020

Requests for further copies should be directed to:

Publications Logistics Officer
Ministry for Primary Industries
PO Box 2526
WELLINGTON 6140

Email: brand@mpi.govt.nz
Telephone: 0800 00 83 33
Facsimile: 04-894 0300

This publication is also available on the Ministry for Primary Industries websites at:
http://www.mpi.govt.nz/news-resources/publications.aspx
http://fs.fish.govt.nz go to Document library/Research reports

© Crown Copyright – Fisheries New Zealand
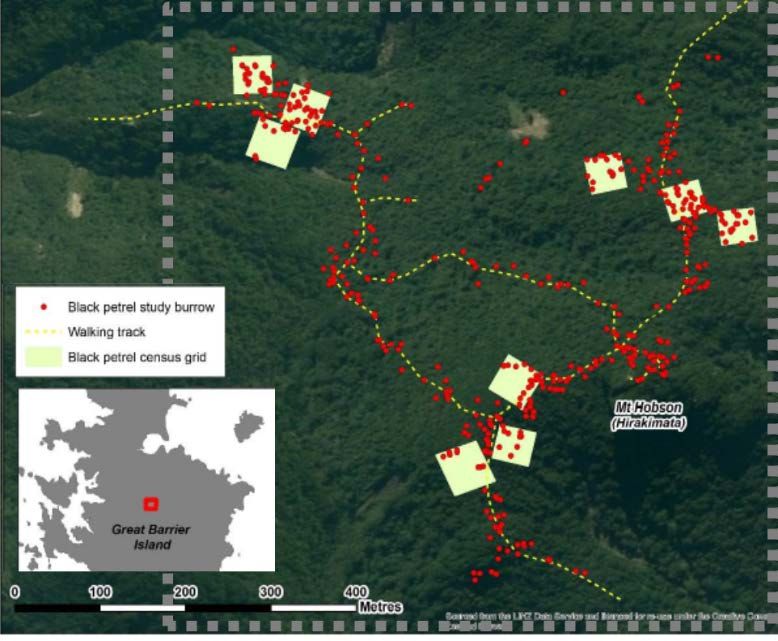
TABLE OF CONTENTS

EXECUTIVE SUMMARY 1
1. INTRODUCTION 2
 1.1 Background 2
 1.2 Demographic assessment 2
2. DATA AND METHODS 3
 2.1 Field-based methods and population estimates 3
 Census grid burrow counts 4
 Transect survey population estimates 4
 Mark-recapture observations 5
 2.2 Demographic assessment methodology 5
 Model structure 5
3. RESULTS 9
 3.1 Field observations and relative population estimates 9
 Census grid burrow counts 9
 Transect survey population estimates 9
 Mark-recapture observations 10
 Age at first breeding of known-age birds 11
 Observations of pre-breeders 12
 Breeding success 13
 3.2 MPD model runs 14
 Model fits 14
 Estimated parameters 14
 Likelihood profile of juvenile survival 19
 3.3 MCMC model runs 20
 Parameter estimates 21
4. DISCUSSION 24
 4.1 Adult survival 24
 4.2 Breeder resighting probability 24
 4.3 Juvenile survival 24
 4.4 Age at first breeding 25
 4.5 Exploration of parsimonious models 25
 4.6 Fits to population size estimates 25
 4.7 Accounting for emigration 25
5. CONCLUSIONS 26
6. ACKNOWLEDGMENTS 26
7. REFERENCES 26
Appendix 1: Census grids count data for 1996 to 2017 28
Appendix 2: Line transect survey data for 2016 30
Appendix 3: MCMC diagnostic plots 32
Appendix 4: SeaBird input files for key models 40
EXECUTIVE SUMMARY

Zhang, J.; Bell, E.A.; Roberts, J.O. (2020). Demographic assessment of black petrels
(Procellaria parkinsoni) at Great Barrier Island (Aotea Island).

New Zealand Aquatic Environment and Biodiversity Report No. 244. 48 p.

The management of incidental fishery-related mortalities to New Zealand seabird species is guided by
a multi-species spatial risk assessment, which has consistently identified takoketai/black petrel
(Procellaria parkinsoni) as the highest risk species. The spatial risk assessment utilises estimates of key
demographic rates for the Great Barrier Island (Aotea Island) population, including recent annual
survival rate and age at first breeding, obtained from demographic assessment models. New
demographic assessment models were developed using updated mark-recapture data and population
estimates from stratified transect surveys.

The previous base case model for this population was updated with new field-based mark recapture
observations and a population size estimate from 2016. Alternative model runs differed with respect to
their parameterisation of pre-breeder survival (i.e., grouped with immature survival, previously grouped
with non-breeders) and recapture probability of breeders (i.e., this model run assumed all were seen,
previously estimated). In addition, a greatly simplified model run ignored observations collected prior
to an individual’s first breeding. All models produced good fits to mark-recapture observations and
adequate fits to line transect population size estimates. Model estimates of adult survival (i.e., of
individuals that have bred) ranged from 0.857 (95% CI = 0.832–0.872) for the simple model to 0.883
(95% CI = 0.872–0.902) for the previous base case model structure. Survival rates for pre-breeders were
not well determined, because the model could not distinguish mortality of this stage from emigration
(i.e., birds born in the study area that did not return to breed there). The model assuming all breeders
were seen produced plausible estimates of annual breeding rate and produced the best model fits to
mark-recapture data (the new base case model), though estimates of adult survival (0.880; 95% CI =
0.871–0.888) and age at first breeding (6.89; 95% CI = 6.59–7.16) were very similar to alternative
models.

A conflict between mark-recapture and line transect data with respect to population trajectory is likely
to be caused by slower population growth in high-quality habitat (where most mark-recapture study
bird burrows are located) relative to low-quality habitat in recent years. Further research could account
for this by either: collecting mark-recapture information in low quality habitat; or re-weighting the
transect data based on the habitat quality of the study burrows from which the mark-recapture data were
collected. Additionally, once there are sufficient observations of mark-recapture study birds breeding
outside the study area, a two-area model could be considered to account for the potentially biasing effect
of emigration on adult survival estimates.

Fisheries New Zealand Demographic assessment of black petrels on the Great Barrier Island • 1
1. INTRODUCTION

1.1 Background

Black petrels or takoketai (Procellaria parkinsoni) are medium-sized (c. 700 g), burrow-nesting
seabirds that breed during the austral summer in colonies located on Great Barrier Island (Aotea Island)
(GBI) and Te Hauturu-o-Toi/Little Barrier Island (LBI) in the Hauraki Gulf, near Auckland, New
Zealand (Figure 1). The breeding season starts in October, when males prepare burrows and try to attract
a mate. Eggs are laid in late November/December, and the peak period for hatching is early February
(the typical incubation period is 57 days). Chick rearing takes about 107 days, with chicks fledging in
late April/May. During the breeding season, adults forage along the shelf break of the north coast of the
North Island and into deeper oceanic waters (Freeman et al. 2010). Outside the breeding season, black
petrels migrate to western waters off Central and South America (Cabezas et al. 2012). Black petrels
forage both on the surface and by making shallow dives to a maximum of 34 m depth (Bell 2016),
preying mostly on squid and occasionally on tunicates, crustaceans, cyclostomes, and fish (Imber 1976).
Breeding seabirds are central-place foragers, meaning that their foraging efforts are restricted in space
by the need to return to their nests (Ropert-Coudert et al. 2004). Black petrels formerly bred on many
forested mainland mountain ranges in the North Island and northwest South Island (Imber 1987). A
relict population totalling about 15 000 birds is now confined to GBI and LBI with most (c. 4500 pairs)
breeding on GBI and c. 620 pairs on Little Barrier (Richard & Abraham 2015, Bell et al. 2016a). The
species is currently listed as Nationally Vulnerable by the New Zealand Threat Classification system
(Robertson et al. 2013).

The population risk of direct fishery-related mortalities on New Zealand seabirds is estimated by a
multi-species spatially-explicit fisheries risk assessment (SEFRA) model. The SEFRA model estimates
species-specific annual deaths and relates them to a population-sustainability threshold (PST) – the
annual number of individuals that can be caught as bycatch without threatening the maintenance of the
population above 50% of carrying capacity with high certainty (Richard et al. 2011, Richard & Abraham
2013, Richard et al. 2015). According to this analysis and the above criterion, black petrels were ranked
as the highest risk seabird species to fishery-related mortality around NZ (Richard & Abraham 2020).

1.2 Demographic assessment

The latest iteration of the seabird risk assessment (Richard & Abraham 2020) utilises a specified adult
survival as a constraint on the total numbers of annual potential fatalities that can occur. That assessment
used a current adult survival of 0.90, estimated by Bell et al. (2011), which used mark-recapture and
population size estimates up to 2010. This was found to constrain adult captures for this species,
markedly reducing the risk ratio posterior (Richard & Abraham 2020). Recent field studies of black
petrels on GBI have estimated a steady increase in numbers since a low point in 2003/04 (hereafter
referred to by the end year, i.e., 2004) (Bell et al. 2016b), suggesting that adult survival may have
increased. Estimates of adult survival from mark-recapture data only using MARK (White & Burnham
1999) are consistent with an increasing trend in adult survival through time (Bell et al. 2016b).

The specific research objective of this study was to update the previous population modelling of black
petrels at GBI to produce an updated population trend and estimate of adult survival. In response, this
study updated the previous base case demographic assessment model for the GBI population with new
mark-recapture observations collected during field seasons from 2015 to 2017 to update the current
adult survival estimate for the seabird risk assessment. In addition, the sensitivity of key demographic
rates was explored in response to new model structures informed by improved understanding of black
petrel behaviour and population dynamics at GBI.

2 • Demographic assessment of black petrels on the Great Barrier Island Fisheries New Zealand
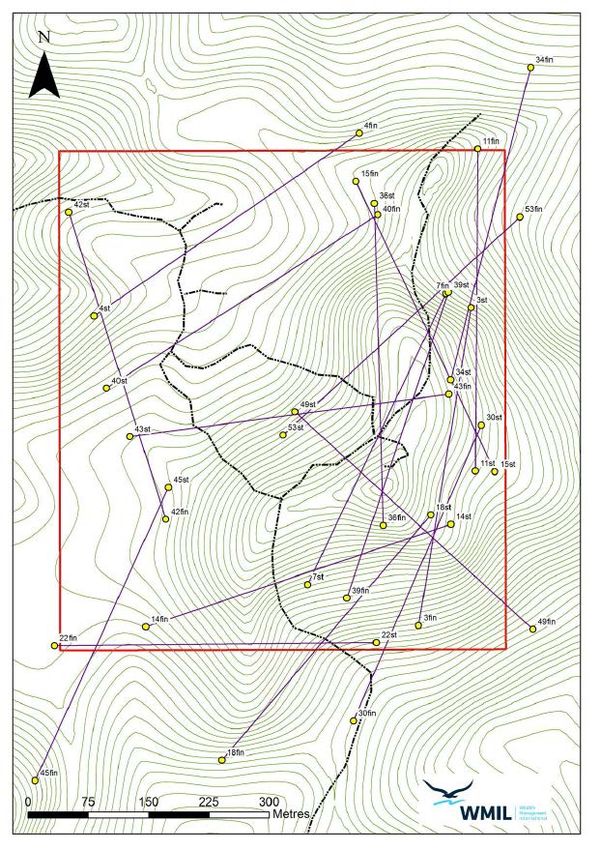
2. DATA AND METHODS

2.1 Field-based methods and population estimates

Field-based mark-recapture observations and population size estimates of black petrels were obtained
from a 35 ha study area around the summit of Mount Hobson (Hirakimata) on GBI and study burrows
located near to a system of walking tracks (see Figure 1) (Bell et al. 2007). Between 1996 and 2001,
field observations were collected during two visits to the study area each year (during egg hatching in
January/February and check fledging in April), and this was extended to three visits each year since
2002 (including a visit during egg laying in the previous December) (see Table 1). During the first visit
(i.e., December), the breeding status of study burrows was checked, and any adults were identified or
banded and returned to the burrow. During the second trip in mid-late January to February, any adults
present were identified or banded and returned to the burrow and the breeding status of study burrows
was confirmed with the presence of eggs, eggshell fragments, or chicks noted, and the absence of this
evidence used to identify non-breeding birds. The study burrows were monitored again in April and all
surviving fledgling chicks were banded. This information was then used to determine the individual
breeding success of banded birds.

Figure 1: The location of the black petrel (Procellaria parkinsoni) study burrows and census grids within
 the study area on Great Barrier Island (Aotea Island) (left) with spatial extent of right-hand plot
 highlighted by grey dashed line; and example of line transect survey random transects and
 habitat grades from the 2010 survey (right). These figures were modified from figure 1 of Bell et
 al. (2016b) and figure 5 of Bell et al. (2011), respectively. A spatial plan of the 2016 line transect
 survey is shown in Appendix 2.

Fisheries New Zealand Demographic assessment of black petrels on the Great Barrier Island • 3
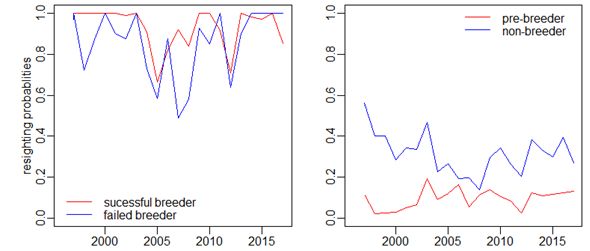
Table 1: The timing of visits to the study area in each breeding season. Note that, for example, the 1995–
 96 season is labelled 1996. In the 2009 season only, the study area was also visited in October to
 check during the pre-mating phase.

 Field seasons Dec (egg laying) Jan/Feb (hatching) Apr (fledging)

 1996 – 2001 No Yes Yes
 2002 – 2017 Yes Yes Yes

Three types of demographic data were made available to the present study:
 1. census grid burrow counts,
 2. transect survey population estimates, and
 3. mark-recapture observations of banded birds (in study burrows).

Census grid burrow counts
Census grid burrow counts are annual counts of all black petrel burrows in nine 40 m x 40 m census
grids within the study area (as shown as yellow squares in Figure 1). The first group of three census
grids was established in 1996, in each of three habitat types that had a historical presence of black
petrels, with different vegetation types and topography, and that were near known launch sites
(Bell et al. 2007). A second census grid was established in each block in 1999, and third added in 2000,
giving nine in all, or three in each of three blocks. The second and third grids were located randomly
within the same habitat areas as the first grid. Their location and extent have remained the same
throughout the study period after being established. In each census year, each known burrow in a grid
was checked and classified as breeding, non-breeding, or empty during the survey trips in December
and again in January (Bell et al. 2016b). Searches through the grids occur annually to determine whether
any new burrows have been created by black petrels (or burrows that may have been missed during
earlier surveys). Census grids were mostly located in high-quality habitat areas and, so, resulting counts
have historically not been incorporated into demographic assessments.

Transect survey population estimates
Stratified line transect surveys of black petrel population size were undertaken in 2005 (Bell et al. 2007),
2010 (Bell et al. 2011), 2013 (Bell et al. 2013) and 2016 (Bell et al. 2018), to estimate black petrel
population size across high-, medium-, and low-grade habitat areas. A total of 26 random transects were
completed in 2005, 2010, and 2013, and 20 were completed in 2016. All transects were surveyed using
the same methods reported by Bell et al. (2007). Breeding burrows were treated as having two resident
birds present and any non‐breeding burrows were treated as having 1.25 birds present (because in any
non‐breeding burrow there is a 25% chance of capturing more than one bird in the burrow when the
resident male attracts a female to that burrow).

The line transects were stratified into four habitat grades along the transect length: high‐grade petrel
habitat (4.67 ha), medium‐grade (15.30 ha), low‐grade (13.56 ha), and non‐petrel habitat (1.75 ha)
(Bell et al. 2013) (see Figure 1). In June 2014, a severe storm event caused significant damage to the
black petrel study area (Bell et al. 2016b). No study burrows were affected, but major slips within the
boundaries of the study site caused a reduction in the spatial extent of suitable breeding habitat.
Consequently, for the 2016 survey, the area of medium‐grade, low‐grade, and non‐petrel habitat was
updated to 14.86 ha, 12.69 ha, and 3.06 ha, respectively. These updated habitat areas were used in the
latest population estimation (i.e., 2016 onwards).

Burrow densities were calculated for each habitat grade within each transect (i.e., there were four means
for each transect). The breeding population for each habitat quality class was estimated as the mean
density across all transects in that habitat grade multiplied by the respective area (Francis & Bell 2010).
Combined estimates across all habitat types were obtained for the four surveys and fitted within
demographic models developed by this study.

4 • Demographic assessment of black petrels on the Great Barrier Island Fisheries New Zealand
Mark-recapture observations
During each visit to the study area, a series of study burrows (see Figure 1) were inspected several times
during three visits in November/December, January/February, and April/May, corresponding with the
early-incubation, late-incubation/early-chick rearing and late-chick rearing phases of the black petrel
breeding season, respectively. During each visit, each study burrow was visited between one and ten
times to determine the breeding status (i.e., breeder or non-breeder) and breeding outcome (i.e.,
successful or unsuccessful) for each burrow, and to record the adult occupants of each burrow so that
breeding status could be attributed to individual band ID. Multiple visits were also required to identify
partner birds and non-breeding birds using burrows. All non–banded birds encountered were banded.

2.2 Demographic assessment methodology

Model structure
All demographic assessment models were developed using NIWA’s SeaBird demographic assessment
software (Francis & Sagar 2012), which provides a flexible modelling platform for trialling variation
in model structure and parameterisation. The starting model structure for this assessment (Model 1,
“previous base”) was the same as the black petrel model of Francis and Bell (2010), referred to as
BPET7, updated by Bell et al. (2014) (both also developed using SeaBird). Model run 1 (previous base
model) partitioned the population into 15 states (Table 2) and estimated 18 parameters (Table 3),
including 9 states and 4 transition probabilities (Table 4). Some of these parameters were year-varying.
Briefly, Model 1 estimated:

 • Separate annual survival probabilities of juveniles, non-breeders (which include some pre-
 breeders) and breeders (non-breeder and breeder survival probabilities were also combined for
 reporting purposes and referred to as adult survival);
 • Annual breeding probabilities that were constant with respect to year, with separate estimates
 contingent on breeding status in the previous year;
 • Age at first breeding, also constant with respect to year;
 • Separate annual resighting probabilities for different states, that were allowed to vary by year;
 and
 • The breeding population size in 1996, i.e., the first year of mark-recapture data collection.

Table 2: The 15 states in the partition of the population model (in each year every modelled bird is in exactly
 one of these states).

 State
 State label number Description

 chick 1 Fledgling chicks in the season of their birth
 age 1 – age 9 2 – 10 Juveniles aged 1–9 that have not returned to the breeding area*
 pbr 11 Pre-breeders: juveniles which have appeared in the study area but have not yet
 bred
 nbr 12 Adults (birds that have previously bred) in the study area which did not breed in
 the current year
 fbr 13 Adults that bred unsuccessfully in the study area in the current year
 sbr 14 Adults that bred successfully in the study area in the current year
 oth 15 Adults breeding outside the study area

* In this study “juvenile” is used to identify all individuals that have not yet returned to the study area, though
 Bell et al. (2016b) specifies juveniles to be all individuals age 1–4 (i.e. prior to first breeding by an individual).

Fisheries New Zealand Demographic assessment of black petrels on the Great Barrier Island • 5
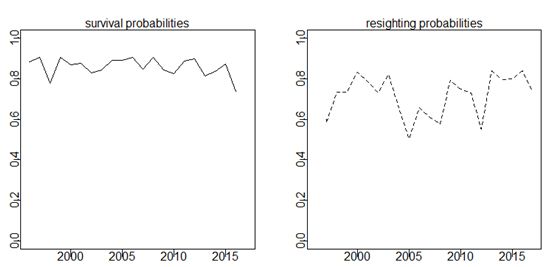
Table 3: Estimated parameters of Model 1. Resighting probabilities were assumed to be zero for juveniles
 and for adults in state oth. Most parameters were treated as year-invariant, but annual values
 were estimated for all resighting parameters as well as those for adult survival (nbrsurv, brsurv),
 except that survival rates for the last year (which are confounded with the resighting rates for the
 same year) were assumed equal to those for the previous year. Details of how each component of
 the transition matrix was calculated from the model parameters are given by Francis & Bell
 (2010).

 Parameter Description

 N0 Initial (1996) size of the adult population in the study area
 P1stapp6 Probability a bird first appears as an adult in a breeding colony at age 6, given
 that it survives to that age
 oddsmult The slope of linear relation between logit(P1stappa) and age a
 Pappstd Probability, for a chick, banded in the study area and surviving, that its first
 appearance in a breeding colony be within the study area
 Pbr1st Probability, for a chick that survives to breed, that it will breed in the first year
 it appears in a breeding colony as an adult (i.e., it is never a pre-breeder)
 Pbrstd Probability, for a pre-breeder in the study area that survives to breed, that
 breeding will happen in the study area
 Tpbrbr/Tnbrbr/Tfbrbr/Tsbrbr The probability that a pre-breeder, non-breeder, failed breeder, or successful
 breeder in the study area in one year will breed the next year, given that it
 survives
 Psuccess The probability that a bird that breeds is successful (produces a fledgling)
 jursurv/nbrsurv/brsurv Annual probability of survival for juveniles and pre-breeders, non- breeders, or
 breeders
 Prpbr/Prnbr/Prfbr/Prsbr The probability of resighting a pre-breeder, non-breeder, failed breeder, or
 successful breeder

Table 4: Transition matrix for model 1.

 chick age1 age2 age3 age4 ... age9 pbr nbr fbr sbr oth

 chick 0 1 0 0 0 ... 0 0 0 0 0 0
 age1 0 0 1 0 0 ... 0 0 0 0 0 0
 age2 0 0 0 1 0 ... 0 0 0 0 0 0
 age3 0 0 0 0 Pjv4 ... 0 Pbr4 0 Pfbr4 Psbr4 Poth4
 ... ... ... ... ... ... ... ... ... ... ... ... ...
 age8 0 0 0 0 0 ... Pjv9 Ppbr9 0 Pfbr9 Psbr9 Poth9
 age9 0 0 0 0 0 ... 0 0 0 Pfbr10 Psbr10 Poth10
 pbr 0 0 0 0 0 ... 0 Tprbpbr 0 Tpbrfbr Tpbrsbr Tpbroth
 nbr 0 0 0 0 0 ... 0 0 Tnbrnbr Tnbrfbr Tnbrsbr 0
 fbr 0 0 0 0 0 ... 0 0 Tfbrnbr Tfbrfbr Tfbrsbr 0
 sbr 0 0 0 0 0 ... 0 0 Tsbrnbr Tsbrfbr Tsbrsbr 0
 oth 0 0 0 0 0 ... 0 0 0 0 0 1

In this model, three parameters control the first appearance of a bird in a breeding colony as an adult.
The age at which this happens is determined by parameters P1stapp6 and oddsmult, and the appearance
in the study colony, with probability Pappstd, or elsewhere (i.e., state oth) with probability 1-Pappstd.

This first appearance of the adult in the study area is either as a pre-breeder (with probability 1-Pbr1st)
or as a breeder (with probability Pbr1st). Thus, for birds of age a from 4 to 9, there are five possibilities,
as follows:
 Location Stage Status Probability
 other adult Potha = P1stappa(1-Pappstd)
 study adult pbr Ppbra = P1stappa x Pappstd(1-Pbr1st)
 study adult fbr Pfbra = P1stappa x Pappstd x Pbr1st(1-Psuccess)
 study adult sbr Psbra = P1stappa x Pappstd x Pbr1st x Psuccess
 juvenile Pjva = 1-Potha-Ppbra-Pfbra-Psbra

6 • Demographic assessment of black petrels on the Great Barrier Island Fisheries New Zealand
Juveniles that have not bred before age 10 must breed at that age, so they have only three possibilities:

 Location Stage Status Probability

 other adult oth Poth10 = 1-Pappstd
 study adult fbr Pfbr10 = Pappstd(1-Psuccess)
 study adult sbr Psbr10 = Pappstd x Psuccess

When a bird that has been a pre-breeder in the study area first breeds, it does so either in the study area
(with probability Pbrstd) or elsewhere (with probability 1-Pbrstd). Thus, birds that have become pre-
breeders in the study area have four options for the following year:

 Location Status Probability

 study pbr Tpbrpbr = 1-Tpbrbr
 study fbr Tpbrfbr = Tpbrbr x Pbrstd(1-Psuccess)
 study sbr Tpbrsbr = Tpbrbr x Pbrstd x Psuccess
 other oth Tpbroth = Tpbrbr x (1-Pbrstd)

Once a bird starts breeding in the study area it moves between states nbr, fbr, and sbr in the same way
(and controlled by the same parameters). The model assumes that individuals moving to state oth never
leave it. Individuals are rarely observed moving from a study burrow to outside the study area and will
tend to return back to the same or another burrow within the study area.

Observations
Only mark-recapture observations and transect survey population estimates were fitted to by
demographic assessment models developed by this study. These observations are summarised in
Table 5).

Table 5: Summary of observations fit to by GBI population models developed by Francis & Bell (2010),
 Bell et al. (2014), and developed by this study.

 Data type Francis & Bell (2010) additional in Bell et al. additional in the present
 (2014) report
 Mark-recapture
 Year covered 1996–2009 2010–2014 2015–2017
 Birds banded as chicks 1 798 862 604
 Birds banded as adults 1 507 445 252

 Abundance estimation (and CVs)
 No. of breeders in 2005 1 964 (0.10)
 No. of breeders in 2010 1 525 (0.11)
 No. of breeders in 2013 3 248 (0.10)
 No. of breeders in 2016 3 989 (0.11)

Model development process
In addition to Model 1 (the previous base), a number of alternative model parameterisations were
trialled in consultation with the Aquatic Environment Working Group; these differ with respect to the
parameterisation of: survival of pre-breeders, and whether annual resighting or breeding probabilities
were constant or allowed to vary with respect to year. To test whether the year-varying pattern of
successful breeders resighting probabilities of Model 1 was driven by the transition between different
breeding status. Model 3 fixed the resighting probabilities of the successful breeder to 1. In Model 4,
the working group’s suggestion to re-assign the annual survival probability of pre-breeders from the
non-breeder class to the juvenile class was followed. In addition, a greatly simplified parameterisation
ignored observations of individuals prior to first breeding as in Model 2 (Table 6).

Fisheries New Zealand Demographic assessment of black petrels on the Great Barrier Island • 7
Table 6: Model run labels and descriptions for the model runs.

 Model type Model Description

 Base case 1 Base case model, uses the same structure as BPET7 by Francis & Bell
 (2010) and Bell et al. (2014) with the updated data

 Simple model 2 Presence/absence of banded birds only
 Fixed resight probability 3 Resight probability fixed at 1 for success breeders
 Sensitivity of Model 3 3.1 Model 3, but with combined resight probability of successful and failed
 breeders
 3.2 Model 3.1, but with a combined survival rate of breeders and non-
 breeders
 3.3 Model 3.2, but with combined resight probability of prebreeders and
 non-breeders
 Re-classify pre-breeder survival 4 Model 1, but with a re-classified survival rate of pre-breeders into
 juvenile class.

Candidate models were constructed and fitted to the mark-recapture data, and the most parsimonious
model was selected using Akaike’s Information Criterion (AIC) (Burnham & Anderson 2004).
However, the AIC favours over-parameterisation, which might lead to some implausible model
structures. In this assessment, both AIC scores and the biological plausibility of assumptions made by
model structures were considered.

Parameter estimation
Survival Siy, is the proportion of black petrels in the ith partition class that survive natural mortality to
the end of year y. An observation in time step t in year y can be specified as part-way through the
mortality that occurred in that time step. Thus, if p is the proportion of that mortality that had occurred
before the observation nity;p is defined as the number of individuals in the ith class at the time of the
observation. Here nity;p was calculated as the weighted sum:

 nity;p = (1-p) nity + pn’ity = (1-p +pTity)nity

Where nity and n’ity (=sitynity) are the numbers before and after the mortality in this year.

Age at first breeding is a function of the probability Pbr,a of a bird breeding at age a, multiplied by the
proportion of the age group Pa.

 A = ∑11
 =4 ,

 Pbr,6 = cP1stbr(6)

 Pbr,a = Pbr,a-1 Psurv,juv P1stbr(a) (1- P1stbr(a -1))/ P1stbr(a -1)

Where the constant c is adjusted so that ∑11
 =4 , = 1.

Markov chain Monte Carlo (MCMC) model runs
The Metropolis–Hastings algorithm was used. Three independent chains were then run for 200 000
iterations, keeping every 1000th sample. As a preliminary step to improve mixing, the covariance
matrix (used to generate the proposal distribution) was recalculated empirically from the first 100 000
iterations, which were then discarded. This step was undertaken twice.

8 • Demographic assessment of black petrels on the Great Barrier Island Fisheries New Zealand
3. RESULTS

3.1 Field observations and relative population estimates

Census grid burrow counts
Figure 2 shows the annual counts of all burrows and breeding burrows in the census and the percentage
of burrows used for breeding with the additional data added since the last analysis (from 2011 to 2017),
and some revision of the earlier data. Burrow counts (detailed in Appendix 1) were consistently higher
in some grids than in others, indicating spatial heterogeneity in burrow density. There was a strong
upward trend in the total number of burrows since 2000, which reached a plateau around 2010
(Figure 2). The number of breeding burrows shifted from a lower plateau (at about 78) before 2005 to
a higher plateau (at about 92) from 2006 up to 2013. From 2014 to 2017, the number of breeding
burrows continued to increase from 91 to 103, which was partially caused by the use of detector dogs
in later years. The percentage of burrows used for breeding fluctuated between 56% and 71% across
the study period with a mean of 61.89% ± 1.0% (1SE) over the study period and no obvious trend.

Figure 2: Annual counts of all burrows and breeding burrows in the census (left) and the percentage of
 burrows used for breeding (right). See Appendix 1 for counts by grid. The arrows marked with
 G2 and G3 indicate when the 2nd and 3rd set of grids were added to the census burrow count.

Transect survey population estimates
The individual line transect spatial locations and counts for the 2016 survey are detailed in Appendix 2.
The total breeding population estimate from the transect survey increased from 3248 individuals
(CV = 0.10) in 2013 to 3989 individuals (CV = 0.12) in 2016 (Table 5). However, the increase was
much more pronounced in medium-quality habitat, increasing from 1555 individuals (CV = 0.13) in
2013 to 1949 individuals (CV = 0.16) in 2016, compared with 747 individuals (c.v. = 0.06) in 2013 to
1125 individuals (CV = 0.25) in 2016 for high grade habitat (where most mark-recapture study burrows
were located) and 945 individuals (CV = 0.22) in 2013 to 915 individuals (CV = 0.21) in 2016 for low
grade habitat (Figure 3).

Fisheries New Zealand Demographic assessment of black petrels on the Great Barrier Island • 9
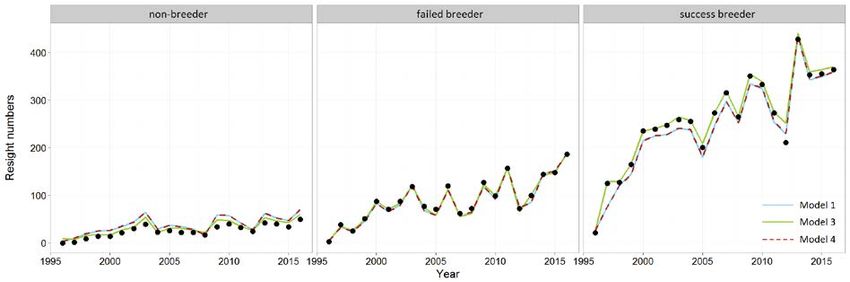
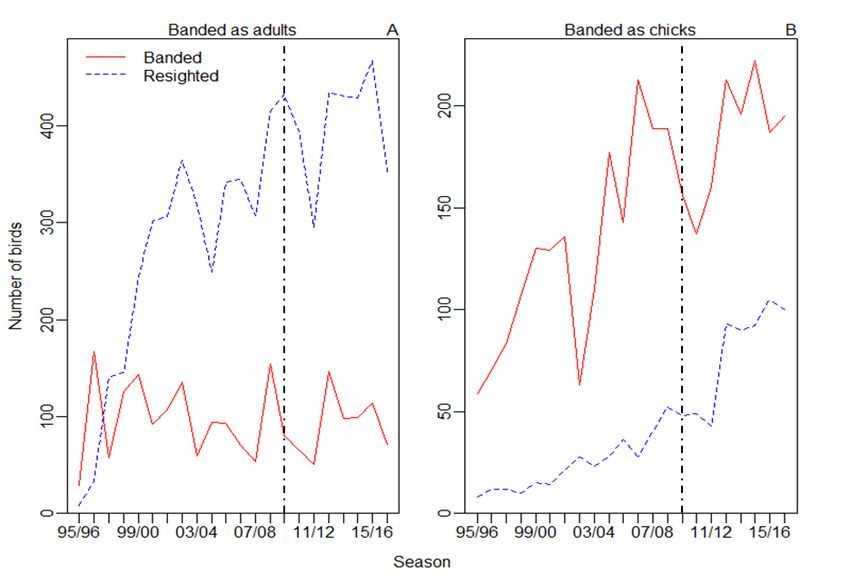
Figure 3: Top panel: total population estimation from the four transect surveys (2005, 2010, 2013, and 2016)
 for the study area. Bottom panel: population estimation by habitat quality grades. The error bars
 represent 95% CI of and relative estimations.

Mark-recapture observations
Mark-recapture data were collected from study burrows (see Figure 4) and comprised the resighting
histories of 5456 individuals. Eighty-eight birds were banded prior to 1996 (the first resighting season
used in this assessment), including individuals banded since 1964. Of these, 83 birds were resighted
during the study period (1996 to 2017) and, so, were included in this assessment. Banded birds were
either banded as a chick (known age, cumulative n = 3300 individuals), or as an adult (unknown age,
cumulative n = 2150 individuals). An average of 96 ± 8 adults were banded each year. The annual
frequency of unknown age bandings has been relatively consistent through time and annual resightings
of these birds has increased steadily since 1996 (Figure 5A). By comparison, the frequency of known
age (chick) bandings increased around 2005 and subsequent resightings of these birds increased
markedly after 2013. (Figure 5B).

10 • Demographic assessment of black petrels on the Great Barrier Island Fisheries New Zealand
Figure 4: Cumulative number of study burrows.

Figure 5: The total number of birds banded and resighted by year: A, birds banded as adults (unknown
 age); B, birds banded as chicks (known age).

Age at first breeding of known-age birds
Of the 2219 chicks banded prior to 2013, only 161 (7.3%) birds have subsequently been observed
breeding (Table 7). Excluding cohorts born prior to 1992 (for which there was not consistent resighting
effort at early ages), the earliest and latest observed first breeding was at age 4 and 16, respectively (the
most common age when first observed breeding was age 6).

Fisheries New Zealand Demographic assessment of black petrels on the Great Barrier Island • 11
Table 7: For study birds (i.e., birds banded in study areas) banded as chick before 2013, the age they were
 first observed breeding and the number not yet observed breeding, by year of banding (birds that
 were observed dead or with uncertain breeding status before seen breeding were excluded from
 this table). ‘-’ denotes impossible combination. (Observations of birds banded before 1992 were
 excluded from summary calculations, because these birds could well have bred before the
 sampling programme that started in 1996.)

 Not
 Age when first observed breeding observed
 Year Any breeding
 4 5 6 7 8 9 10 11 12 13 14 15 16 18 25
 banded age yet
 1978 - - - - - - - - - - - - - 1 0 1 0
 1986 - - - - - - 0 0 1 0 0 2 0 0 0 3 0
 1987 - - - - - 0 0 0 0 1 0 0 0 0 0 1 2
 1988 - - - - 1 0 1 0 1 0 0 1 0 1 1 6 0
 1989 - - - 0 1 0 0 1 0 0 0 0 0 0 0 2 1
 1990 - - 2 3 1 0 0 0 0 0 0 0 0 0 0 6 1
 1992 0 1 0 0 0 0 0 0 0 0 0 0 0 0 0 1 0
 1996 0 1 1 0 0 0 0 0 0 0 0 0 0 0 - 2 57
 1997 0 1 0 1 2 1 0 0 0 0 0 0 0 0 - 5 64
 1998 0 1 2 0 0 0 0 0 0 0 0 0 0 0 - 3 74
 1999 0 0 2 2 2 0 1 0 1 0 0 0 0 0 - 8 96
 2000 0 2 3 3 2 2 0 0 0 0 0 0 0 - - 12 115
 2001 0 1 0 0 2 1 0 0 0 0 0 0 1 - - 5 122
 2002 0 0 4 2 1 0 0 5 0 0 1 0 - - - 13 119
 2003 0 2 1 1 0 0 2 0 0 0 0 - - - - 6 56
 2004 1 1 0 3 1 1 0 0 0 1 - - - - - 8 101
 2005 0 2 4 5 2 1 0 0 0 - - - - - - 14 160
 2006 0 2 3 5 1 0 1 0 - - - - - - - 12 128
 2007 0 2 3 2 0 4 2 - - - - - - - - 13 190
 2008 2 0 3 3 1 2 - - - - - - - - - 11 174
 2009 1 2 6 4 1 - - - - - - - - - - 14 170
 2010 1 1 5 2 - - - - - - - - - - - 9 143
 2011 1 2 1 - - - - - - - - - - - - 4 129
 2012 0 2 - - - - - - - - - - - - - 2 156
 All years 6 23 40 36 18 12 7 6 3 2 1 3 1 2 1 161 2 058

Observations of pre-breeders
Of known age birds in their first resighting year, only 35.9% were confirmed to be breeding (Table 8).
The mean age of a known age individual returning to the colony as a non-breeding bird (i.e. pre-breeder)
was 5.6 years, whereas first-time breeders had a mean age of 7.0. The mean duration of the pre-breeding
period across all known age individuals was 0.6 years, and did not exceed 4 years, with a single
exception (7 years) (Table 9). Since only half (50.6%) of the petrels banded as adults were known to be
breeders when banded (Table 10), it is likely that some of those adult birds were banded as pre-breeders
in addition to older birds.

12 • Demographic assessment of black petrels on the Great Barrier Island Fisheries New Zealand
Table 8: Age and status at first resighting for birds banded as chicks and since resighted alive.

 Status
 Age at first resighting Non-breeder Unknown Breeder

 3 1 1 0
 4 30 7 8
 5 45 8 14
 6 22 3 21
 7 14 2 17
 8 4 2 8
 9 3 3 10
 10 1 5 3
 11 0 0 4
 12 0 2 0
 13 0 0 1
 14 1 0 1
 15 0 0 0
 16 0 1 1
 17 0 1 0
 18 1 0 0
 All 122 35 88

Table 9: Number of years between first resighting and first resighting as a breeder for the 143 birds that
 were banded as chicks and subsequently seen breeding.

 No. of years before seen breeding (after first resighting)
 Age at first resighting 0 1 2 3 4 7

 3 0 0 0 1 0 0
 4 8 8 1 2 0 1
 5 14 15 4 3 1 0
 6 21 10 1 0 2 0
 7 17 3 1 0 0 0
 8 8 0 1 0 0 0
 9 10 0 0 0 0 0
 10 3 0 1 0 0 0
 11 4 0 0 0 0 0
 13 1 0 0 0 0 0
 14 1 0 0 0 0 0
 16 1 0 0 0 0 0
 All 88 36 9 6 3 1

Table 10: Breeding state of birds banded as adults.

 Breeder Non-breeder Unknown
 1091 951 113

Breeding success
Across all seasons, 67.4% (± 0.9 % 1SE) of all observed study birds were confirmed as breeding. Of
these, 50.6% (± 1.4 %) bred successfully (i.e., produced a fledged chick). The most frequently identified
reason for breeding failure was egg disappearance 3.4 (± 0.6%), followed by embryo death 3.1 (± 0.4%).
None of these or the other identified causes of death displayed a clear temporal pattern with respect to
relative importance (Figure 6).

Fisheries New Zealand Demographic assessment of black petrels on the Great Barrier Island • 13
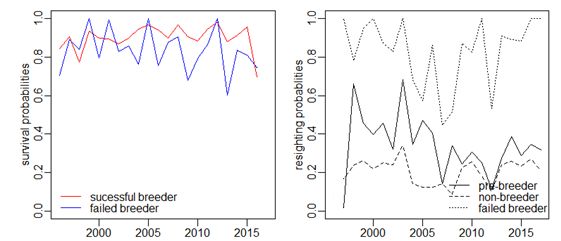
Figure 6: Breeding status or outcome of study burrows by year.

3.2 Mode of the Posterior Distribution (MPD) model runs

Model fits
Model fits to annual resightings of banded birds and to line transect population size estimates are shown
for Models 1, 3, and 4 (i.e., all models including pre-breeder classes) (Figure 7). Fits to annual observed
resighted birds were very good for all of these model runs. Model 3 gave the best fits to both non-
breeders and successful breeders, confirmed by best model fit in terms of log-likelihood contribution
(Table 11). Model fits to line transect population size estimates were good for all years except 2010, for
which all models estimated much greater numbers than observed (Figure 7). In addition, all three models
produced lower estimates than observed in 2016.

Estimated parameters
Model estimates of all demographic rates for the four model runs at MPD are shown in Table 12. These
are compared with the previous base case model run estimates from Bell et al. (2014). The results for
each model run are described in more detail below.

Model 1
This model run was parameterised as the previous base case described by Bell et al. (2014) (see
Table 6). The annual survival probabilities of successful and unsuccessful breeders (Figure 8) were
broadly consistent with the previous assessments by (Bell et al. 2014). Survival estimates were generally
greater for successful breeders than failed breeders. The mean survival probabilities across all adults
(regardless of breeding state) was 0.87. The annual resighting estimates of pre-breeders and non-
breeders were comparable with those of Bell et al. (2014) (not shown here). The estimated mean age at
first breeding (7.2 years) (Figure 9), was slightly older than the previous assessment estimate of 6.8
years (Bell et al. 2014). The juvenile annual survival estimate for this model run of 1.00 was biologically
implausible, indicating confounding with other model parameters.

14 • Demographic assessment of black petrels on the Great Barrier Island Fisheries New Zealand
Figure 7: Model MPD run fits to mark-recapture observations (top) and line transect population estimates
 (bottom). Empirical data are shown as black or grey dots, with the model estimated values as
 coloured lines, error bars in the population estimation plots indicate ranges of 95 % CI.

Table 11: Summary of model run total number of parameters, log-likelihood, and AIC scores.

 Model No. of parameters -ln(L) for mark-recapture data -ln(L) for census data AIC

 1 144 16721.1 30.6 33791.4
 2 44 8909 – 17906
 3 144 16423.2 31.7 33197.8
 4 144 16722.5 30.7 33794.4

Table 12: Estimates of selected key black petrel demographic parameters (calculated from model
 parameter estimates) of Bell et al. (2014), and models of this assessment.

 Parameter (2014) Model 1 Model 2 Model 3 Model 4

 Initial (1996) size of the adult population in the
 study area – 1 545 – 2 048 2 129
 Mean age of first breeding 6.9 7.2 – 6.9 6.8
 Percentage of birds that skip the pre–breeder stage 3.10 3.10 – 5.00 3.20
 Of birds that appear in the study area and survive to
 breed, the percentage that breeds the study area 96 100 – 68 61
 Average annual survival rates: 0.92 1.00 – 0.95 0.93
 non–breeding adults 0.86 0.86 – 0.86 0.86
 breeding adults 0.89 0.88 – 0.89 0.88
 all adults 0.89 0.87 0.86 0.86 0.87
 Percentage of adults breeding in any year 77 80 – 72 79
 Percentage of breeding attempts that are successful 76 73 – 71 73

Fisheries New Zealand Demographic assessment of black petrels on the Great Barrier Island • 15
Figure 8: Estimated probabilities of (A) survival and (B) resighting probabilities of Model 1.

Figure 9: The estimated distribution of age at first breeding recomposed from maturation parameters
 estimated by Model 1.

16 • Demographic assessment of black petrels on the Great Barrier Island Fisheries New Zealand
Model 2
Model 2 had the same simplified structure and parameterisation as BPET1 by Francis and Bell (2010)
and ignored an individual’s observations prior to first observed breeding. The estimated adult survival
probability across all years was ~0.87 (see Table 12) and annual resighting probabilities varied between
0.5 and 0.84 with no obvious year trend (Figure 10).

Figure 10: Estimated probabilities of survival probabilities (left) and resighting probabilities (right) of
 Model 2.

Model 3
Model 3 was parameterised as Model 1, though it assumed that the annual resighting probability of
breeders was 1 (i.e., all breeders were seen) and annual breeding rates for successful and failed breeders
were allowed to be time-varying. The year trend in annual breeding probabilities followed a similar
pattern to that of year-varying resighting probabilities estimated by Model 1 and 2 (Figure 12), i.e. low
estimates were obtained for corresponding years in the mid-2000s. The juvenile survival estimate for
this model run of 0.95 was much more plausible relative to that for Model 1. However, annual adult
survival estimates were essentially unchanged from model run 1 (compare Figure 8 and Figure 11; also
see Table 12).

Figure 11: Estimated probabilities of survival probabilities (left) and resighting probabilities (right) of
 Model 3.

Fisheries New Zealand Demographic assessment of black petrels on the Great Barrier Island • 17
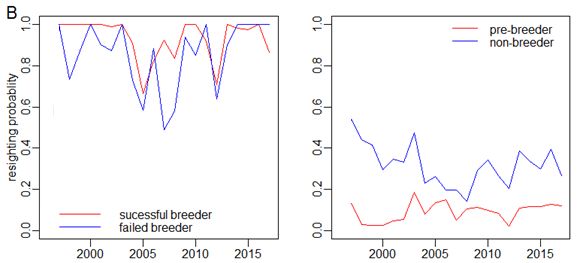
Figure 12: Resighting probabilities (year-varying) and breeding probabilities of successful breeder
 (constant value over years) of Model 1, compared with the breeding probabilities of successful
 breeders in Model 3.

An exploratory set of sensitivity runs to model run 3 were conducted to examine the best
parameterisation of survival and resighting parameters (Table 13) for Model 3. Model 3.3 had the lowest
AIC and fewest number of parameters. This model run assumed the same annual resighting probability
for successful and failed breeders and also combined the survival rate of breeders and non-breeders into
a single adult survival rate. Despite the improvements to model AIC, this model was not considered for
MCMC because too many changes were made relative to the old base case model structure, although
this more parsimonious structure could be considered for future model development.

Table 13: The parameterisation and model AIC (Akaike Information Criterion) of sensitivity runs to
 Model 3. All models were fit to the same observations. Interpretation: e.g., for model 3.1 there
 were three vectors of survival parameters, one for pbr, one for nbr, and one for both fbr and sbr.

 Model Survival parameters Resighting parameters
 run pbr nbr br pbr nbr fbr sbr No. of parameters AIC - min(AIC)

 3.1 1 2 3 1 2 3 4 39 12.48
 3.2 1 2 3 1 2 3 3 38 2.92
 3.3 1 2 2 1 2 3 3 37 0

Model 4
Model 4 was as Model 3, though combined pre-breeder survival with juvenile survival instead of adult
survival. The mean adult survival estimate from Model 4 was similar to the other runs (see Table 12)
and year-varying demographic rates were very similar to those of Model 1 (compare Figure 8 and
Figure 13). With respect to juvenile survival, the estimate from Model 4 (0.93) was more plausible than
from Model 1 (1.00) and produced a decreased percentage of individuals returning to breed in the study
area (61% from Model 4, compared with 100% from Model 1).

18 • Demographic assessment of black petrels on the Great Barrier Island Fisheries New Zealand
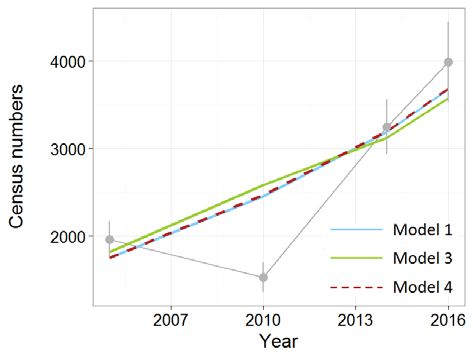
Figure 13: Estimated probabilities of survival (top) and resighting (bottom) probabilities of Model 4.

Likelihood profile of juvenile survival
A likelihood profile on juvenile survival for Model 4 indicated that the optimal juvenile survival rate
was between 0.85 and 0.875 (Figure 14A). However, juvenile survival within this range produced poor
model fits to line transect population size estimates. This indicated contradictory information from
mark-recapture observations and population size estimates: the population size estimates indicate that
the breeding population decreased between 2005 and 2010, and then increased rapidly between 2010
and 2016. Model 4 estimated a breeding population growth rate between 0.88% y-1 (if juvsurv = 0.85)
and 0.33% y-1 (if juvsurv = 0.875) (Figure 14B).

Altering juvenile survival within the optimal range had little effect on other parameter estimates, such
as the adult survival rate (Figure 15A, B) and the age at first breeding (Figure 15C).

Fisheries New Zealand Demographic assessment of black petrels on the Great Barrier Island • 19
Figure 14: Results of a posterior profile on juvenile survival rate for Model 4: A, the loss of fit; and B,
 population trajectories associated with alternative values of juvenile survival.

Figure 15: The effect of assuming alternative values of juvenile survival (0.85, 0.875, or 0.93) on other key
 demographic rates including: A – estimated survival for breeder and non-breeders; B –
 estimated distribution of ages at first breeding for the same three values of juvsurv; and C –
 estimated age at first breeding.

3.3 MCMC model runs

MCMC model runs were undertaken for Models 1, 2, 3, and 4. A visual inspection of the trace plots for
Model 1, Model 3, and Model 4 indicated that the method of empirically recalculating the covariance
matrix to generate the MCMC proposal distribution was effective in giving an acceptable degree of
mixing for estimated parameters. There was a good agreement in the distribution of estimates obtained
from different chains (Appendix 3).

20 • Demographic assessment of black petrels on the Great Barrier Island Fisheries New Zealand
Parameter estimates
The MCMC posteriors of year-varying annual adult survival and resighting probability are displayed in
Figure 16 to Figure 19 and all parameter estimates are tabulated in Table 14. Estimates of adult survival
for the last ten years (2007 to 2016) were derived from the MCMC samples and reproduced in Table 15.
The adult survival rates estimated by MCMC range between 0.86 and 0.89 across Model 1, Model 3,
and Model 4, and the MPD estimate for these models were within the ranges of 95% c.i. from the model
MCMC results. For juvenile survival, Model 3 and Model 4 estimate lower means compared with
Model 1, and the MCMC results indicate that the overall estimates for this parameter are still
unrealistically high with large uncertainty around this parameter. Model 3 estimated lower values for
the percentage of breeding attempts that were successful.

Table 14: Mean estimates of selected key black petrel demographic parameters (calculated from model
 parameter estimates) from MCMC results of Model 1 to Model 4. The upper and lower bounds
 95% credible intervals are included in the parentheses.

 Parameter Model 1 Model 2 Model 3 Model 4

 Initial (1996) size of the adult 1133 2299 1072
 population in the study area (1009–1271) – (1306–3812) (1001–1185)
 6.86 6.89 6.86
 Mean age of first breeding (6.51–7.13) – (6.59–7.16) (6.60–7.12)
 Percentage of birds that skip the pre- 7.5 6.8 3.9
 breeder stage (3.6–13.3) – (3.1–12.6) (1.8–7.0)
 Of birds that appear in the study area
 and survive to breed, the percentage 68.6 68.7 58.8
 that breeds the study area (62.2–75.0) – (61.7–76 .3) (50.4–67.4)
 Average annual survival rates: 0.986 0.967 0.957
 juveniles (0.953–0.999) – (0.922–0.997) (0.921–0.994)
 0.860 0.853 0.814
 non-breeding adults (0.835–0.884) – (0.830–0.875) (0.784–0.852)
 0.889 0.890 0.879
 breeding adults (0.876–0.902) – (0.877–0.903) (0.866–0.892)
 0.883 0.857 0.880 0.867
 all adults (0.872–0.893) (0.832–0.872) (0.871–0.888) (0.857–0.878)
 Percentage of adults breeding in any 77.7 71.9 81.8
 year (76.1–79.3) – (69.0–74.2) (80.1–83.4)
 Percentage of breeding attempts that 73.2 69.6 73.1
 are successful (71.7–74.7) – (68.1–71.1) (71.7–74.4)

Table 15: Mean estimates of selected key black petrel adult survival from 2007–2016 (calculated from
 model parameter estimates) from MCMC results of Model 1 to Model 4. The upper and lower
 bounds 95% credible intervals are included in the parentheses.

 Parameter Model 1 Model 2 Model 3 Model 4
 non-breeding
 adults 0.839 (0.806–0.872) – 0.831 (0.802–0.860) 0.830 (0.791–0.865)
 breeding adults 0.884 (0.866–0.903) – 0.883 (0.866–0.900) 0.872 (0.856–0.889)
 all adults 0.874 (0.859–0.890) 0.852 (0.832–0.875) 0.870 (0.857–0.880) 0.864 (0.850–0.879)

Fisheries New Zealand Demographic assessment of black petrels on the Great Barrier Island • 21
Figure 16: Model 1 MCMC estimates of annual breeder survival rates and annual breeder resight
 probabilities of black petrel. Points are median estimates, bars are 95% confidence intervals.

Figure 17: Model 2 MCMC estimates of annual adult survival rates and annual resight probabilities of
 black petrel. Points are median estimates, bars are 95% confidence intervals.

22 • Demographic assessment of black petrels on the Great Barrier Island Fisheries New Zealand
Figure 18: Model 3 MCMC estimates of annual breeder survival rates and annual breeding probability of
 successful breeders. Points are median estimates, bars are 95% confidence intervals.

Figure 19: Model 4 MCMC estimates of annual breeder survival rates and annual breeder resight
 probabilities of black petrel. Points are median estimates, bars are 95% confidence intervals.

Fisheries New Zealand Demographic assessment of black petrels on the Great Barrier Island • 23
4. DISCUSSION

4.1 Adult survival

This work updates the quantitative modelling of the GBI study population of the black petrel, using
mark-recapture data from 1996 and four census estimates from transect surveys. Models developed by
Francis & Bell (2010) and Bell et al. (2014) were updated. All models produced very good fits to mark-
recapture observations and reasonable fits to population size estimates (see Figure 7). When the
previous base case model (Bell et al. 2014) was updated with new observations, very similar
demographic rate estimates were obtained, though adult survival estimates were slightly reduced;
Bell et al. (2014) estimated an adult survival of 0.89 at MPD, which was updated to 0.86 or 0.87 in this
assessment, depending on model run. However, MCMC runs (not undertaken by Bell et al. 2014) of
models including pre-breeders produced comparable adult survival estimates ranging from 0.87 (95%
CI = 0.86–0.88) to 0.88 (95% CI = 0.87–0.89). Adult survival estimates in recent years (2007–2016)
were slightly lower compared with the means of the entire study period (see Table 15).

4.2 Breeder resighting probability

The updated previous base case model (Model 1) estimated year-varying resighting probabilities
ranging from 0.66 to 1.00 (see Figure 8). However, in the field, ecologists believe that the resighting
rate for successful breeders is higher than this (closer to 80–90% on average) and unlikely to be lower
than 0.70 in any year during the study period. A more likely explanation for these birds not being
observed in these years was that they did not breed in that year. Hence Model 3, which assumed that all
breeders were observed and the resighting probability of breeders was allowed to vary by year, is a
more realistic model and the authors propose this is considered as the new base case model for this
population. Note that the estimated annual probabilities of breeding from Model 3 mirrored the pattern
of resighting probabilities of successful breeders in Model 1 (compare Figure 8 and Figure 11),
indicating that these parameters were confounded given the observations. However, despite these
substantial changes to model parameterisation and improved fit to mark-recapture observations (see
Figure 7), Model 3 produced highly comparable estimates of adult survival to Model 1, the previous
base case model structure (see Table 14).

4.3 Juvenile survival

The annual juvenile survival rate was estimated to be 1.00 (100%) by Model 1, which updated the
previous base case. The probable reason for obtaining this unrealistically high value was the
confounding of juvenile survival probability and the probability of a bird hatched in the study area
returning to produce a burrow in the study area. Birds have been observed relocating between GBI and
LBI, but in what seems to be very low numbers — only 2 LBI-born birds have been recorded on GBI
and only one GBI-born bird has been recaptured on LBI. Furthermore, an unknown proportion of
breeding birds may move in or out of the study area on GBI. To obtain robust estimates of juvenile
survival, information for estimating the emigration rate would be required. However, field-based data
collection has not been designed to provide the information requirements for estimating the rate of
emigration.

Model 4 followed the working group’s suggestion by re-assigning the survival probability of pre-
breeders from the non-breeder class (as assumed by Model 1 and Model 3) to the juvenile class. This
was justified on the basis that pre-breeders would be biologically most comparable to other juveniles
that had not yet bred. This parameterisation also increased the number of observations for estimating
juvenile survival and slightly reduced the estimate of juveniles returning to the study area to 59% (95%
CI = 50–67%) from 69% (95% CI = 62–75%) from Model 1, as well as producing a more plausible,
though still high juvenile survival estimate of 0.96 (0.92–0.99), compared with 0.99 (95% CI = 0.96–
1.00) from Model 1. Note that this estimate is higher than those considered for the estimation of
population trajectory (see Figure 15) and may have produced improved fits to population size estimates

24 • Demographic assessment of black petrels on the Great Barrier Island Fisheries New Zealand
than were obtained from that assessment. However, with respect to adult survival the Model 4
parameterisation produced very similar estimates compared with Model 1 (see Table 14 and Table 15).

4.4 Age at first breeding

The estimates of age at first breeding are similar across Model 1 (6.86, 95% CI = 6.51–7.13), Model 3
(6.89, 95% CI = 6.59–7.16) and Model 4 (6.86, 95% CI = 6.60–7.12), and these results are similar to
the value estimated in the previous assessment (6.9) (see Table 14). The uncertainty around the estimate
of age at first breeding, is associated with few banded chicks returning to the study area providing
relatively few observations for the estimation of survival of the known-age birds prior to first breeding.

4.5 Exploration of parsimonious models

Both Model 1 and Model 3 have 144 parameters, which provided a challenge for parameter estimation
and model convergence. Several variants of Model 3 were considered to search for the best
parameterisation of survival and resighting parameters based on model AIC. The optimal model, Model
3.3, had the fewest number of parameters, achieved by combining the resighting probabilities of
successful breeders and failed breeders and by combining the survival rate of breeders and non-breeders.
All parameters were constant with respect to year, except for the breeding probability of breeders. The
outputs of Model 3 indicated that the resighting probability of breeders was not contingent on breeding
success in the preceding year and that survival rate was not different for breeders and non-breeders.
Loglikelihood scores for the mark-recapture data remained the same over Model 3.1 to Model 3.3. This
suggests that simplification of model structure and parameterisation is possible, with no or little cost of
fitting to the mark-recapture data. These models were not carried forward to MCMC by this assessment
because they were developed late in the assessment process. The authors suggest that future assessments
consider simpler model parameterisations, which appear to be more parsimonious and should improve
mixing at MCMC.

4.6 Fits to population size estimates

The population trend predicted by the model produced a relatively poor fit to the line transect population
size estimates (as found by previous assessments) compared with mark-recapture fits, which indicates
a conflict between the information from the two sets of observations (see Figure 7). Most mark-
recapture study burrows were located in the high-quality habitat, where the population growth rate
indicated by the line transect survey was lower than medium- and low-grade habitat (see Figure 3). To
explain the apparent conflicting information from mark-recapture and population size estimates, future
assessments could re-weight the mark-recapture data by the habitat type to see if the fits to population
size estimates are improved. To estimate adult survival that is more representative of the wider study
area (i.e., covered by the line transect survey area), more mark-recapture study burrows will need to be
established in low- and medium-grade habitat areas. This would allow an assessment of whether
variable population growth from the line transect survey is caused by variable adult survival or variation
in other demographic rates, such as spatial heterogeneity in the rate of breeding site selection by pre-
breeders.

4.7 Accounting for emigration

The demographic assessment model assumed that the demographic parameters of the study area are
representative of the GBI population. The current model structure assumes that each individual decides
whether to breed inside or outside the study area at first breeding and remains faithful to this decision
throughout their lives. Emigration rates could be estimated from observations of marked individuals
made outside the study site. To provide the information requirements for estimating emigration rate, it
is recommended that, where possible, birds from random burrows on transect surveys and random area
surveys are checked for bands, and that unidentified birds are banded.

Fisheries New Zealand Demographic assessment of black petrels on the Great Barrier Island • 25
5. CONCLUSIONS

This assessment has made some improvements to model parameterisation though produced similar
estimates of key demographic rates to previous assessments, i.e., with respect to adult survival and age
at first breeding — the key outputs of this assessment. Another advance made in this assessment was
the estimation of credible intervals (and MCMC posteriors) for all estimated parameters that can be
used by other research. Future assessments may consider including updated observations of individuals
sighted outside the study area and may account for the distance of these observations from the study
area in some way. This will be necessary to account for a potential downward bias in adult survival
estimates caused by unaccounted for emigration of breeders from the study area. The apparent conflict
between mark-recapture and line transect population size estimates could be addressed by re-weighting
the transect data based on the habitat quality of the study burrows from which the mark-recapture data
were collected (to test whether the two data sources now agree). Ideally, future field research will collect
a greater proportion of mark-recapture information from low- and medium-grade habitat to assess
whether adult survival is different in these faster-growing populations, or if this is likely to be caused
by variation in other demographic rates, such as spatial heterogeneity in the rate of breeding site
selection by pre-breeders.

6. ACKNOWLEDGMENTS

This work was funded by the Ministry for Primary Industries (Wellington, New Zealand), under project
code PRO2017-05A. We are grateful for the review of this work by Ian Doonan and Ian Tuck (both
NIWA), the Aquatic Environment Working Group, and the Conservation Science Programme Research
Advisory Group.

7. REFERENCES

Bell, E.A. (2016). Diving behaviour of black petrels (Procellaria parkinsoni) in New Zealand waters
 and its relevance to fisheries interaction. Notornis 63 (2): 57–65.
Bell, E.A.; Burgin, D.; Sim, J.; Dunleavy, K.; Fleishman, A.; Scofield, R.P. (2018). Population trends,
 breeding distribution and habitat use of black petrels (Procellaria parkinsoni) – 2016/2017
 operational report. New Zealand Aquatic Environment and Biodiversity Report No. 198. 50 p.
Bell, E.A.; Mischler, C.P.; MacArthur, N.; Sim, J.L. (2016a). Black petrel (Procellaria parkinsoni)
 population study on Hauturu‐o‐Toi/Little Barrier Island, 2015/16. (Draft report to the
 Conservation Services Programme, Department of Conservation. Wellington, New Zealand.)
 21 p. https://www.doc.govt.nz/Documents/conservation/marine-and-coastal/marine-
 conservation-services/reports/pop2015-01-blackpetrel-lbi-draftfinal.pdf
Bell, E.A.; Mischler, C.P.; MacArthur, N.; Sim, J.L. & Scofield, R.P. (2016b). Population parameters
 of black petrels (Procellaria parkinsoni) on Great Barrier Island (Aotea Island), 2015/16. (Draft
 report to the Conservation Services Programme, Department of Conservation. Wellington, New
 Zealand.) 58 p. https://www.doc.govt.nz/Documents/conservation/marine-and-coastal/marine-
 conservation-services/reports/pop2015-01-black-petrel-gbi-final.pdf
Bell, E.A.; Mischler, C.; Sim, J.L.; Scofield, P.; Francis, C.; Abraham, E.; Landers, T. (2014). At‐sea
 Distribution and population parameters of the black petrels (Procellaria parkinsoni) on Great
 Barrier Island (Aotea Island), 2013/14. (Draft Research Project Report prepared for
 Conservation Services Programme. Department of Conservation, Wellington.) 98 p.
 https://www.doc.govt.nz/globalassets/documents/conservation/marine-and-coastal/marine-
 conservation-services/meetings/pop2013-04-black-petrel-population-final-report-2014.pdf
Bell, E.A.; Sim, J.; Scofield, R.P. (2007). Demographic parameters of the black petrel (Procellaria
 parkinsoni). DOC Research & Development Series 273. Department of Conservation,
 Wellington. 32 p.

26 • Demographic assessment of black petrels on the Great Barrier Island Fisheries New Zealand
You can also read