Selected Indicators of Health and Wellbeing in Whitehorse 2021 - Shaping Whitehorse
←
→
Page content transcription
If your browser does not render page correctly, please read the page content below
Shaping Whitehorse

  Selected Indicators of
Health and Wellbeing in
      Whitehorse 2021
All figures are based on 2016 Census of Population and Housing except
where specified.
Prepared by the Community Development Department, Whitehorse City Council.
March 2021

Enquiries may be directed to CDEnquiries@whitehorse.vic.gov.au or contact
Council on 03 9262 6333.

2
Contents
Introduction ......................................................................................................................................... 4
Demographic Profile ............................................................................................................................ 5
    Our changing population ................................................................................................................ 5
    At the last Census ............................................................................................................................ 6
    Where people were born................................................................................................................ 7
    Language diversity ........................................................................................................................... 7
    People needing assistance .............................................................................................................. 8
    Areas of advantage and disadvantage ........................................................................................... 8
Ages and Stages ................................................................................................................................... 9
Healthy Start in Life ........................................................................................................................... 10
    % early years learning                 % MCH attendance Child abuse cases ............................................. 10
Healthful Behaviours ......................................................................................................................... 11
    Sport participation               Alcohol & medication admissions                              % inactivity ............................... 11
Healthy Relationships ........................................................................................................................ 12
    % school participation                   Attend parenting programs Family violence rates ......................... 12
Mental Health and Wellbeing ........................................................................................................... 13
    % women anxiety/depression                        Self-rated health                  % men suicide ..................................... 13
Health Protection .............................................................................................................................. 14
    Primary care access                % immunisation Chlamydia reports ...................................................... 14
Personal Safety .................................................................................................................................. 15
    % crime                 % falls            Feeling safe ...................................................................................... 15
Healthy Ageing ................................................................................................................................... 16
    % volunteering              Learning participation Abuse risks ................................................................. 16
Fair and Equal Society ....................................................................................................................... 17
    % digital access            % youth employment                    % housing affordability .......................................... 17
Social Cohesion .................................................................................................................................. 18
    % helpful & trustworthy                     % volunteer work                    Racist incidents ........................................ 18
Neighbourhood Liveability ................................................................................................................ 19
    % open space              Infrastructure access Walkable for transport ................................................ 19
Climate Change Mitigation ............................................................................................................... 20
    % waste               % tree canopy                   % asthma .............................................................................. 20
List of Health and Wellbeing Indicators ........................................................................................... 21

3
Introduction
Health and wellbeing mean different things to each of us. It may involve being able
to go cycling or walking in our neighbourhood. Or it could be having supportive
and nurturing relationships. When there are challenges in life, such as we’ve all
experienced during the COVID-19 pandemic, it could mean our own or collective
resilience in the face of difficulties.

As there is no single way of telling whether we have achieved “health and
wellbeing” it helps to look at a broad range of things (indicators) that influence
this. The diagram below shows how we can think of these influences as
surrounding us in everyday life.

                                 Source: Victorian public health and wellbeing plan 2019–20231

Presented on the following pages are selected2 indicators with their detailed
measures (the data) to tell us how, as a community, we are faring in the City of
Whitehorse. In many ways, Whitehorse is a healthy place to live - most people
reporting their health as excellent, very good or good3 – but there is always room
for improvement.

1 Adapted from original model by Dahlgren G, Whitehead M 1991, Policies and strategies to promote social equity in health, Institute for Futures
Studies, Stockholm. VPHWP available at https://www2.health.vic.gov.au/about/health-strategies/public-health-wellbeing-plan
2 See full list of indicators
3 80.5% of women and 78.5% of men. From Victorian Agency for Health Information (2019), Victorian Population Health Survey 2017.

4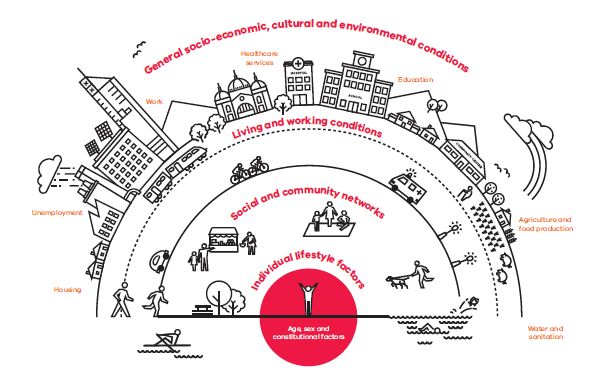
Demographic Profile
Our changing population4

                                                                               2041
                                                             2021              229,324
                                                             185,300
                                      2019
                                      178,739
Between the last Census in 2016 and 2041, the population for the City of Whitehorse is forecast to
increase by 59,683 persons (35.18% growth), at an average annual change of 1.21%.

Due to COVID-19 this forecast will be impacted by a number of factors including: closure of borders to
overseas migration; greater levels of financial insecurity affecting birth rates and increasing the
likelihood of people moving to affordable growth areas, regional centres and peri-urban areas.

                  Age groups forecast percentage change, 2016 to 2041
                                 Elderly aged…                                    0.1%

                                       Seniors…                                          0.6%

                 Empty nesters and retirees…                  -0.4%

             Older workers and pre-retirees…               -0.5%

                  Parents and homebuilders…                    -0.3%
                                                                                                0.8%
                            Young workforce…

      Tertiary education and independence…                                                0.6%

                        Secondary schoolers…                                     0.1%
                                                   -0.8%
                           Primary schoolers…

                   Babies and pre-schoolers…                           -0.2%

                                              -0.8%                    -0.3%      0.2%    0.7%

4
    Based on .id Consulting Population Forecasts 2020
5
Household types forecast percentage change,
                                 2016 to 2041
    40%                  Dominant
                       household type
    35%                                                            Largest forecast increase
                                                                            (1.6%)
    30%

    25%

    20%

    15%

    10%

    5%

    0%
          Couple families Couples without     Group       Lone person    One parent     Other families
          with dependents dependents        households    households       family

                                                 2016    2041

At the last Census

Males                                                     78,051         48.2%           < Melbourne

Female s                                                  84,032         51.8%           > Melbourne

Aboriginal and Torres Strait Islander people              358            0.2%            < Melbourne

6
Where people were born

                    Elsewhere
                      40.2%

                                                       Australia
                                                        59.8,%

Born in Australia                           92,759   59.8 %        Melbourne
Mandarin 12.9%

Cantonese 5.3%

Greek 2.5%

Italian 1.4%

Vietnamese 1.3%

7
People needing assistance5
Need for assistance with core activities 7,628 4.7% Melbourne
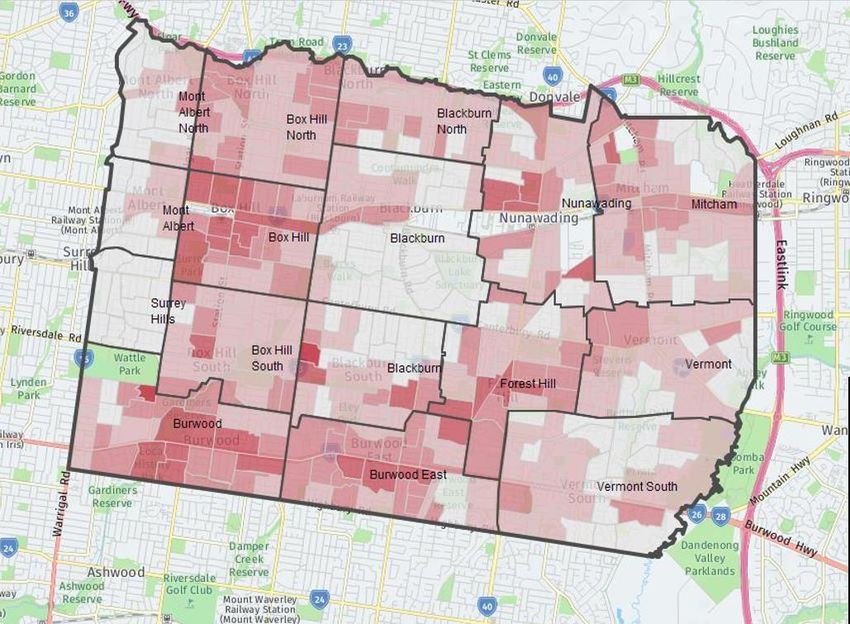
Areas of advantage and disadvantage6
Lighter red = more advantaged Darker red = more disadvantaged
5 Australian Bureau of Statistics (2018) Survey of Disability, Ageing and Carers, Australia: Summary of Findings, Australia, 2019.
6 Based on .id Consulting Population Forecasts 2020
8Ages and Stages
The health and wellbeing needs in Whitehorse reflect the different ages and stages of its people
as well as changes in the population7 over time.
Early Years: people aged less than 12 years
Forecasts for 2026
0-4 years increase by 1,435
5-11 years increase by 826
Nurturing family, educational and care settings
important for development
High levels of participation in Council’s child health Young People: aged 12-24 years
services Forecasts for 2026
Child abuse reports lower than Victoria 12-17 years increase by 2,558
18-24 years increase by 5,436
Learning relationship and work skills for
adulthood
13.7 to 12.9% Over 75% of mental health problems occur
Early Years before the age of 25
Education and employment disrupted by
COVID-19
18.1 to 19.5%
Young People
Adults: people aged 25-64 years
Ages and
Forecasts for 2026
Stages
25-39 years increase by 9,053
51.3 to 51.3%
40-64 years increase by 5,940
Adults
Behaviours influence risk of developing
chronic disease
Nearly half don’t do enough exercise and
most don’t eat enough vegetables
16.9 to 16.4% 1 in 5 experience anxiety or depression
Older Adults
Older Adults: people aged over 65 years
Forecasts for 2026
65-79 years increase by 2,672
80 years and over increase by 1,231
More than 30 % of people aged 65+ are born overseas
Active working, learning, volunteering and grand-parenting
Falls and likelihood of dementia increase with age
Risk factors for elder abuse exacerbated by COVID-19
7
Shown here comparing 2016 population figures to forecasts for 2026. Based on .id Consulting Population Forecasts 2020
9Healthy Start in Life
The early years, pregnancy to eight years, are a period of rapid cognitive, biological
and social development and the most critical in influencing a person’s health and
wellbeing throughout life.
The environment in which a child spends these early years – the family,
educational and care settings as well as the broader community – strongly shapes
whether or not they have strong foundations for their future health, wellbeing and
development.
In Whitehorse, the majority of our children get a great start to life. For some
though, their damaging early childhood experiences leave lasting effects.
What do we observe?
% early years learning % MCH attendance Child abuse cases
In Whitehorse, participation of three and a half year old children in Maternal Child Health (MCH)
childhood services was 67.8% in 2015 compared to the Victorian rate of 66.1%.8
Early Learning participation in Whitehorse is 100.6%9 , compared to Victoria at 98.1%.10
Across Australia children are present in between 36 – 59% of family violence incidents.11
In 2014 Whitehorse had a rate of 4.2 per 1,000 children of substantiated child abuse cases for
children aged 1-17 years, compared with 9.2/1,000 for Victoria.12
8 Department of Health and Human Services (2015) Whitehorse Community Profile.
9
This figure is higher than 100% reflecting participation in Whitehorse kindergartens by children living outside the municipality.
10 Department of Health and Human Services (2015) Whitehorse Community Profile.
11 Richards K 2011. Children’s exposure to domestic violence in Australia. Trends & issues in crime and criminal justice, no. 419. Canberra: Australian
Institute of Criminology. https://www.aic.gov.au/publications/tandi/tandi419
12 City of Greater Dandenong and the Victorian Local Government Association (2020). Statistical data for Victorian communities.
https://www.greaterdandenong.vic.gov.au/about-us/statistics-and-data
10Healthful Behaviours
Often referred to as lifestyle, the things we do every day have a powerful influence
on our physical health and mental wellbeing.
Adequate physical activity, consumption of fresh food, particularly fruit and
vegetables, and maintaining a healthy weight, avoidance of smoking and moderate
or low use of alcohol all contribute to a healthy lifestyle and reduce the risk of
chronic disease. Cardiovascular diseases, type 2 diabetes and many cancers are
largely preventable.
In Whitehorse, as for the rest of Victoria, chronic disease is the most significant
health challenge for the population overall.
What do we observe?
Sport participation Alcohol & medication admissions % inactivity
In Whitehorse, more than one in four residents suffered from at least one chronic disease (45.6%).13 In
2017, 46.9% of adults in Whitehorse were considered overweight or obese, compared to 38.7% in
2014.14 Nearly half of people living in Whitehorse (46.6%) were insufficiently active for good health in
2017 compared to 44.1% of Victorians overall. Only 5.3% of people eat enough vegetables.
The rate of participation in sport in Whitehorse in 2017 was 16.95% compared to the Victorian rate of
15.4%.15 In the financial year 2018/2019, 1,633,693 people visited Whitehorse City Council aquatic
facilities.16
Our alcohol and pharmaceutical drug hospitalisation admission rates in 2017/2018 were higher than
Victoria’s and were higher than those for the previous financial year.17 More than half the population
(55.3%) have an increased lifetime risk of alcohol-related harm.18
13 Victorian Agency for Health Information (2019). Victorian Population Health Survey 2017
14 Victorian Agency for Health Information (2019). Victorian Population Health Survey 2017
15 Australian Bureau of Statistics (2016). Population by Age and Sex, Regions of Australia, Cat. No.3235.0. 28 August 2017.
16 Whitehorse City Council 2018/2019 Annual Report
17 Turning Point Victoria (2020). AOD Stats. https://www.aodstats.org.au/index.php
18 Victorian Agency for Health Information (2019). Victorian Population Health Survey 2017
11Healthy Relationships
Effective parenting and healthy family and peer relationships provide the
foundations for young people to develop and grow and enjoy a full, active and
rewarding life.
Learning effective social skills at home, school, sport and other settings is essential
for young people as they embark into the workforce and intimate relationships.
Young people’s participation in education is vital for their future prospects.
Parents are continually learning skills in communicating and responding to their
children and understanding the issues facing young people today.
What do we observe?
% school participation Attend parenting programs Family violence rates
Secondary school retention rates are higher in Whitehorse, with 97.4% of 19 year olds having
completed Year 12, in comparison to the Victorian State average of 88.2%.19
Parenting forums held by Whitehorse City Council were attended by 466 people in 2018 and 387 in
2019.
In Whitehorse, 1,302 family violence incidents were reported in 2019/2020; an average of 25 incidents
every week.20 It is estimated that only 25% of family violence incidents are reported to police.21
Therefore the number of family violence incidents in Whitehorse may be closer to more than 5,200
per year (or 100 incidents per week).
19
Department of Health and Human Services (2015). Whitehorse Community Profile.
20 Crime Statistics Agency (2020). https://www.crimestatistics.vic.gov.au/family-violence-data-portal/family-violence-data-dashboard/victoria-police
21Hutcheson, E. (2017). Family Violence in the Southern Metropolitan Region – a data analysis. Executive Summary. Southern Metropolitan Region
Integrated Family Violence Executive Committee.
12Mental Health and Wellbeing Mental health is an essential ingredient of individual and community wellbeing and significantly contributes to the social, cultural and economic life of Whitehorse. Resilience is the ability to cope with the usual stressors of life and is critical to good mental health. Psychological distress is a measure for the overall mental health and wellbeing of the population. The COVID-19 pandemic and necessary restrictions on community life over 2020 have had a profound impact on people’s mental health and wellbeing. In the months and years ahead we are likely to see significant changes in current measures. What do we observe? % women anxiety/depression Self-rated health % men suicide In Whitehorse 80.5% of women and 78.5% of men rated their health as “excellent”, “very good” or “good” in 2017.22 In Whitehorse, 20.6% of people experience anxiety or depression; 23.6% are female and 17.2% are male.23 Suicide continues to be the leading cause of death for young Australians.24 The suicide rate for males is approximately three times that of females, and is markedly higher across all age groups.25 The resilience measure [range 0–8] for Whitehorse in 2015 in terms of ‘ability to adapt to change’ and ‘tendency to bounce back after illness or hardship’ was 6.1 compared to 6.4 for Victoria. 26 22 Victorian Agency for Health Information (2019). Victorian Population Health Survey 2017 23 Victorian Agency for Health Information (2019). Victorian Population Health Survey 2017 24 Australian Institute of Health and Welfare (2020). Suicide and intentional self-harm. 25 Australian Institute of Health and Welfare (2020). Suicide and intentional self-harm. 26 VicHealth (2016). VicHealth Indicators Survey 2015 Selected findings, VicHealth, Melbourne. 13
Health Protection

Due to our experience with the COVID-19 pandemic we’ve all learned more about
how easily germs can spread and that public health measures are important.

Individuals and communities can take actions to help protect themselves from
diseases and other harms in the environment.

Good hygiene, correct food storage, reducing the use of antibiotics, being
immunised against infectious diseases, using sun protection, condoms and having
regular health screening checks all help to reduce our risks.

What do we observe?

     Primary care access                                % immunisation                               Chlamydia reports

Children fully immunised at one, two and five years across Whitehorse in 2020 was higher than
Victoria as a whole. 96.8% of 5 year olds in Whitehorse are fully immunised.27

People in Whitehorse have good access to primary care with 0.3 General practice clinics per 1,000
population (equal to Victorian ratio) and 1.1 Allied health service sites per 1,000 population (compared
to Victoria with 0.9/1,000).28

In Whitehorse communicable diseases reported during 2019 included 444 cases of chlamydia (223
male and 221 female).29 Victoria disease trends in notifications of chlamydia show that cases have
continued to increase and for the first time, in 2017 there were more male than female cases
notified.30

27 Australian Government (2021). Victorian Childhood Immunisation Data by SA3, Department of Health.
28 Victorian Government (2015). LGA Profile 2015. Department of Health and Human Services
29 Victorian Government (2020). Health.vic interactive infectious disease reports
30 Victorian Government (2017). Victorian Annual Surveillance Factsheet, 2017: Sexually transmissible infections: Chlamydia, gonorrhoea and syphilis,

Department of Health and Human Services.
14
Personal Safety
Feelings or perceptions of safety affect how people move around and freely access all
aspects of the municipality – transport, open spaces, activities and facilities. Whitehorse
is a relatively safe community, and crime rates in Whitehorse are lower than the
Eastern Metropolitan and State averages.
Falls are the leading cause of unintentional injury in older Australians. As our population
ages and the number of older people grows, the likelihood of more falls and fall-related
hospitalisation increases.
What do we observe?
% crime % falls Feeling safe
Ninety-six per cent of people feel safe on Whitehorse streets, walking alone during the day.31
However people in Whitehorse feel less safe walking alone at night, particularly women and older
people, than during the day. 56.8% of residents felt safe or very safe when walking alone at night.32
The rate of alleged crimes against the person in Whitehorse in 2020 was 513.2 per 100,000 people,
which is also lower than for Metropolitan Melbourne (571.3/100,000).33
In Whitehorse the percentage of unintentional injuries caused by falls is the third highest in the state
(45.9% compared to the Victorian average of 38.7%).34 In Victoria, falls were the leading cause of
injury among admissions (47.3%) and emergency department presentations (37.3%). Females
accounted for more of these presentations than males in the 65 years and older group.35
31 VicHealth (2016). VicHealth Indicators Survey 2015 Selected findings, VicHealth, Melbourne.
32 VicHealth (2016). VicHealth Indicators Survey 2015 Selected findings, VicHealth, Melbourne.
33 Crime Statistics Agency (2020). Recorded Offences by LGA.
34 Victorian Government (2015). LGA Profile 2015. Department of Health and Human Services
35 Hayman J, Berecki-Gisolf J. (2020). Unintentional Hospital Treated Injury Victoria 2018/19 E-bulletin Edition 21 April 2020.
15Healthy Ageing
Older people in Whitehorse are busy working, volunteering, learning and grand-
parenting; they have a wealth of knowledge, experience and active contribution to
the wellbeing of the community. The interconnectedness of physical and mental
health plays out strongly for older people.
Discrimination, known as ageism, is the biggest hurdle to a positive experience of
older age.
Ageism, along with other factors, puts older people at risk of elder abuse which
may be physical, financial or emotional. The COVID-19 pandemic has increased the
risk factors for elder abuse.
What do we observe?
% volunteering Learning participation Abuse risks
In Whitehorse, more than 1 in 5 people in Whitehorse report volunteering (22.4%), compared
with 19.2% for Victoria. Over 21% of Victorians aged 65 to 74 years volunteer.36
U3A Nunawading (the largest in Whitehorse and further afield) membership reached a peak of
2,112 members in March 2020 just before classes were closed due to COVID-19.37
Risk factors of elder abuse such as social isolation, less access to health care and exercise, more
reliance on the use of technology, financial stress and carer stress have increased due to the
COVID-19 response.38 In Whitehorse in 2020 there were 804 violent crime victim reports for
persons aged 55+.39
36 Volunteering Victoria (2018). Information sheet: Key facts and statistics about volunteering in Victoria, 2016 Census Update (January 2018)
37 U3A Nunawading (2020). Annual Report 2019-2020.
38 Parkinson, D., O’Halloran, K. & Dinning, J. (2020). The impact of COVID-19 pandemic response on older people. Melbourne, Victoria: Respect Victoria.
39 Crime Statistics Agency (2020), Victim Reports
16Fair and Equal Society
The City of Whitehorse is a wonderful place to live, work, study and do business.
We enjoy some of the best living conditions in the world.
However, not everyone enjoys equal access to employment, safe and secure
housing and health services. Things many of us take for granted. Housing plays a
critical role in ensuring people can fully engage in community life, both
economically and socially.
The COVID-19 pandemic has exacerbated existing social disparities, such as the
lack of access to digital information.
What do we observe?
% digital access % youth employment % housing affordability
Whitehorse has greater social disparity with more high income earners and more low income earners
than other local government areas.
In December 2020, only 1.4% of rental housing in Whitehorse was considered affordable, in
comparison to the Victorian average of 11.4%.40
The median weekly incomes in Whitehorse are $498 for females and $798 for males.
Unemployment is highest among our young people aged 15 to 24 years. In 2016, 5% of 15-24-
year-olds in Whitehorse were not in employment or education. During the height of COVID-19
lockdown restrictions between March and November 2020 the number of JobSeeker and youth
allowance recipients in Whitehorse increased by 159% (4,291 recipients).41
Eleven per cent of households in Whitehorse have no internet connection.
40 Victorian Government (2020). DHHS Rental Report, December Quarter, 2020.
41 Department of Social Services (2020). JobSeeker and Youth Allowance recipients - monthly profile on https://www.dta.gov.au/
17Social Cohesion Social cohesion means we all feel connected to our community and have a sense of belonging. Helping others and contributing to the community is a valued way of life in Whitehorse. During the COVID-19 pandemic neighbours and local community faith and volunteer organisations have responded by providing support, food and material aid. In the City of Whitehorse people have good access to sport, recreation and leisure, educational and cultural opportunities that bring us together to share interests and make new friends. We know that discrimination and abuse of others weaken community cohesion and a sense that we are all welcome in Whitehorse. What do we observe? % helpful & trustworthy % volunteer work Racist incidents In Whitehorse people believe others are willing to help each other (77.2%) and can be trusted (76.2%), higher than Victorian rates.42 The pandemic may increase these measures. Nearly a quarter of people living in Whitehorse (22.4%) did voluntary work through an organisation or group in the last 12 months. This is significantly higher than metropolitan Melbourne overall (17.6%). Racist incidents have risen in Australia under COVID-19. At the start of the pandemic in February 2020, the Australian Human Rights Commission recorded more complaints under the Racial Discrimination Act than at any time during the previous twelve months.43 42 Victorian Agency for Health Information (2019). Victorian Population Health Survey 2017 43 Australian Human Rights Commission (May). https://humanrights.gov.au/about/news/opinions/wheres-alldata-covid-19-racism 18
Neighbourhood Liveability

A liveable neighbourhood is one that is safe, accessible and attractive, and
provides good connectivity so that we can easily get to the services and places we
want to go – for example, schools, shops, health care and transport.

The natural bushlands, parks and open spaces of Whitehorse make it a highly
attractive place to live. It offers places where people can connect with nature and
each other.

People benefit from access to public transport and good quality walking and
cycling tracks, which in turn reduces the impact on our environment.

What do we observe?

           % open space                                Infrastructure access   Walkable for transport

Whitehorse has a Social Infrastructure Indexi of 7.5 (this score is in the 59th percentileii; range from 2.2
to 11.2 out of a maximum score of 16).44

Half of the dwellings in Whitehorse are within 400m of public space larger than 1.5 hectares in 2018
(59th percentile; Range from 0.0 to 100.0%).45

Whitehorse is attractive, with approximately 64 square kilometres in area, and almost 10% of that area
is managed by Council as community open space; including parks and gardens, streetscapes and
community facilities.46

Whitehorse has a Walkability for Transport Index of 0.4 (this is in the 65th percentile; range from -2.1
to 1.7) and 26.7% of people both live and work in Whitehorse and many more do so in the
surrounding municipalities. 47 Working from home as a result of the pandemic is likely to significantly
change this measure.

44 Australian Urban Observatory (2018). https://auo.org.au/
45 Australian Urban Observatory (2018). https://auo.org.au/
46 Whitehorse City Council (2014). Urban Biodiversity Strategy 2014-2024.
47 Australian Urban Observatory (2018). https://auo.org.au/

19
Climate Change Mitigation
Climate change affects our health in many ways; directly by increases in extreme
weather events such as long heatwaves and indirectly through worsening air
quality, changes in the spread of infectious diseases, risks to food safety and
drinking water quality and mental health problems.
Reducing waste as well as recycling and composting materials helps to reduce the
generation of greenhouse gases, such as carbon dioxide and methane.
Tree cover canopy can help to reduce the urban heat island effect and the health
impacts of heat waves, as well as reducing UV exposure.
What do we observe?
% waste % tree canopy % asthma
Existing canopy cover in Whitehorse has been estimated at between 22 and 26%. Below 30% there is
generally not enough canopy cover to fully achieve all the benefits of the urban forest.48
In 2019/20 3,307 new trees were planted by Council in the municipal area.49
The Whitehorse community diverted approximately 51% of kerbside waste from landfill for a number
of years leading up to 2018, which is well above the state average of 45%.50
People of Asian or Indian background may be at higher risk of future thunderstorm asthma hospital
admissions.51 In Whitehorse 19.9% of the adult population have been diagnosed with asthma at some
time in their life.
48 Whitehorse City Council (2018). Urban Forest Strategy 2018-2021.
49 Whitehorse City Council (2019). Whitehorse City Council Annual Report, 2019/20.
50 Whitehorse City Council (2018). Waste Management Strategy 2018 – 2028.
51 Thien F, Beggs P, Csutoros D et al (2018). The Melbourne epidemic thunderstorm asthma event 2016: an investigation of environmental triggers, effect
on health services, and patient risk factors. Lancet Planet Health 2018; Vol 2 June 2018 e255
20List of Health and Wellbeing Indicatorsiii
Theme/Outcome Indicator Measure/s Reference
Mental Health and
Self-rated health Fair or poor self-reported health 2017 Victorian Population Health Survey
Wellbeing
Self-rated health - women Excellent, very good or good 2017 Victorian Population Health Survey
Self-rated health - men Excellent, very good or good 2017 Victorian Population Health Survey
Resilience [range 0–8]; ‘ability to adapt to change’ and
Community resilience 2015 Vic Health Indicators Survey Results
‘tendency to bounce back after illness or hardship’.
Psychological distress High, or very high, levels of psychological distress 2017 Victorian Population Health Survey
Anxiety or depression 2017 Victorian Population Health Survey
Sought help for a mental health related problem 2017 Victorian Population Health Survey
Intentional self-harm standardised death rate per
Suicide 2019 ABS Causes of Death, Australia, Cat. No. 3303.0
100,000 people
Connection to culture and Perceptions of neighbourhood – this is a close-knit
Social Cohesion 2015 Vic Health Indicators Survey Results
communities neighbourhood
Perceptions of neighbourhood – people are willing to
2015 Vic Health Indicators Survey Results
help each other
Perceptions of neighbourhood – people can be trusted 2015 Vic Health Indicators Survey Results
Estimated number of people aged 18 years and over
Discrimination or unfair who, in the past 12 months, felt that they had
2014 PHIDU Social Health Atlases of Australia
treatment experienced discrimination or have been treated unfairly
by others (per 100)
Estimated number of people aged 18 years and over
Acceptance of other cultures who disagree/strongly disagree with acceptance of other 2014 PHIDU Social Health Atlases of Australia
cultures (per 100)
Did voluntary work through an organisation or group
Volunteer participation 2016 ABS Census of Population and Housing
(last 12 months)
Personal Safety Perceptions of safety Perceptions of safety – walking alone during day 2015 Vic Health Indicators Survey ResultsPerceptions of safety – walking alone after dark 2015 Vic Health Indicators Survey Results
2020 Crime Statistics Agency, Recorded Offences by
Crime against the person Rate of recorded crimes against a person per 100,000
LGA
Unintentional injuries treated in hospital per 1,000
Unintentional injuries 2015 DHHS Whitehorse Community Profile
population
Unintentional injuries due to falls 2015 DHHS Whitehorse Community Profile
Family violence/intimate 2019 Crime Statistics Agency, Family Violence Data
Healthy Relationships Family violence incidents per 100,000 population
partner violence Portal
Victim reports for persons aged 55+ (violence against
Elder abuse 2020 Crime Statistics Agency, Victim Reports
the person)
City of Greater Dandenong and the VLGA (2020).
Statistical data for Victorian communities.
Child abuse Child Abuse reports
https://www.greaterdandenong.vic.gov.au/about-
us/statistics-and-data
Neighbourhood 2020 Crime Statistics Agency, Criminal Incidents Rate
Criminal incident rate per 100,000 population
Liveability Safety per 100,000
2018 Vic Roads Road Trauma Statistics by Local
Death rate due to road traffic crashes
Government Area
2018 Vic Roads Road Trauma Statistics by Local
Pedestrian fatalities 2014-2018
Government Area
Rate of recorded crimes against a person per 100,000
-
(ref. Personal Safety)
Family violence incidents per 100,000 population (ref.
-
Healthy Relationships)
Social connection and
See measures for Social Cohesion -
inclusion
Walkability Average street connectivity per square kilometre 2018 Australian Urban Observatory
Average number of daily living destinations present (0-3)
2018 Australian Urban Observatory
within 1600m
22Walkability for Transport Index - calculated as the sum of
standardised scores of local neighbourhood attributes
2018 Australian Urban Observatory
including street connectivity, dwelling density and the
index of access to services of daily living.
Average distance to closest activity centre 2018 Australian Urban Observatory
Both live and work in Whitehorse 2016 ABS Census of Population and Housing
Number of public drinking fountains (data not sourced) -
Green and open space Number of new trees planted 2019/20 Whitehorse City Council Annual Report
2014 Benchmarking Australia’s Urban Tree Canopy: An
i-Tree Assessment. Prepared for Horticulture Australia
Urban tree canopy coverage
Limited by the Institute for Sustainable Futures,
University of Technology Sydney
Percentage of people who rated their community as a
2015 DHHS Whitehorse Community Profile
pleasant environment
Whitehorse City Council (2014). Urban Biodiversity
Ratio of open space
Strategy 2014-2024.
Percentage of dwellings within 400m or less distance of
2018 Australian Urban Observatory
Access to public open space public open space
Percentage of dwellings within 400m of public space
2018 Australian Urban Observatory
larger than 1.5 hectares
Average distance to closest public open space larger
2018 Australian Urban Observatory
than 1.5 hectares within 3200 metres
Environmental sustainability Total residual waste collected (annual tonnes collected) 2018/19 Sustainability Victoria Kerbside Waste Data
Total commingled recyclables collected (annual tonnes
2018/19 Sustainability Victoria Kerbside Waste Data
collected)
Total garden organics collected (annual tonnes
2018/19 Sustainability Victoria Kerbside Waste Data
collected)
Housing diversity & Percentage of households in housing stress 2016 ABS Census of Population and Housing
affordability
Percentage of available affordable lettings 2020 Rental Report December Quarter
23Percentage of households in the bottom 40% of incomes
2018 Australian Urban Observatory
spending more than 30% on housing costs
Food security (access) Percentage of dwellings within 1km of a supermarket 2018 Australian Urban Observatory
Percentage of dwellings without any food outlet within
2018 Australian Urban Observatory
3.2km
Average distance to closest healthy food outlet
2018 Australian Urban Observatory
(supermarket or greengrocer)
Average distance to closest fast food outlet 2018 Australian Urban Observatory
Social Infrastructure Index (access to social
infrastructure calculated based on six measures:
Community Centres, Culture and Leisure, Early Years,
Health and community
Education, Health and Social Services and Sport and 2018 Australian Urban Observatory
services
Recreation. These are measured by 16 individual service
types which are used to calculate the presence of
service mix within a threshold distance.
People who could definitely access community services
2015 DHHS Whitehorse Community Profile
and resources
General practice clinics per 1,000 population 2015 DHHS Whitehorse Community Profile
Pharmacies per 1,000 population 2015 DHHS Whitehorse Community Profile
Leisure and cultural Attendance at Council’s festivals and events 2018/19 Whitehorse City Council Annual Report
opportunities
Visitors to aquatic facilities 2018/19 Whitehorse City Council Annual Report
Visitors to libraries 2018/19 Whitehorse City Council Annual Report
Visitors to Box Hill Community Arts Centre 2018/19 Whitehorse City Council Annual Report
Visitors to Whitehorse ArtSpace 2018/19 Whitehorse City Council Annual Report
Public transport Average distance to closest public transport stop 2018 Australian Urban Observatory
Percentage of dwellings within 400m of a public
transport stop with a regular service at least every 30 2018 Australian Urban Observatory
minutes on weekdays between 7am and 7pm
Percentage of dwellings with access to bus stopAlcohol availability Average number of off-licences within 800m 2018 Australian Urban Observatory
Average number of on-licences within 400m 2018 Australian Urban Observatory
Average distance to closest off-licence alcohol outlet 2018 Australian Urban Observatory
Average distance to closest on-licence alcohol outlet 2018 Australian Urban Observatory
Cycling infrastructure km of off-road shared paths Whitehorse City Council
km of on-road bike lanes Whitehorse City Council
km of on-road bike connections Whitehorse City Council
Employment/labour market Percentage of employed persons who live and work in
Fair and Equal Society 2018 Australian Urban Observatory
participation the local area (SA1 in SA3)
Smoothed unemployment rate Small Area Labour Markets Dec Qtr 2020
Percentage who completed a higher education
2016 ABS Census of Population and Housing
Education qualification
Percentage of Year 9 students achieving national 2017 Victorian Child and Adolescent Monitoring System
benchmark in literacy (VCAMS) Indicators
Percentage of Year 9 students achieving national 2017 Victorian Child and Adolescent Monitoring System
benchmark in numeracy (VCAMS) Indicators
Perceptions of neighbourhood – this is a close-knit
neighbourhood (Ref. Connection to culture and -
Social cohesion/inclusion communities)
Perceptions of neighbourhood – people are willing to
help each other (Ref. Connection to culture and -
communities)
Perceptions of neighbourhood – people can be trusted
-
(Ref. Connection to culture and communities)
Social Infrastructure Index: measured by 16 individual
service types including Community Centres, Culture and
Leisure, Early Years, Education, Health and Social
Access to social support 2018 Australian Urban Observatory
Services and Sport and Recreation which were used to
calculate the presence of service mix within a threshold
distance.
People who could definitely access community services
2015 DHHS Whitehorse Community Profile
and resources
25Percentage of households in the lowest equivalised
Financial security 2016 ABS Census of Population and Housing
household income quartile
Percentage of households in housing stress 2016 ABS Census of Population and Housing
People who delayed medical consultation, unable to
2015 DHHS Whitehorse Community Profile
afford
People who delayed purchasing prescribed medication,
2015 DHHS Whitehorse Community Profile
unable to afford
% of population experiencing food insecurity and
Food security (affordability) -
hygiene insecurity (data not sourced)
% of every $1 spent on discretionary food (data not
-
sourced)
Low gender equality score (level of agreement that 'men
should take control in relationships and be the head of
Gender equity 2015 Vic Health Indicators Survey Results
the household' and 'women prefer a man to be in charge
of the relationship')
Female median weekly income 2016 ABS Census of Population and Housing
Male median weekly income 2016 ABS Census of Population and Housing
Females undertaking 30+ hours of unpaid domestic work
2016 ABS Census of Population and Housing
each week
Males undertaking 30+ hours of unpaid domestic work
2016 ABS Census of Population and Housing
each week
Females employed full-time 2016 ABS Census of Population and Housing
Males employed full-time 2016 ABS Census of Population and Housing
Percentage of females in a managerial position 2016 ABS Census of Population and Housing
Percentage of males in a managerial position 2016 ABS Census of Population and Housing
Digital access Percentage of households with no internet connection 2016 ABS Census of Population and Housing
Children developmentally vulnerable in one or more
Healthy start in life Developmental vulnerability 2018 Australian Early Development Census
domains
Children developmentally vulnerable in two or more
2018 Australian Early Development Census
domains
Birth weight Babies with low birth weight 2015 DHHS Whitehorse Community Profile
26Children attending 3.5 year old maternal and child
Participation in MCH 2015 DHHS Whitehorse Community Profile
health checks
Participation in Kindergarten Kindergarten participation 2015 DHHS Whitehorse Community Profile
Participation in Primary Number of full-time equivalent students enrolled in 2020 Department of Education and Training, Summary
School schools Statistics Snapshot Victorian Schools, February 2019
Healthy ageing Ageism No data defined -
Victim reports for persons aged 55+ (ref. Healthy
Elder abuse -
Relationships)
Independent living Need for assistance with core activities 2016 ABS Census of Population and Housing
Healthful behaviours Healthy eating Complied with vegetable consumption guidelines 2017 Victorian Population Health Survey
Complied with fruit consumption guidelines 2017 Victorian Population Health Survey
Daily consumer of sugar sweetened soft drinks 2017 Victorian Population Health Survey
Take-away food consumed > 1 day/week 2017 Victorian Population Health Survey
Pre-obese or obese 2017 Victorian Population Health Survey
Active living Insufficiently physically active 2017 Victorian Population Health Survey
Sedentary (inactive) 2017 Victorian Population Health Survey
Smoking Current (i.e. daily or occasional) smoker 2017 Victorian Population Health Survey
Alcohol misuse Increased lifetime risk of alcohol-related harm 2017 Victorian Population Health Survey
Increased risk of injury from a single occasion of drinking 2017 Victorian Population Health Survey
Alcohol hospitalisation admission rate 2017/2018 AODStats Victoria
Prescription medications
Pharmaceutical Drugs (any) hospital admission rate 2017/2018 AODStats Victoria
misuse
Drug usage and possession offences per 1,000
Illicit drug use 2015 DHHS Whitehorse Community Profile
population
Illicit drugs (any) hospital admission rate 2017/2018 AODStats Victoria
Proportion of adult population with excellent or very
Oral health care 2017 Victorian Population Health Survey
good self-reported dental health status
Dental service sites per 1,000 population 2015 DHHS Whitehorse Community Profile
Poor dental health 2015 DHHS Whitehorse Community Profile
27Presence of chronic disease People reporting arthritis 2017 Victorian Population Health Survey
People reporting cancer 2017 Victorian Population Health Survey
People reporting type 2 diabetes 2017 Victorian Population Health Survey
People reporting heart disease 2017 Victorian Population Health Survey
People reporting stroke 2017 Victorian Population Health Survey
People reporting osteoporosis 2017 Victorian Population Health Survey
More than one in five residents suffered from two or 2017 Victorian Population Health Survey
more chronic diseases
Health protection Access to primary care General practice clinics per 1,000 population 2015 DHHS Whitehorse Community Profile
Allied health service sites per 1,000 population 2015 DHHS Whitehorse Community Profile
2016/17 Australian Institute of Health & Welfare,
Immunisation Children who were fully immunised at 12-15 months Immunisation rates for children in 2016–17, Cat. no:
HPF 16
Number of vaccinations delivered to children in public
2018/19 Whitehorse City Council Annual Report
immunisation program
% of population with flu vaccination (data not sourced) -
Communicable diseases Notifications of chlamydia per 100,000 population 2015 DHHS Whitehorse Community Profile
Rate of sexually transmissible infections in young people 2012 Victorian Child and Adolescent Monitoring System
aged 12-17 (VCAMS) Indicators
2020 DHHS Local Government Areas Surveillance
Rate of newly acquired Hepatitis B cases per 100,000
Report
Emergency management / Number of Community Emergency Risk Assessment
Whitehorse City Council
preparedness (CERA) risk treatments completed
Drug resistance Antibiotic prescription rates (LGA data not available) -
Rate of salmonellosis (salmonella food poisoning) per 2020 DHHS Local Government Areas Surveillance
Food safety
100,000 residents Report
Hygiene measures / social
No data defined -
distancing
28Climate change Excess deaths during extreme heat and heatwaves (LGA The Health Impacts of the January 2014 Heatwave in
Health impacts
mitigation data not available) Victoria
Proportion of adult population ever diagnosed with
2017 Victorian Population Health Survey
asthma
Levels of high or very high psychological distress (ref.
-
Mental Health and Wellbeing)
Anxiety or depression (ref. Mental Health and
-
Wellbeing)
Urban greening Tree canopy/ shade (ref. Neighbourhood Liveability) -
Ratio open space (ref. Neighbourhood Liveability) -
Renewable energy use Solar panel installation (LGA data not available) -
i
Well-planned social infrastructure supports the liveability of communities by promoting walking and community social interaction. It is associated with improved physical and mental health
and resident’s satisfaction with the area in which they live. The Social Infrastructure Index (SII) developed by the Australian Urban Observatory measures 16 individual service types including
Community Centres, Culture and Leisure, Early Years, Education, Health and Social Services and Sport and Recreation which were used to calculate the presence of service mix within a
threshold distance.
ii
Percentiles indicate the percentage of scores that fall below a particular value. They tell you where a score stands relative to other scores. For example, if street connectivity average is at
the 56th percentile, this indicates this street connectivity average is higher than 56 percent of other scores – in this case other municipalities in Metropolitan Melbourne.
iii
Further information about the List of Indicators and Measures is available from the Whitehorse City Council, Community Development Department: CDEnquiries@whitehorse.vic.gov.au
29You can also read