Invasion stages and potential distributions of seven exotic terrestrial isopods in Japan - BioRisk
←
→
Page content transcription
If your browser does not render page correctly, please read the page content below
A peer-reviewed open-access journal
BioRisk 13: 53–76 (2018)
              Invasion stages and potential distributions of seven exotic terrestrial isopods in Japan
doi: 10.3897/biorisk.13.23514
https://biorisk.pensoft.net
                                                             RESEARCH ARTICLE                                             BioRisk53

                 Invasion stages and potential distributions
                 of seven exotic terrestrial isopods in Japan

                                       Shigenori Karasawa1, Kensuke Nakata2

1 Department of Life and Environmental Agricultural Sciences, Faculty of Agriculture, Tottori University,
4-101 Koyama-machi Minami, Tottori 680-8553, Japan 2 Kyoto Women’s University, Kitahiyoshi-cho 35,
Higashiyama-ku, Kyoto 605-8501, Japan

Corresponding author: Shigenori Karasawa (dojyoudoubutu@gmail.com)

Academic editor: J. Settele | Received 22 January 2018 | Accepted 23 February 2018 | Published 15 March 2018

Citation: Karasawa S, Nakata K (2018) Invasion stages and potential distributions of seven exotic terrestrial isopods in
Japan. BioRisk 13: 53–76. https://doi.org/10.3897/biorisk.13.23514

Abstract
Evaluating potential distribution areas and limiting factors for the distribution of exotic species in invasive
regions are essential to identify risks and protect the native ecosystem. However, less research has been
conducted on the underground ecosystem than for above-ground. Factors, limiting the distributions of
exotic terrestrial isopods, have been identified and their invasive stages and potential distribution areas in
Japan evaluated. A database of distribution data has been developed for 17,412 terrestrial isopod speci-
mens in Japan and two ecological niche models constructed using 19 bioclimatic variables; the regional
model was calculated using data from Japan (invasive region) only, whereas a combination of data from
Japan and North America (invasive regions) and Europe (native region) was used to construct the global
model. The global model predicted that annual mean temperature and mean diurnal-temperature range
were the important limiting factors for most exotic isopods. It was found that Armadillidium nasatum
Budde-Lund, 1833, A. vulgare Latreille, 1804, Haplophthalmus danicus Budde-Lund, 1880, Porcellio lae-
vis Latreille, 1804, P. scaber Latreille, 1804 and Porcellionides pruinosus (Brandt, 1833) were composed of
stabilising and colonising populations, which enabled prediction of the future spread of distribution areas
for these species in Japan. Porcellio dilatatus Brandt, 1833 was introduced in unstable environments and
thus was found in fewer locations.

Keywords
Ecological niche model, Maxent, Oniscidea, precipitation, temperature

Copyright Shigenori Karasawa, Kensuke Nakata. This is an open access article distributed under the terms of the Creative Commons Attribution License
(CC BY 4.0), which permits unrestricted use, distribution, and reproduction in any medium, provided the original author and source are credited..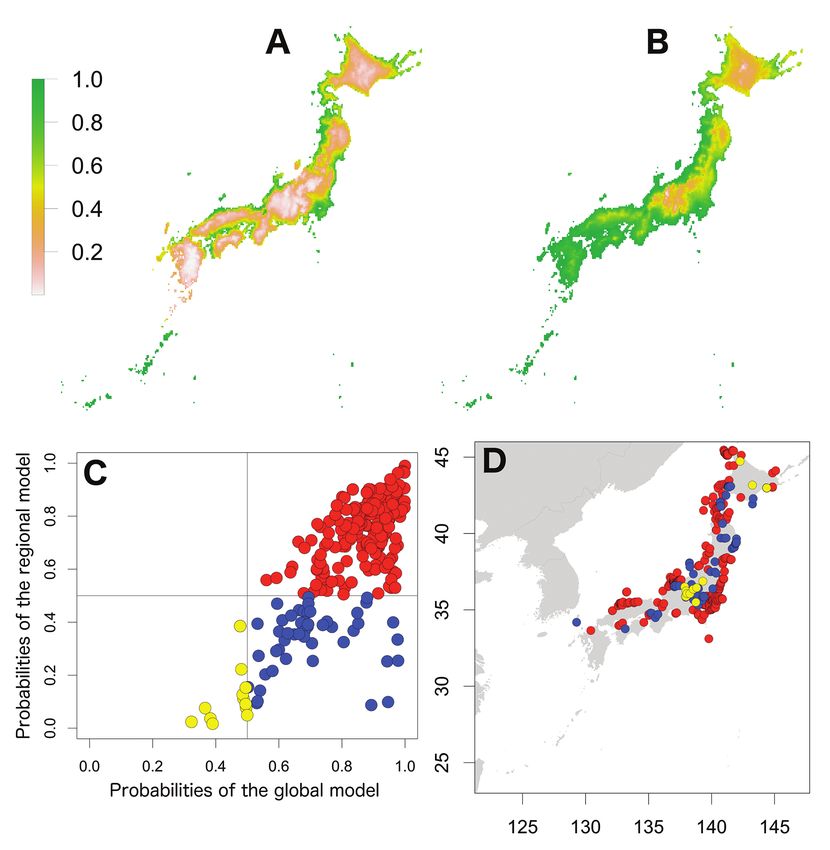
54             Shigenori Karasawa & Kensuke Nakata / BioRisk 13: 53–76 (2018)

Introduction
Populations of exotic species are rapidly increasing worldwide with recent globalisa-
tion (Hulme 2009) and such species have become a serious threat to biodiversity and
ecological functions (e.g. Gurevitch and Padilla 2004, Simberloff et al. 2013). Ecologi-
cal niche modelling to predict species distributions, based on environmental variables,
has become a valuable tool for preventing the colonisation of invasive species and for
designing effective protection activity (Franklin and Miller 2010, Elith 2015). How-
ever, this approach is based on the assumptions of population equilibrium and niche
stability in space and time (Guisan and Thuiller 2005) and these assumptions often fail
(Broennimann et al. 2007, Guisan et al. 2014). Thus, it is important to evaluate the
invasive stages of species of interest to predict future distributions and risks of those
species. Gallien et al. (2012) developed a methodological framework for evaluating the
invasive stage by plotting probabilities of two prediction models to identify the leading
edge of an invasion and to determine whether the invasive population had reached the
equilibrium (Kumar et al. 2015, Zhu et al. 2017).
     Soil arthropods have extremely high species richness and serve important ecologi-
cal functions, such as decomposition, carbon and nutrient cycling, soil structure and
maintenance and biological population regulation (Orgiazzi et al. 2016). In addition
to being found on the ground, many exotic species inhabit soil ecosystems; however,
less information is available about exotic species in soils than for those above ground
(e.g. Bardgett and Wardle 2010, McNeill et al. 2017). Terrestrial isopods (Crustacea:
Oniscidea) include more than 3,700 species worldwide (Schmalfuss 2003, Sfendoura-
kis and Taiti 2015) and play important ecological functions, e.g. decomposing organic
material (Zimmer 2004), facilitating microbial activity (Hassall et al. 1987) and acting
as prey for vertebrates (Ihara 1998). Thus, understanding and protecting this group are
essential to maintain their diversity and ecological functions in soil ecosystems. A hot
spot of isopod diversity is in the Mediterranean region (Sfendourakis and Taiti 2015)
and some species from this region were introduced to several other regions through hu-
man activity (Schmalfuss 2003). For example, one-third of all terrestrial isopod species
in North America were found to be exotic species (Hornung et al. 2015). Lilleskov et
al. (2008) investigated the species richness of native and introduced species in North
America and found that the peak for introduced species occurred at a higher latitude
than that for native species. This result implied that it may be problematic to apply
information related to factors controlling the distributions of native species to exotic
species. However, few studies have clarified the factors determining the distributions
of exotic species in regions to which they have been introduced.
     About 140 terrestrial isopod species have been reported in Japan (Nunomura 2015),
although their taxonomic classification is still considerably confusing (Karasawa 2016,
Karasawa and Honda 2012, Karasawa et al. 2016). However, at least seven species, Ar-
madillidium nasatum Budde-Lund, 1833, A. vulgare Latreille, 1804, Haplophthalmus
danicus Budde-Lund, 1880, Porcellio dilatatus Brandt, 1833, P. laevis Latreille, 1804, P.
scaber Latreille, 1804 and Porcellionides pruinosus (Brandt, 1833), are considered exotic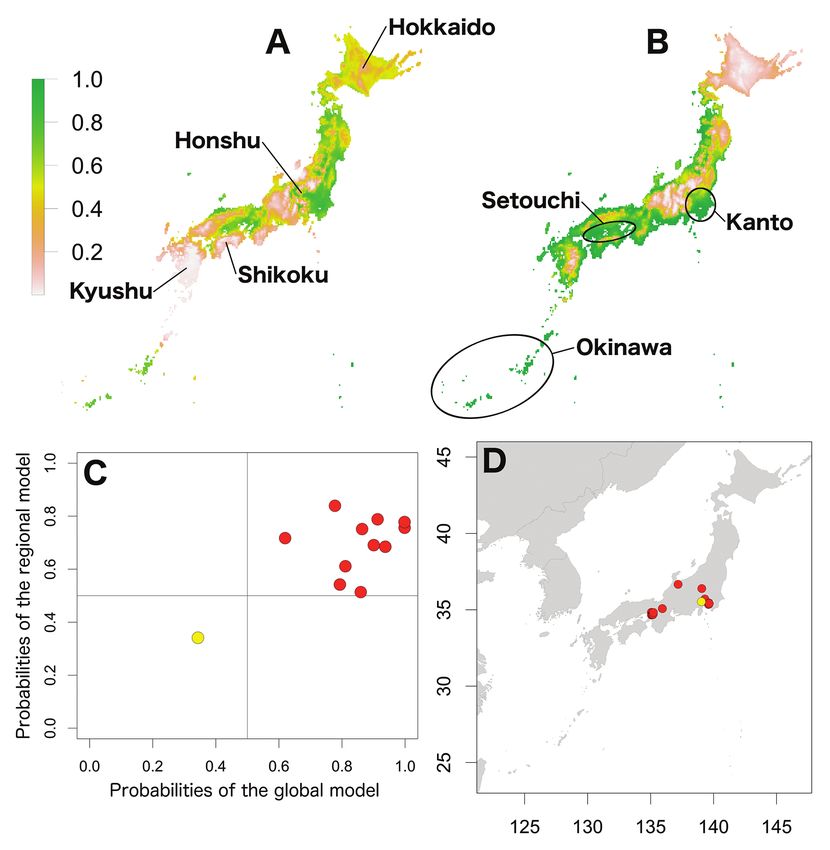
Invasion stages and potential distributions of seven exotic terrestrial isopods in Japan   55

in Japan; their original distributional areas may have been in the Mediterranean region
or Europe (Schmalfuss 2003, Nunomura 2007, Cochard et al. 2010). Some researchers
have examined the relationship between the distribution of these taxa and land use in
Japan (Watanabe 1991, Fujita and Watanabe 1999), but no research has clarified the fac-
tors delimiting their distributions at a macro scale. Thus, determining these delimiting
factors and predicting potential future distributions and invasive stages are important for
mitigating the risks these species pose to native soil ecosystems.
     The aims of this study were to 1) generate a potential distribution map in Japan for ex-
otic isopod species, 2) identify important climatic factors associated with their distributions
and 3) evaluate stages of invasion and whether the populations have reached equilibrium.

Methods
Species distribution data

A distribution database of terrestrial isopods was developed in Japan that includes dis-
tribution data of 17,412 specimens based on 159 publications, a database of specimens
deposited in Japanese museums (S-Net; National Museum of Nature and Science 2014)
and personal collections of the first author. The distribution data of the seven species are
available in Suppl. material 1 and all the distribution data is visualised by the web system
developed for this study (Suppl. material 2). In addition, occurrence data of the seven
species were obtained for their native region (Europe) and another invaded region (North
America) from the Global Biodiversity Information Facility (GBIF; GBIF.org 2017) be-
cause sufficient numbers of occurrence data were reported from both regions. The area of
Europe is defined as N35°–N70° and W11°–E23° and the North American region was
defined as N10°–N55° and W50°–W135°. The original regions of the seven species exam-
ined were unclear, but A. nasatum may have originally been distributed in Italy, southern
France and Spain and A. vulgare and P. pruinosus may be native to the Mediterranean
region (Cochard et al. 2010). For the present study, the authors tentatively considered the
European continent as the original distribution area of these taxa, although some species
were likely foreign in some parts of Europe (Cochard et al. 2010). In addition, P. scaber
was described as a subspecies based on specimens collected from Hokkaido, northern Ja-
pan (Verhoeff 1928), but this taxonomic classification was dubious. For example, genetic
characters of two specimens from Japan were almost identical to those of specimens from
Europe and the United States (Karasawa et al. 2017); this species has been treated as exotic
in Japan (Nunomura 2007). Duplicate locations were excluded for further analyses.

Environmental data
Bioclimatic variables (19) were used from the WorldClim version 2.0 dataset at five
arc-minute resolution for these analyses (Fick and Hijmans 2017). These variables in-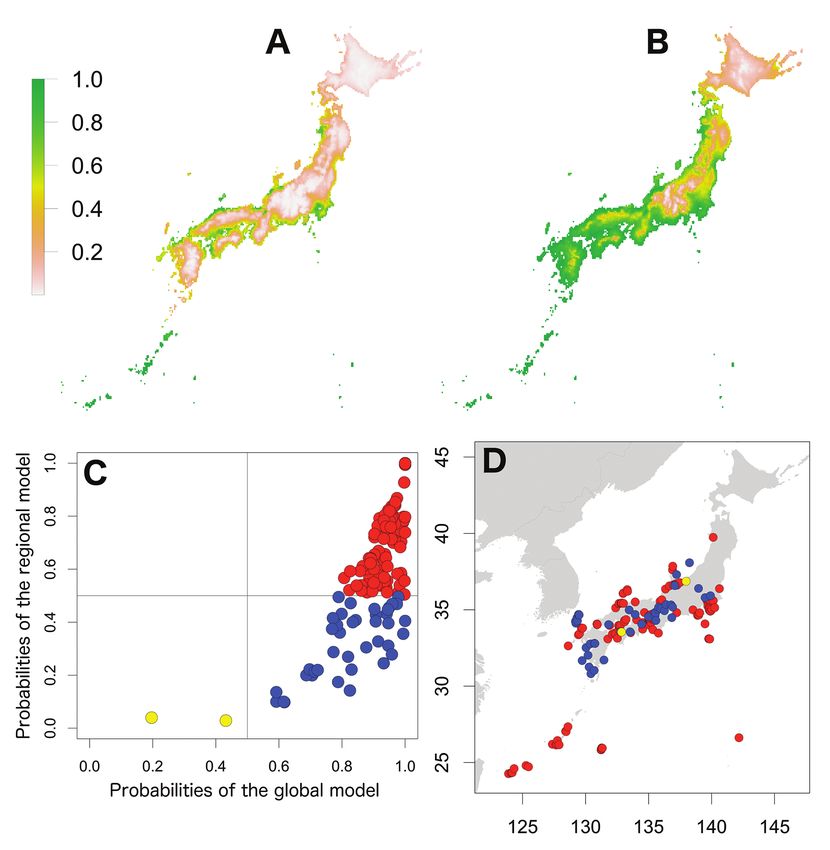
56              Shigenori Karasawa & Kensuke Nakata / BioRisk 13: 53–76 (2018)

cluded temperature and precipitation data, which have been recommended for and
widely applied to species distribution modelling (e.g. Broennimann et al. 2007, Kumar
et al. 2015, Zhu et al. 2017). Highly collinear variables (Pearson correlation coef-
ficient, |r| ≥ 0.75) were removed and only one variable from a set of highly correlated
variables was included in each model (Suppl. materials 3, 4).

Construction of environment niche models (ENMs)
The environmental niche models (ENMs) were constructed using Maxent version
3.4.1 (Phillips et al. 2017), which employs the principle of maximum entropy to
discriminate occurrence records of species to environmental variables to estimate
a species’ potential geographic distribution (Phillips et al. 2006). The Maxent pro-
gramme has the following advantages compared with other methods: the technique
can be performed using presence data only (Phillips et al. 2006) and is relatively ro-
bust with small sample sizes (Hernandez et al. 2006; Wisz et al. 2008). Two models
were constructed: 1) the regional model developed based on occurrence locations in
the invasive region (Japan) and 2) the global model developed based on all occur-
rence locations in Japan, Europe and North America. The occurrence data may hold
sampling bias because they were not collected randomly and were obtained from sev-
eral sources. To enhance the performance for constructing ENMs, background data
were created with the same underlying bias for the occurrence data (target group
background; Philips et al. 2009). A bias surface was generated using a kernel density
estimation using the sm package (Bowman and Azzalini 2014, the script was ac-
cording to Fitzpatrick et al. 2013) in R version 3.4.3 (R Development Core Team
2017). Then, 10,000 background points were randomly selected as weighed by the
sampling bias surface. Linear and quadratic features were used as functional forms to
describe relationship probability of occurrence and environmental data, to prevent
over-fitting of the training data (Syfert et al. 2013, 2014). Model accuracy was evalu-
ated based on the area under the curve (AUC). AUC values indicated whether model
predictions were better than random; values < 0.5 denote worse than random perfor-
mance; 0.5–0.7 indicate poor performance; 0.7–0.9 represents reasonable/moderate
performance; and values > 0.9 indicate high performance (Peterson et al. 2011).
The percent variable contribution and jackknife permutation importance functions
in Maxent were used to investigate the relative importance of bioclimatic predic-
tors affecting species distributions. The response curves of high contribution values
(> 25 %) generated by Maxent were used for investigating the responses of the seven
species to environmental variables.
     The global model was used to predict the potential distribution of exotic species
in Japan for the following reason: if exotic species have not been present for a suf-
ficient length of time to spread to all suitable areas, their distributions are limited to
areas smaller than their potential distribution areas. Thus, estimation using the pre-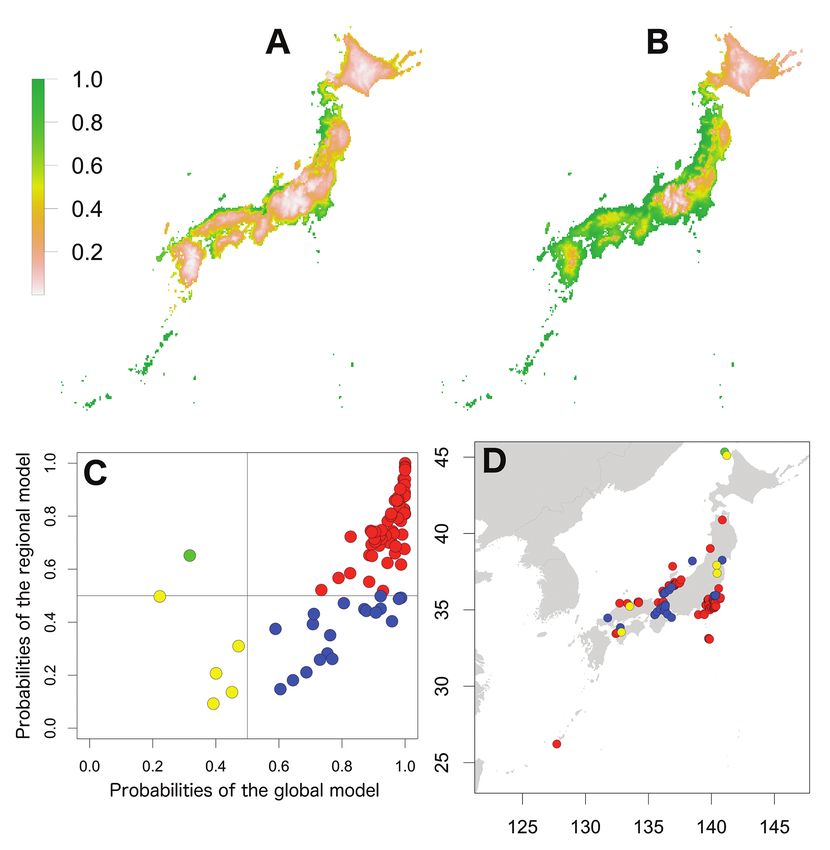
Invasion stages and potential distributions of seven exotic terrestrial isopods in Japan   57

sent data in invasive areas may potentially underestimate their distribution areas (Le
Maitre et al. 2008).
    The invasion stages of the exotic species in Japan were evaluated using an ap-
proach that was theoretically developed by Gallien et al. (2012) and applied analyti-
cally by Kumar et al. (2015). According to this framework, a species would be at
quasi-equilibrium if the regional and global models predict higher probabilities (>
0.5) for the species’ presence (i.e. stabilising populations). In contrast, if both mod-
els predict lower probabilities (< 0.5) for species presence, these locations may rep-
resent population sinks (i.e. sink populations). If species presences cover the global
niches (probability > 0.5) but not regional niches (probability < 0.5), this finding
suggests colonisation from different sources, including already invaded areas in the
regional invaded range (i.e. colonising populations). In contrast, if species presences
cover the regional niches (probability > 0.5), but not global niches (probability <
0.5), these populations may be adapting to new environmental conditions (i.e. local
adapted populations).

Results
Current distributions of exotic species in Japan

Seven exotic species were reported from 1,516 locations in Japan and 4,135 and 1,953
location data were found for Europe and North America, respectively (Table 1). Arma-
dillidium vulgare, H. danicus, P. scaber and P. pruinosus were reported from more than
100 locations in Japan and A. vulgare had the widest distribution area, from N43°10'
to N24°45'. In contrast, A. nasatum, P. dilatatus and P. laevis were found in less than 32
locations (Figs 1–7, Table 1). Most species were rarely reported in the Hokkaido, but
P. scaber was found in many locations in the Hokkaido (Fig. 6). Porcellionides pruinosus
was reported at the southernmost location of Japan included in the dataset, Iriomote-
jima Island (N24°16') (Fig. 7). Five of the seven exotic species were first reported in
1927 and the two other species (A. nasatum and P. dilatatus), with narrow distribution
areas in Japan, were reported in 1943 (Table 1).

Model performance and variable contributions
Training AUC value for each species varied between the global model (0.681–0.910)
and the regional model (0.712–0.857); the values for three (A. nasatum, A. vulgare
and P. dilatatus) of the seven species were higher in the global models than in the re-
gional models (Table 2, Suppl. material 5). In the global model, annual mean temper-
ature and mean diurnal temperature range (annual mean of all the month’s maximum
- minimum diurnal temperatures) became important predictors (> 25 %) for five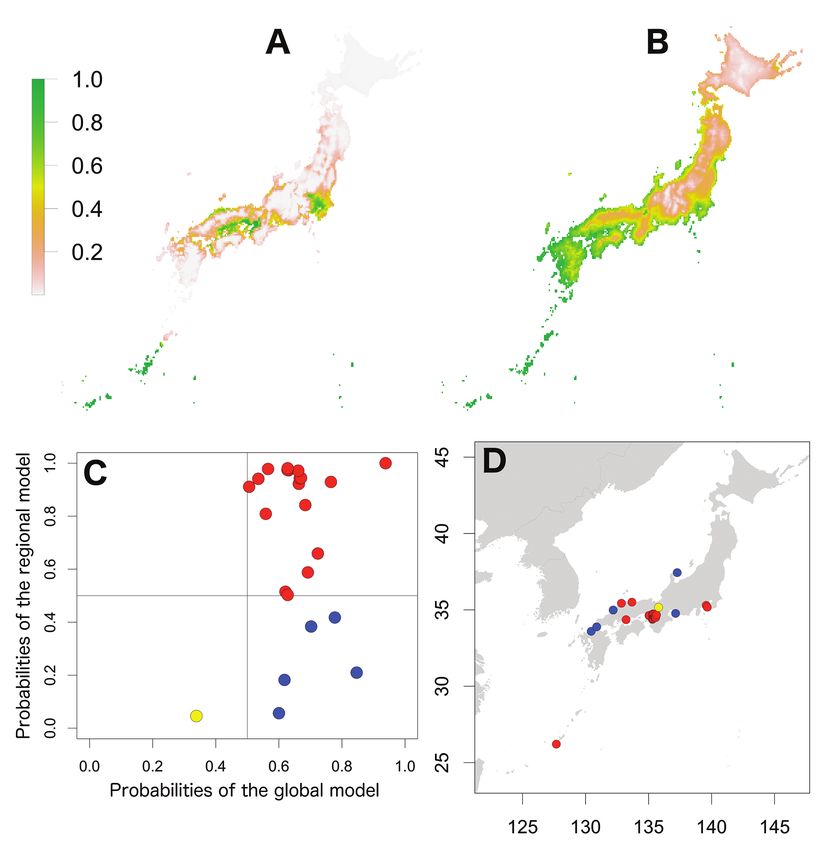
58 Shigenori Karasawa & Kensuke Nakata / BioRisk 13: 53–76 (2018)
Table 1. Exotic isopod species and their first references in Japan and numbers of sites analysed.
First report in No. of site analysed
Species
Japan Japan Europe North America
Armadillidium nasatum Budde-Lund, 1833 Iwamoto (1943) 20 147 72
Armadillidium vulgare Latreille, 1804 Arcangeli (1927) 770 1176 1276
Haplophthalmus danicus Budde-Lund, 1880 Arcangeli (1927) 120 223 28
Porcellio dilatatus Brandt, 1833 Iwamoto (1943) 7 44 38
Porcellio laevis Latreille, 1804 Arcangeli (1927) 32 29 162
Porcellio scaber Latreille, 1804 Arcangeli (1927) 393 2413 236
Porcellionides pruinosus (Brandt, 1833) Arcangeli (1927) 174 103 141
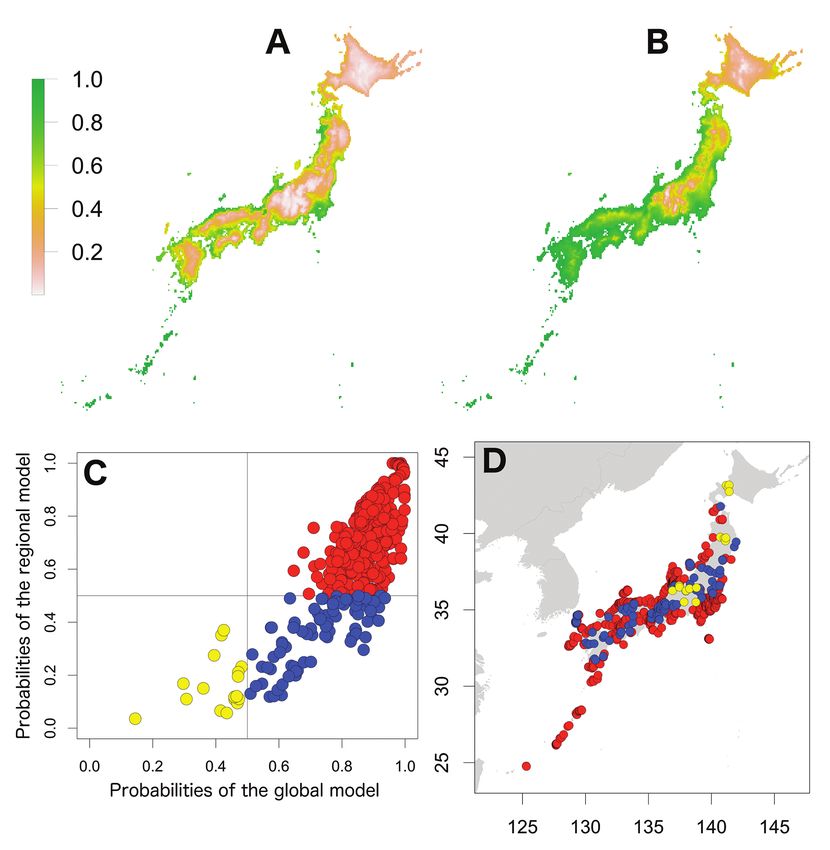
Figure 1. Potential distribution maps, invasive stage and occurrence locations for A. nasatum. Potential
distribution maps predicted by the regional model (A) and the global model (B). Invasive stage of A. na-
satum populations based on global and regional model predictions (C) and the locations on the map (D);
red: stabilising population, yellow: sink population. Four large islands and three regions were described
in A and B, respectively.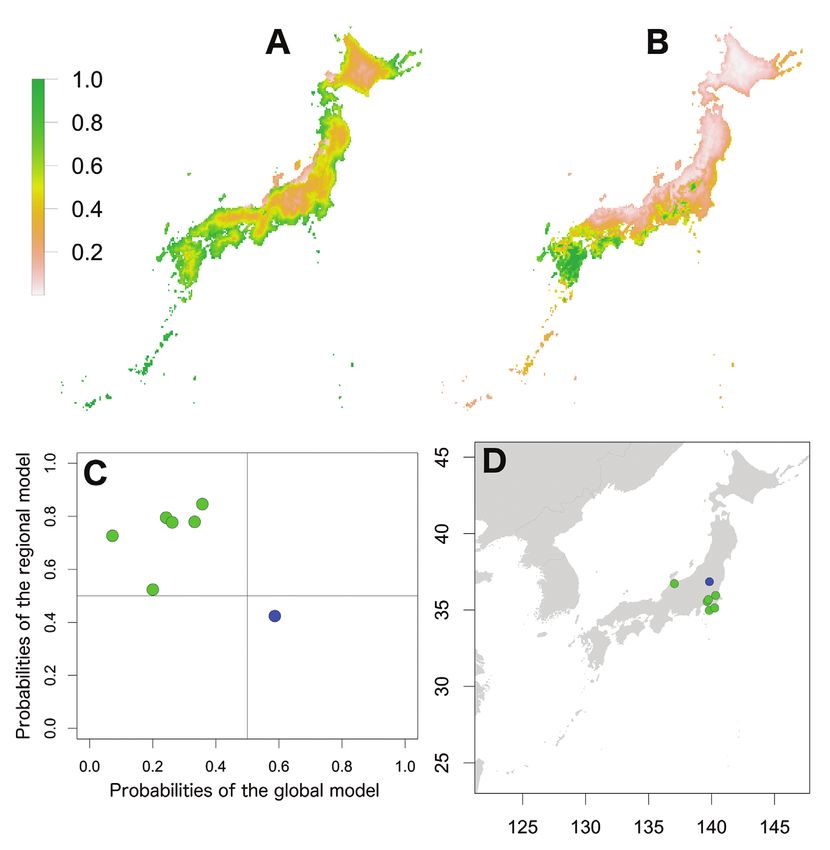
Invasion stages and potential distributions of seven exotic terrestrial isopods in Japan   59

Figure 2. Potential distribution maps, invasive stage and occurrence locations for A. vulgare. Poten-
tial distribution maps predicted by the regional model (A) and the global model (B). Invasive stage of
A. vulgare populations based on global and regional model predictions (C) and the locations on the
map (D); red: stabilising population, blue: colonising population, yellow: sink population.

species and temperature seasonality also became an important predictor for P. dilata-
tus (37.6 % contribution). However, the precipitation-related variable, precipitation
seasonality was only an important predictor for A. nasatum (25.7 % contribution), P.
dilatatus (25.3 % contribution) and P. laevis (28.0 % importance). As well as in the
global model, mean diurnal range also became an important predictor (> 25%) for
five species in the regional model. However, the annual mean temperature exceeded
25% importance only for A. nasatum (32.2 % importance) and P. pruinosus (39.5 %
contribution). In addition to the two climatic variables, maximum temperatures of
the warmest quarter (A. vulgare, 25.3 % importance; P. laevis, > 50 % contribution
60 Shigenori Karasawa & Kensuke Nakata / BioRisk 13: 53–76 (2018)
Figure 3. Potential distribution maps, invasive stage and occurrence locations for H. danicus. Poten-
tial distribution maps predicted by the regional model (A) and the global model (B). Invasive stage of
H. danicus populations based on global and regional model predictions (C) and the locations on the
map (D); red: stabilising population, blue: colonising population, green: adapted population, yellow: sink
population.
and importance) and the wettest quarter (P. dilatatus, 27.2 % contribution) became
important predictors. Within precipitation related-variables, precipitation of the wet-
test month was only an important predictor for A. nasatum (> 65 % contribution and
importance).
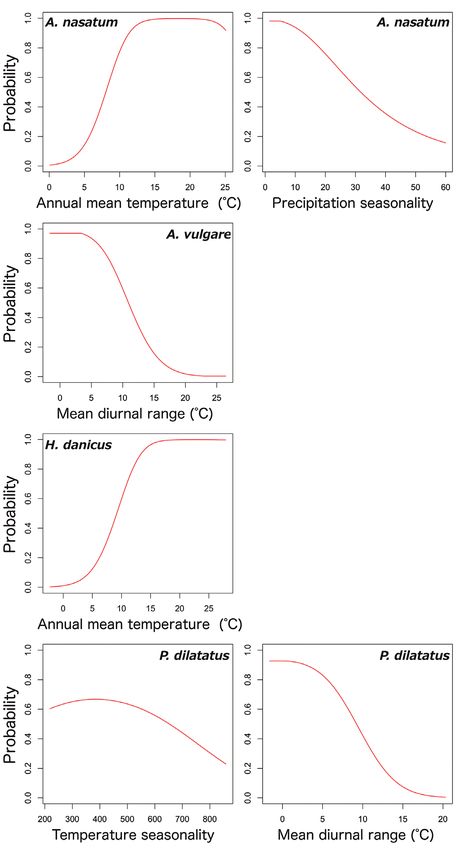
In the global model, relationships between high-contribution (> 25 %) variables
based on the percent contribution values and the probabilities of seven species are
shown in Figs 8 and 9. The relationship between the probability of occurrence and
mean diurnal range showed similar trends amongst five species, A. vulgare, P. dilatatus,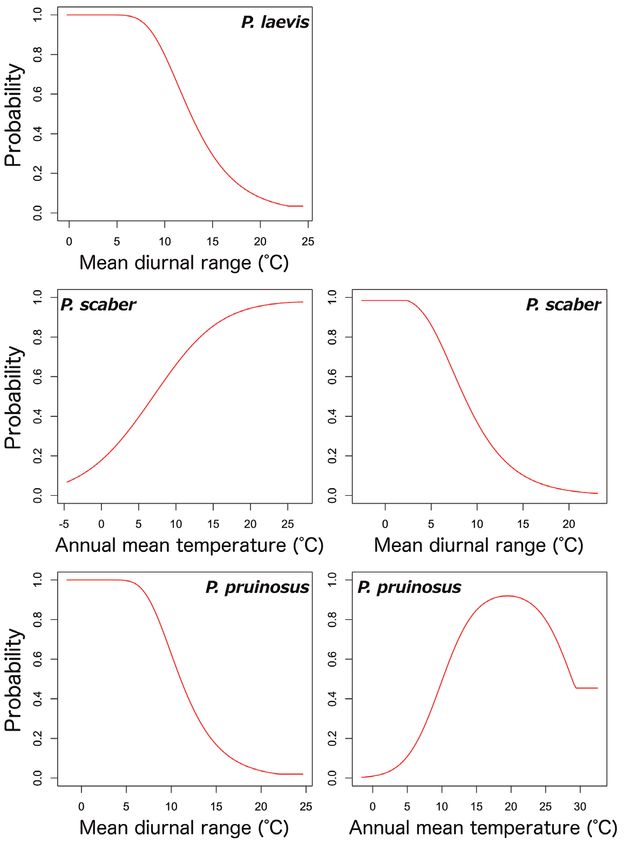
Invasion stages and potential distributions of seven exotic terrestrial isopods in Japan     61

Figure 4. Potential distribution maps, invasive stage and occurrence locations for P. dilatatus. Potential
distribution maps predicted by the regional model (A) and the global model (B). Invasive stage of P. dila-
tatus populations based on global and regional model predictions (C) and the locations on the map (D);
blue: colonising population, green: adapted population.

P. laevis, P. scaber and P. pruinosus; their probabilities of occurrences were high in mean
diurnal ranges of less than 10°C. However, there were different trends in the relation-
ships between occurrence probability and annual mean temperature between species;
the probability of occurrence of A. nasatum, H. danicus and P. scaber preferred high
temperatures (> 15 °C) and P. pruinosus tended to be distributed in areas with more
moderate temperatures (15–25 °C). Armadillidium nasatum was associated with low
precipitation seasonality. Porcellio dilatatus tended to be distributed with lower tem-
perature seasonality, although this relationship was weak.
62 Shigenori Karasawa & Kensuke Nakata / BioRisk 13: 53–76 (2018) Figure 5. Potential distribution maps, invasive stage and occurrence locations for P. laevis. Potential distribution maps predicted by the regional model (A) and the global model (B). Invasive stage of P. laevis populations based on global and regional model predictions (C) and the locations on the map (D); red: stabilising population, blue: colonising population, yellow: sink population. Potential distributions of exotic species in Japan The potential distributions of the seven species in Japan based on the regional and global models are shown in Figs 1–7. The global models for six species represented wider ranges than the regional ranges, excluding P. dilatatus with a wider potential distribution area in the regional model. The potential distribution maps of the global model for A. nasatum, A. vulgare, H. danicus, P. scaber, and P. pruinosus were almost identical (Figs 1–3, 6 and 7), which indicates that suitable regions would occur in
Invasion stages and potential distributions of seven exotic terrestrial isopods in Japan   63

Figure 6. Potential distribution maps, invasive stage and occurrence locations for P. scaber. Potential
distribution maps predicted by the regional model (A) and the global model (B). Invasive stage of P.
scaber populations based on global and regional model predictions (C) and the locations on the map
(D); red: stabilising population, blue: colonising population, yellow: sink population.

western Honshu, Shikoku and Kyushu. However, there were small differences in the
potential distribution ranges amongst the species; those of A. vulgare, P. scaber and P.
pruinosus were further inland compared with those of A. nasatum and H. danicus and
the potential distribution area of P. scaber was covered coastal areas of Hokkaido. The
potential distribution area of P. laevis was limited to more south-western regions than
those five species (Fig. 5). Porcellio dilatatus was potentially distributed in most areas
of Kyushu and Shikoku and in scattered areas of central Honshu (Fig. 4). Based on
comparison with the global model, the potential distribution maps of the regional
64                Shigenori Karasawa & Kensuke Nakata / BioRisk 13: 53–76 (2018)

Figure 7. Potential distribution maps, invasive stage and occurrence locations for P. pruinosus. Po-
tential distribution maps predicted by the regional model (A) and the global model (B). Invasive
stage of P. pruinosus populations based on global and regional model predictions (C) and the locations
on the map (D); red: stabilising population, blue: colonising population, yellow: sink population.

model showed large interspecific variations. The potential distribution areas of A. vul-
gare, H. danicus, P. scaber and P. pruinosus were limited to narrow areas within coastal
regions (Figs 2, 3, 6 and 7). For A. nasatum, the potential distribution area was large
and included a large portion of eastern Honshu and coastal areas of western Honshu
(Fig. 1). Only P. dilatatus showed distribution in larger areas in the regional model than
in the global model (Fig. 4); in addition to most of Kyushu and Shikoku, as in the
global model, the potential distribution area also extended to coastal areas of Honshu
and southern Hokkaido. The regional model predicted distribution of P. laevis in the
Setouchi, Kanto and Okinawa regions (Fig. 5).
Invasion stages and potential distributions of seven exotic terrestrial isopods in Japan        65

Figure 8. Relationships between high-contribution variables (more than 25 % contribution) and the
occurrence probabilities. The contribution variables are based on the percent contribution values in the
global model. First row: A. nasatum; second row: A. vulgare; third row: H. danicus; fourth row: P. dilatatus.
Left: the highest contribution variable; right: the second highest contribution variable.
66                 Shigenori Karasawa & Kensuke Nakata / BioRisk 13: 53–76 (2018)

Figure 9. Relationships between high-contribution variables (more than 25 % contribution) and the
occurrence probabilities. The contribution variables are based on the percent contribution values in the
global model. First row: P. laevis; second row: P. scaber; third row: P. pruinisus. Left: the highest contribu-
tion variable; right: the second highest contribution variable.

Invasive stages of exotic species in Japan
Plotting the probabilities of the regional model against those of the global model
showed three patterns (Figs 1–7). The first was that the global probabilities were more
than 0.5 regardless of the regional probabilities, which indicated that these species were
composed of stabilising and colonising populations, with several locations considered
to represent sink populations (less than 0.5 probabilities in both models) also included.
This pattern was found for A. vulgare, H. danicus, P. laevis, P. scaber and P. pruinosus
(Figs 2, 3 and 5–7). The second pattern was found for A. nasatum and was composed
Table 2. AUC and variable contributions of the global model.

                                                                                                      Temperature seasonality      Mean temperature of wettest
                                           Annual mean temperature         Mean diurnal rangea
                               Training                                                              (standard deviation *100)                quarter
              Species
                                 AUC        Percent      Permutation      Percent       Permutation    Percent       Permutation      Percent      Permutation
                                          contribution   importance    contribution importance contribution importance             contribution importance
    Armadillidium nasatum       0.803         33.0          23.6            22.3            24.6         5.7              0.3           2.4             5.7
    Armadillidium vulgare       0.768         23.7          25.4            52.2            57.5         3.0              0.6           0.1             0.8
    Haplophthalmus danicus      0.776         43.6          48.2            19.1            21.1         2.4              3.1           0.0             0.0
    Porcellio dilatatus         0.910          1.3           5.3            26.4            52.1        37.6             18.6           3.5             0.0
    Porcellio laevis            0.823         10.7          19.0            27.7            37.4        23.7              1.6           0.8             0.0
    Porcellio scaber            0.681         29.8          23.3            28.8            33.5         1.5              8.3           0.4             0.0
    Porcellionides pruinosus    0.802         33.5          38.9            42.2            54.9         4.3              0.0           5.6             1.9
                                                                                                      Precipitation seasonality      Precipitation of warmest
                                             Annual precipitation      Precipitation of driest month
                               Training                                                               (coefficient of variation)              quarter
              Species
                                 AUC        Percent      Permutation      Percent       Permutation    Percent       Permutation      Percent      Permutation
                                          contribution   importance    contribution importance contribution importance             contribution importance
    Armadillidium nasatum       0.803          2.4          17.0            7.9              4.6        25.7             23.2           0.5             1.0
    Armadillidium vulgare       0.768          0.0           0.1            3.4              1.5        14.2             12.4           3.3             1.6
    Haplophthalmus danicus      0.776          0.2           0.7            20.1             0.1        11.8             20.0           2.7             6.8
    Porcellio dilatatus         0.910          1.0           0.3            0.9              0.0        25.3             19.8           4.0             3.8
    Porcellio laevis            0.823          1.7           2.7            1.5              3.6        24.6             28.0           9.3             7.6
    Porcellio scaber            0.681         14.9          24.7            18.2             0.7         6.2              7.6           0.2             1.8
    Porcellionides pruinosus    0.802          0.4           2.1            6.4              0.3         0.5              2.0           7.1             0.0
a
: Annual mean of all the month’s maximum - minimum diurnal temperatures.
                                                                                                                                                                 Invasion stages and potential distributions of seven exotic terrestrial isopods in Japan
                                                                                                                                                                 67
68 Shigenori Karasawa & Kensuke Nakata / BioRisk 13: 53–76 (2018)
of stabilising populations with one sink population (Fig. 1). The third pattern was
shown for P. dilatatus; the probabilities of the regional model were high, whereas those
predicted by the global model were low (Fig. 4). These populations may have adapted
to new environments (local adapted populations). The four types of populations, i.e.
stabilising, colonising, local adapted and sink populations, did not show distinctive
geographic patterns, but sink populations tended to be found in Hokkaido and inland
on Honshu.
Discussion
Environmental factors limiting exotic species
To estimate the factors limiting distribution areas at a macro scale, ecological niche
models (ENMs) and species distribution models (SDMs) have been useful (Elith and
Leathwick 2009, Franklin and Miller 2010, Peterson et al. 2011, Franklin 2013).
However, few studies have applied these methods to the analysis of soil animals, ex-
cluding ants (Fitzpatrick et al. 2007, Kumar et al. 2015). The present study was a first
attempt to apply ENMs to evaluate the important factors determining the distribution
areas and invasion stages of exotic terrestrial isopods. Needless to say, however, the
occurrence data used in the study could not cover all distribution areas of the species.
Thus, it is possible that the ENMs constructed will be altered when a more accurate
and larger database has been developed.
The global model indicated that temperature-related variables are more important
than precipitation-related variables in limiting the distributions of terrestrial isopods.
The distributions of isopods at a macro scale are limited by natural factors, especially
temperature and moisture (Harding and Sutton 1985, Hopkin 1991). For example,
a cartographic analysis of terrestrial isopods in the former USSR indicated that the
length of the period with temperatures above 10 °C plays an important role in limiting
isopod distributions (Kuznetsova and Gongalsky 2012). Lilleskov et al. (2008) also
found that the species richness of exotic terrestrial isopods in North America peaked
at mid-latitudes (N40°). These facts supported the inference that temperature may
be an important factor limiting the distribution of exotic terrestrial isopods in Japan.
This study also found that, not only annual mean temperatures but also mean diurnal
temperature ranges, played important roles in delimiting the distributions of exotic
species. Armadillidium vulgare, P. dilatatus, P. laevis, P. scaber and P. pruinosus were po-
tentially distributed in areas where diurnal temperature fluctuated less. However, there
were differences in suitable annual mean temperatures between species. Armadillidium
nasatum, H. danicus and P. scaber preferred warm regions, whereas the suitable temper-
ature range of P. pruinosus showed a hump-shaped pattern. However, the annual mean
temperatures of high probability (probability greater 0.5) for these species ranged from
10 °C to 25 °C, which covered most areas of Japan, excluding mountainous regions.Invasion stages and potential distributions of seven exotic terrestrial isopods in Japan 69
This result suggested that the annual mean temperature was not an important factor
limiting the distributions of these species in Japan and that climate warming may
cause latitudinal shifts in distribution ranges for terrestrial isopods (Hickling et al.
2006, Mason et al. 2015) and there is a possibility that their ecological functions may
change. However, there is no room for doubt that local-scale environments, e.g. micro-
bial activity and vegetation, play important roles in limiting distributions of terrestrial
isopods (Zimmer and Topp 1999, 2000). Thus, an integrated analysis of local- and
macro-scale features will be required to understand the factors limiting the species
distribution (Pateman et al 2016).
Invasion stages of exotic species in Japan
For six of the seven exotic isopod species, the global model predicted wider potential
distribution areas in Japan than did the regional model. These results implied that
these species have not yet filled all suitable environments in Japan and that there is
a risk that their distribution areas will spread further in the future. The results also
indicated that combined data from native and introduced regions were useful for
estimating the potential distributions of these exotic species in the invaded region
(Le Maitre et al. 2008, Elith 2015, Ray et al. 2016). The present study evaluated
the invasive stages of these species in Japan by applying the theoretical framework of
Gallien et al. (2012), which has been successfully used to evaluate the invasive stages
of some exotic species (Kumar et al. 2015, Zhu et al. 2017). The evaluation revealed
that many populations of five species (A. vulgare, H. danicus, P. laevis, P. scaber and
P. pruinosus) in Japan were stabilising and colonising. A stabilising population was
defined as a population predicted by both models as high probability (Gallien et al.
2012, Kumar et al. 2015) and indicates that these populations may be maintained
continuously. A colonising population was a population distributed in an area where
the regional model predicted low probability, although these areas were predicted as
high probability by the global model (Gallien et al. 2012, Kumar et al. 2015). The
occurrence of many colonising populations suggests potential for more populations
to be established in the area, which will be changed to high probability in the regional
model as well. Thus, evaluating the invasive stage also enables prediction of the future
spread of distribution areas of these five species. In addition, the species’ populations
included several sink populations distributed in areas characterised as low probability
in both models (Gallien et al. 2012, Kumar et al. 2015). These populations were
found inland on Honshu and Hokkaido, which may have been too cool to maintain
these populations.
Armadillidium nasatum and P. dilatatus were reported from relatively few locations
in Japan (20 and 7 locations, respectively). Examination of the literature revealed that
A. nasatum and P. dilatatus were first reported 16 years after the earliest reports of the
other species. It is speculated that shortage of elapsed time since the introduction of70 Shigenori Karasawa & Kensuke Nakata / BioRisk 13: 53–76 (2018) A. nasatum was one of reasons for its distribution in fewer locations in Japan, because the species’ suitable area covered a large area of Japan and because this species had been introduced to suitable areas; this species was composed of stabilising populations. Ad- ditionally new locations were recently found (Yamasaki and Yoshida 2017, T. Suzuki, personal comments); thus, it is possible that this species will spread its distribution areas in the future, in addition to the five species mentioned above. However, for the narrow distribution range of P. dilatatus, the ecological niches and introduced areas of this species were more important for explaining its occurrences in fewer locations rather than the time elapsed. The relationship between the regional and global models for P. dilatatus presented different traits from those of the other species. The regional model for P. dilatatus predicted the south-western region and coastal area of Honshu as suitable areas, but the global model indicated Shikoku and Kyushu as suitable areas. These results suggested that this species was introduced in unsuitable environments and adapted to these new environments in Japan, which may be a reason why this species was found in fewer locations. In addition, the global model indicated that this species could spread if it migrates to south-western areas (i.e. Shikoku and Kyushu). However, it is possible that the small number of occurrence locations in Japan was in- sufficient to precisely estimate the potential distribution map (Hernandez et al. 2006, Wisz et al. 2008). Therefore, further research is required to evaluate the adaptations of these taxa to new environments in Japan. Conclusion This was a first study that applied ecological niche modelling to identify factors limiting the distributions of exotic terrestrial isopods and evaluate their invasive stages and potential distribution areas in Japan. The model constructions indicated that EMSs, constructed based on occurrence data in introduced areas alone, were insufficient to evaluated potential distribution maps for exotic isopods, because these species have never occupied many of their suitable environments. The global model indicated that the annual mean temperature and mean diurnal temperature range were the most important limiting factors for most exotic isopods. From evaluating invasive stages, A. nasatum, A. vulgare, H. danicus, P. laevis, P. scaber and P. pruinosus were composed of stabilising and colonising populations; these results showed that these species could spread their distribution areas in Japan in the future. In contrast, P. dilatatus was introduced in unstable environments and was therefore found in fewer locations. Acknowledgements This work was supported by a Grant-in-Aid for Young Scientists (B) Grant Number 26830145.
Invasion stages and potential distributions of seven exotic terrestrial isopods in Japan     71

References
Arcangeli A (1927) Isopodi terrestri raccolti nell'Estremo Oriente dal Prof. Filippo Silvestri. Bollettino
     del Laboratorio di Zoologia generale e agraria della R Scuola superiore d'Agricoltura in Portici
     20: 211–269.
Bardgett RD, Wardle DA (2010) Aboveground-belowground linkages: biotic interactions, eco-
     system processes, and global change, first edition. Oxford University Press, Oxford, 301 pp.
Bowman AW, Azzalini A (2014) R package ‘sm’: nonparametric smoothing methods (version
     2.2-5.4). http://www.stats.gla.ac.uk/~adrian/sm, http://azzalini.stat.unipd.it/Book_sm
Broennimann O, Treier UA, Muller-Scharer H, Thuiller W, Peterson AT, Guisan A (2007)
     Evidence of climatic niche shift during biological invasion. Ecology Letters 10: 701–709.
     https://doi.org/10.1111/j.1461-0248.2007.01060.x
Cochard PO, Vilisics F, Sechet E (2010) Alien terrestrial crustaceans (Isopods and Amphipods)
     Chapter 7.1. BioRisk 4: 81–96. https://doi.org/10.3897/biorisk.4.54
Elith J (2015) Predicting distributions of invasive species. http://arxiv.org/ftp/arxiv/pa-
     pers/1312/1312.0851.pdf
Elith J, Leathwick JR (2009) Species distribution models: ecological explanation and predic-
     tion across space and time. Annual Review of Ecology, Evolution, and Systematics 40:
     677–697. https://doi.org/10.1146/annurev.ecolsys.110308.120159
Fitzpatrick MC, Weltzin JF, Sanders NJ, Dunn RR (2007) The biogeography of prediction er-
     ror: why does the introduced range of the fire ant over-predict its native range? Global Ecol-
     ogy and Biogeography 16: 24–33. https://doi.org/10.1111/j.1466-8238.2006.00258.x
Fick SE, Hijmans RJ (2017) Worldclim 2: New 1-km spatial resolution climate surfaces for
     global land areas. International Journal of Climatology 37: 4302–4315. https://doi.
     org/10.1002/joc.5086
Franklin J (2013) Species distribution models in conservation biogeography: developments and
     challenges. Diversity and Distributions 19: 1217–1223. https://doi.org/10.1111/ddi.12125
Franklin J, Miller JA (2010) Mapping species distributions: spatial inference and pre-
     diction. Cambridge University Press, Cambridge, 320 pp. https://doi.org/10.1017/
     CBO9780511810602
Fujita Y, Watanabe H (1999) Terrestrial isopods and their habitats—A case study in Kyoto city.
     Forest Research, Kyoto 71: 1–7. [In Japanese]
Furukawa T, Mizushima M, Horinosono S, Karasawa S (2017) Estimation of the walking abil-
     ity of an exotic terrestrial isopod Armadillidium vulgare Latreille by field and laboratory
     measurements. Edaphologia 101: 27–32.
Gallien L, Douzet R, Pratte S, Zimmermann NE, Thuiller W (2012) Invasive species dis-
     tribution models—how violating the equilibrium assumption can create new insights.
     Global Ecology and Biogeography 21: 1126–1136. https://doi.org/10.1111/j.1466-
     8238.2012.00768.x
GBIF.org (2017) Global Biodiversity Information Facility, Free and open access to biodiversity
     data. https://www.gbif.org/.
Guisan A, Thuiller W (2005) Predicting species distribution: offering more than simple habitat
     models. Ecology Letters 8: 993–1009. https://doi.org/10.1111/j.1461-0248.2005.00792.x
72 Shigenori Karasawa & Kensuke Nakata / BioRisk 13: 53–76 (2018)
Guisan A, Petitpierre B, Broennimann O, Daehler C, Kueffer C (2014) Unifying niche shift
studies: insights from biological invasions. Trends in Ecology & Evolution 29: 260–269.
https://doi.org/10.1016/j.tree.2014.02.009
Gurevitch J, Padilla DK (2004) Are invasive species a major cause of extinctions? Trends in
Ecology & Evolution 19: 470–474. https://doi.org/10.1016/j.tree.2004.07.005
Hassall M, Turner JG, Rands MRW (1987) Effects of terrestrial isopods on the decomposition
of woodland leaf litter. Oecologia 72: 597–604. https://doi.org/10.1007/BF00378988
Hernandez PA, Graham CH, Master LL, Albert DL (2006) The effect of sample size and spe-
cies characteristics on performance of different species distribution modeling methods.
Ecography 29: 773–785. https://doi.org/10.1111/j.0906-7590.2006.04700.x
Hickling R, Roy DB, Hill JK, Fox R, Thomas CD (2006) The distributions of a wide range of
taxonomic groups are expanding polewards. Global Change Biology 12: 450–455. https://
doi.org/10.1111/j.1365-2486.2006.01116.x
Hornung E, Szlavecz K, Dombos M (2015) Demography of some non-native isopods (Crusta-
cea, Isopoda, Oniscidea) in a Mid-Atlantic forest, USA. ZooKeys 515: 127–143. https://
doi.org/10.3897/zookeys.515.9403
Hulme PE (2009) Trade, transport and trouble: managing invasive species pathways in an era
of globalization. Journal of Applied Ecology 46: 10–18. https://doi.org/10.1111/j.1365-
2664.2008.01600.x
Ihara S (1998) The food habits of Hynobius tokyoensis in broad-leaved forest floor. Edaphologia
60: 1–9. [In Japanese]
Iwamoto K (1943) On Japanese terrestrial isopods. Shokubutsu oyobi dobutsu 11: 959–974.
[In Japanese]
Karasawa S (2016) Eleven nominal species of Burmoniscus are junior synonyms of B. kathman-
dius (Schmalfuss, 1983) (Crustacea, Isopoda, Oniscidea). ZooKeys 607: 1–24. https://doi.
org/10.3897/zookeys.607.8253
Karasawa S, Honda M (2012) Taxonomic study of the Burmoniscus ocellatus complex (Crusta-
cea, Isopoda, Oniscidea) in Japan shows genetic diversification in the southern Ryukyus,
southwestern Japan. Zoological Science 29: 527–537. https://doi.org/10.2108/zsj.29.527
Karasawa S, Iwasaki T, Nakajima J (2017) DNA barcoding identified the exotic terrestrial iso-
pod Porcellio scaber (Crustacea, Isopoda, Oniscidea) on the Kyushu mainland, western
Japan. Journal of Field Science 15: 29–34.
Karasawa S, Kanazawa Y, Kubota K (2014) Redefinitions of Spherillo obscurus (Budde-Lund,
1885) and S. dorsalis (Iwamoto, 1943) (Crustacea: Oniscidea: Armadillidae), with DNA
markers for identification. Edaphologia 93: 11–27.
Kumar S, LeBrun EG, Stohlgren TJ, Stabach JA, McDonald DL, Oi DH, LaPolla JS (2015)
Evidence of niche shift and global invasion potential of the Tawny Crazy ant, Nylanderia
fulva. Ecology and Evolution 5: 4628–4641. https://doi.org/10.1002/ece3.1737
Kuznetsova DM, Gongalsky KB (2012) Cartographic analysis of woodlice fauna of the former
USSR. ZooKeys 176: 1–11. https://doi.org/10.3897/zookeys.176.2372
Le Maitre DC, Thuiller W, Schonegevel L (2008) Developing an approach to defining the
potential distributions of invasive plant species: a case study of Hakea species in South
Africa. Global Ecology and Biogeography 17: 569–584. https://doi.org/10.1111/j.1466-
8238.2008.00407.xInvasion stages and potential distributions of seven exotic terrestrial isopods in Japan 73
Lilleskov EA, Mattson WJ, Storer AJ (2008) Divergent biogeography of native and introduced
soil macroinvertebrates in North America north of Mexico. Diversity and Distributions
14: 893–904. https://doi.org/10.1111/j.1472-4642.2008.00487.x
Mason SC, Palmer G, Fox R, Gillings S, Hill JK, Thomas CD, Oliver TH (2015) Geographical
range margins of many taxonomic groups continue to shift polewards. Biological Journal
of the Linnean Society 115: 586–597. https://doi.org/10.1111/bij.12574
McNeill MR, Phillips CB, Robinson AP, Alders L, Richards N, Young S, Dowsett C, James T,
Bell N (2017) Defining the biosecurity risk posed by transported soil: Effects of storage
time and environmental exposure on survival of soil biota. Neobiota 32: 65–88. https://
doi.org/10.3897/neobiota.32.9784
National Museum of Nature and Science (2014) S-Net. http://science-net.kahaku.go.jp/
Nunomura N (2007) Armadillidium vulgare is exotic species. In: The Japanese Society of Soil
Zoology (Ed.) Practical guide to soil zoology: From sampling to data analysis. Tokai Uni-
versity Press, Hatano, 223–224. [In Japanese]
Nunomura N (2015) Crustacea, Isopoda. In: Aoki J (Ed.) Pictorial keys to soil animals of Ja-
pan, the second edition. Tokai University Press, Hatano, 997–1066. [In Japanese]
Orgiazzi A, Bardgett RD, Barrios E, Behan-Pelletier V, Briones MJI, Chotte JL, De Deyn GB,
Eggleton P, Fierer N, Fraser T, Hedlund K, Jeffery S, Johnson NC, Jones A, Kandeler E, Kane-
ko N, Lavelle P, Lemanceau P, Miko L, Montanarella L, Moreira FMS, Ramirez KS, Scheu
S, Singh BK, Six J, van der Putten WH, Wall DH (2016) Global Soil Biodiversity Atlas.
European Commission, Publications Office of the European Union, Luxembourg, 176 pp.
Pateman RM, Thomas CD, Hayward SAL, Hill JK (2016) Macro- and microclimatic interac-
tions can drive variation in species’ habitat associations. Global Change Biology 22: 556–
566. https://doi.org/10.1111/gcb.13056
Peterson AT, Soberón J, Pearson RG, Anderson RP, Martínez-Meyer E, Nakamura M, Araújo
MB (2011) Ecological niches and geographic distributions. Princeton University Press,
New Jersey, 314 pp.
Phillips SJ, Anderson RP, Schapire RE (2006) Maximum entropy modeling of species geo-
graphic distributions. Ecological Modelling 190, 231–259. https://doi.org/10.1016/j.ecol-
model.2005.03.026
Phillips SJ, Dudík M, Schapire RE (2017) Maxent software for modeling species niches and
distributions (Version 3.4.1). http://biodiversityinformatics.amnh.org/open_source/max-
ent/ [Accessed on 2017-05-06]
R Core Team (2017) R: A language and environment for statistical computing. R Foundation
for Statistical Computing, Vienna, Austria. https://www.R-project.org/
Ray D, Behera MD, Jacob J (2016) Improving spatial transferability of ecological niche model
of Hevea brasiliensis using pooled occurrences of introduced ranges in two biogeographic
regions of India. Ecological Informatics 34: 153–163. https://doi.org/10.1016/j.eco-
inf.2016.06.003
Schmalfuss H (2003) World catalog of terrestrial isopods (Isopoda: Oniscidea). Stuttgarter
Beiträge zur Naturkunde, Serie A 654: 1–341. http://www.oniscidea-catalog.naturkunde-
museum-bw.de/Cat_terr_isop.pdf
Sfendourakis S, Taiti S (2015) Patterns of taxonomic diversity among terrestrial isopods. ZooK-
eys 515: 13–25. https://doi.org/10.3897/zookeys.515.933274 Shigenori Karasawa & Kensuke Nakata / BioRisk 13: 53–76 (2018)
Simberloff D, Martin JL, Genovesi P, Maris V, Wardle DA, Aronson J, Courchamp F, Galil
B, García-Berthou E, Pascal M, Pyšek P, Sousa R, Tabacchi E, Vilà M (2013) Impacts of
biological invasions: what’s what and the way forward. Trends in Ecology & Evolution 28:
58–66. https://doi.org/10.1016/j.tree.2012.07.013
Verhoeff KW (1928) Über einige Isopoden der Zoologischen Staatssammlung in München. 38.
Isopoden-Aufsatz. Zoologischer Anzeiger 76: 25–36.
Watanabe H (1991) Terrestrial isopods and their habitats: a case study in Shiga-cho, Shiga
prefecture, western Japan. In: Veeresh GK, Rajagopal D, Viraktamath CA (Eds) Advances
in Management and Conservation of Soil Fauna. Oxford & IBH Publishing Co. Pvt. Ltd.,
New Delhi, 865–870.
Wisz MS, Hijmans RJ, Li J, Peterson AT, Graham CH, Guisan A, NCEAS Predicting Species
Distributions Working Group (2008) Effects of sample size on the performance of species
distribution models. Diversity and Distributions 14: 763–773. https://doi.org/10.1111/
j.1472-4642.2008.00482.x
Yamasaki F, Yoshida M (2017) Record of Armadillidium nasatum corrected from Tokyo.
Edaphologia 101: 33–34. [In Japanese]
Zhu H, Kumar S, Neven LG (2017) Codling moth (Lepidoptera: Tortricidae) establishment
in China: stages of invasion and potential future distribution. Journal of Insect Science 17:
1–10. https://doi.org/10.1093/jisesa/iex054
Zimmer M (2004) The role of woodlice (Isopoda: Oniscidea) in mediating the decomposition
of leaf litter. In: Hanna SHS, Mikhaïl WZA (Eds) Soil Zoology for Sustainable Develop-
ment in the 21st Century. Cairo, Selbstverlag, 285–311.
Zimmer M, Topp W (1999) Relationships between woodlice (Isopoda: Oniscidea) and micro-
bial density and activity in the field. Biology and Fertility of Soils 30: 117–123. https://doi.
org/10.1007/s003740050597
Zimmer M, Topp W (2000) Species-specific utilization of food sources by sympatric woodlice
(Isopoda: Oniscidea). Journal of Animal Ecology 69: 1071–1082. https://doi.org/10.1111/
j.1365-2656.2000.00463.x
Supplementary material 1
Row distribution data used to construct ENMs
Authors: Shigenori Karasawa, Kensuke Nakata
Data type: occurence
Copyright notice: This dataset is made available under the Open Database License
(http://opendatacommons.org/licenses/odbl/1.0/). The Open Database License
(ODbL) is a license agreement intended to allow users to freely share, modify, and
use this Dataset while maintaining this same freedom for others, provided that the
original source and author(s) are credited.
Link: https://doi.org/10.3897/biorisk.13.23514.suppl1Invasion stages and potential distributions of seven exotic terrestrial isopods in Japan 75 Supplementary material 2 How to use a searching system for distributions of terrestrial isopods in Japan Authors: Shigenori Karasawa, Kensuke Nakata Data type: multimedia Copyright notice: This dataset is made available under the Open Database License (http://opendatacommons.org/licenses/odbl/1.0/). The Open Database License (ODbL) is a license agreement intended to allow users to freely share, modify, and use this Dataset while maintaining this same freedom for others, provided that the original source and author(s) are credited. Link: https://doi.org/10.3897/biorisk.13.23514.suppl2 Supplementary material 3 Pearson’s correlation coefficients (r) between climatic variables for the global model (Japan, Europe and North America) Authors: Shigenori Karasawa, Kensuke Nakata Data type: statistical data Copyright notice: This dataset is made available under the Open Database License (http://opendatacommons.org/licenses/odbl/1.0/). The Open Database License (ODbL) is a license agreement intended to allow users to freely share, modify, and use this Dataset while maintaining this same freedom for others, provided that the original source and author(s) are credited. Link: https://doi.org/10.3897/biorisk.13.23514.suppl3 Supplementary material 4 Pearson’s correlation coefficients (r) between climatic variables for the regional model Authors: Shigenori Karasawa, Kensuke Nakata Data type: statistical data Copyright notice: This dataset is made available under the Open Database License (http://opendatacommons.org/licenses/odbl/1.0/). The Open Database License (ODbL) is a license agreement intended to allow users to freely share, modify, and use this Dataset while maintaining this same freedom for others, provided that the original source and author(s) are credited. Link: https://doi.org/10.3897/biorisk.13.23514.suppl4
76             Shigenori Karasawa & Kensuke Nakata / BioRisk 13: 53–76 (2018)

Supplementary material 5
AUC and variable contributions of the regional model
Authors: Shigenori Karasawa, Kensuke Nakata
Data type: statistical data
Copyright notice: This dataset is made available under the Open Database License
   (http://opendatacommons.org/licenses/odbl/1.0/). The Open Database License
   (ODbL) is a license agreement intended to allow users to freely share, modify, and
   use this Dataset while maintaining this same freedom for others, provided that the
   original source and author(s) are credited.
Link: https://doi.org/10.3897/biorisk.13.23514.suppl5
You can also read