Development and evaluation of a deep neural network for histologic classification of renal cell carcinoma on biopsy and surgical resection slides ...
←
→
Page content transcription
If your browser does not render page correctly, please read the page content below
www.nature.com/scientificreports
OPEN Development and evaluation
of a deep neural network
for histologic classification
of renal cell carcinoma on biopsy
and surgical resection slides
Mengdan Zhu1, Bing Ren2, Ryland Richards2, Matthew Suriawinata1, Naofumi Tomita1 &
Saeed Hassanpour1,3,4,5*
Renal cell carcinoma (RCC) is the most common renal cancer in adults. The histopathologic
classification of RCC is essential for diagnosis, prognosis, and management of patients.
Reorganization and classification of complex histologic patterns of RCC on biopsy and surgical
resection slides under a microscope remains a heavily specialized, error-prone, and time-consuming
task for pathologists. In this study, we developed a deep neural network model that can accurately
classify digitized surgical resection slides and biopsy slides into five related classes: clear cell RCC,
papillary RCC, chromophobe RCC, renal oncocytoma, and normal. In addition to the whole-slide
classification pipeline, we visualized the identified indicative regions and features on slides for
classification by reprocessing patch-level classification results to ensure the explainability of our
diagnostic model. We evaluated our model on independent test sets of 78 surgical resection whole
slides and 79 biopsy slides from our tertiary medical institution, and 917 surgical resection slides
from The Cancer Genome Atlas (TCGA) database. The average area under the curve (AUC) of our
classifier on the internal resection slides, internal biopsy slides, and external TCGA slides is 0.98
(95% confidence interval (CI): 0.97–1.00), 0.98 (95% CI: 0.96–1.00) and 0.97 (95% CI: 0.96–0.98),
respectively. Our results suggest that the high generalizability of our approach across different data
sources and specimen types. More importantly, our model has the potential to assist pathologists
by (1) automatically pre-screening slides to reduce false-negative cases, (2) highlighting regions
of importance on digitized slides to accelerate diagnosis, and (3) providing objective and accurate
diagnosis as the second opinion.
Kidney cancer is among the ten most common cancers w orldwide1,2, and approximately 90% of all kidney can-
cers are renal cell carcinoma (RCC)3. The classification of RCC consists of three major histologic RCC subtypes.
Clear cell renal cell carcinoma (ccRCC) is the most common subtype (around 75% of all cases), papillary renal
cell carcinoma (pRCC) accounts for about 15–20% of RCC, and chromophobe renal cell carcinoma (chRCC)
makes up approximately 5% of RCC4. The classic morphologic features of ccRCC include compact, alveolar,
tubulocystic or rarely papillary architecture of cells with clear cytoplasm and characteristic network of small,
thin-walled vessels5. Papillae or tubulopapillary architecture with fibrovascular cores and frequently with foamy
macrophages are identified pRCC6. Of note, although renal oncocytoma is the most common benign renal tumor
type, it still remains difficult to distinguish clinically from renal cell carcinoma including chRCC7. There are well-
documented disparities in histologic appearances of chRCC and renal oncocytoma: chRCC shows prominent
cell border, raisinoid nuclei and perinuclear halo, while oncocytoma displays nested architecture with myxoid
1
Department of Biomedical Data Science, Geisel School of Medicine at Dartmouth, Hanover, NH 03755,
USA. 2Department of Pathology and Laboratory Medicine, Dartmouth-Hitchcock Medical Center, Lebanon,
NH 03756, USA. 3Department of Computer Science, Dartmouth College, Hanover, NH 03755, USA. 4Department
of Epidemiology, Geisel School of Medicine at Dartmouth, Hanover, NH 03755, USA. 5One Medical Center Drive,
HB 7261, Lebanon, NH 03756, USA. *email: Saeed.Hassanpour@dartmouth.edu
Scientific Reports | (2021) 11:7080 | https://doi.org/10.1038/s41598-021-86540-4 1
Vol.:(0123456789)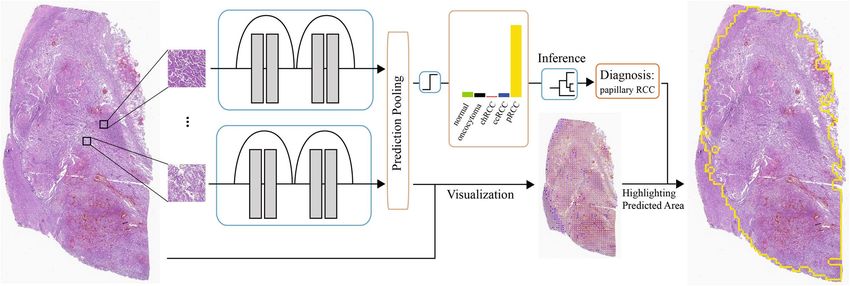
www.nature.com/scientificreports/
Subtype Accuracy Precision Recall F1-score AUROC
1.00 1.00 1.00 1.00 1.00
Normal
(1.00–1.00) (1.00–1.00) (1.00–1.00) (1.00–1.00) (1.00–1.00)
0.97 1.00 0.80 0.89 0.97
Oncocytoma
(0.95–1.00) (1.00–1.00) (0.63–0.95) (0.77–0.97) (0.91–1.00)
0.94 0.93 0.78 0.85 0.98
Chromophobe RCC
(0.90–0.97) (0.84–1.00) (0.65–0.89) (0.76–0.92) (0.95–1.00)
0.97 0.91 1.00 0.95 0.98
Clear cell RCC
(0.95–1.00) (0.83–0.98) (1.00–1.00) (0.91–0.99) (0.96–1.00)
0.96 0.87 1.00 0.93 0.99
Papillary RCC
(0.94–0.99) (0.78–0.95) (1.00–1.00) (0.88–0.97) (0.98–1.00)
0.97 0.94 0.92 0.92 0.98
Average
(0.95–0.98) (0.91–0.97) (0.87–0.95) (0.88–0.96) (0.97–1.00)
Table 1. Model’s performance on 78 surgical resection whole-slide images in our independent test set from
DHMC. The 95% confidence interval is also included for each measure.
Subtype Accuracy Precision Recall F1–score AUROC
1.00 1.00 1.00 1.00 1.00
Normal
(1.00–1.00) (1.00–1.00) (1.00–1.00) (1.00–1.00) (1.00–1.00)
0.96 0.86 0.82 0.84 0.97
Chromophobe RCC
(0.96–0.97) (0.82–0.89) (0.78–0.85) (0.81–0.86) (0.95–0.98)
0.91 0.98 0.86 0.91 0.95
Clear cell RCC
(0.90–0.92) (0.97–0.98) (0.85–0.87) (0.91–0.92) (0.94–0.97)
0.92 0.85 0.93 0.89 0.96
Papillary RCC
(0.92–0.93) (0.83–0.87) (0.92–0.95) (0.87–0.90) (0.95–0.97)
0.95 0.92 0.90 0.91 0.97
Average
(0.95–0.96) (0.91–0.94) (0.89–0.92) (0.90–0.92) (0.96–0.98)
Table 2. Model’s performance metrics and their 95% confidence intervals on 917 surgical resection whole-
slide images from the TCGA database.
or hyalinized stroma and cells with eosinophilic or granular cytoplasm and small round nuclei. However, the
eosinophilic variant of chRCC can mimic the histologic features of oncocytoma, given their similar histogenesis8.
Histological classification of RCC is of great importance in patient’s care, as RCC subtypes have significant
implication in the prognosis and treatment of renal t umors9–11. Inspection and examination of complex RCC
histologic patterns under the microscope, however, remain a time-consuming and demanding task for patholo-
gists. The manual classification of RCC has shown a high rate of inter-observer and intra-observer v ariability12,
as renal tumors can have varied appearances and combined morphologic features, making classification difficult.
With the advent of whole-slide images in digital pathology, automated histopathologic image analysis systems
have shown great promise for diagnostic p urposes13–15. Computerized image analysis has the advantage of provid-
ing a more efficient, objective, and consistent evaluation to assist pathologists in their medical decision-making
processes. In recent years, significant progress has been made in applying deep learning techniques, especially
convolutional neural networks (CNNs), to a wide range of computer vision tasks as well as biomedical imaging
analysis applications16–18. CNN-based models can automatically process digitized histopathology images and
learn to extract cellular patterns associated with the presence of t umors19–21.
In this study, we developed a CNN-based model for classification of renal cell carcinoma based on surgical
resection slides. We used resection slides from our tertiary medical institution, Dartmouth-Hitchcock Medical
Center (DHMC), which include rare subtypes, such as normal, renal oncocytomas, and chRCC, for the develop-
ment of our model. We evaluated this model on 78 independent surgical resection slides from our institution and
917 surgical resection RCC slides from The Cancer Genome Atlas (TCGA) database. Furthermore, we evaluated
this model for RCC classification on 79 biopsy slides from our institution. The study presented in this paper
utilizes deep neural networks to automatically and accurately differentiate RCC from benign renal tumor cases
and classify RCC subtypes on both surgical resection and biopsy slides.
Results
Table 1 summarizes the per-class and average evaluation of our model on the first test set of surgical resection
whole-slide images from DHMC. Our model achieved a mean accuracy of 0.97, a mean precision of 0.94, a mean
recall of 0.92, a mean F1-score of 0.92, and a mean AUC of 0.98 (95% CI: 0.97–1.00) on this internal test set of
resection slides. Table 2 shows the performance summary of our model on whole-slide images from the kidney
renal carcinoma collection of the TCGA databases. We achieved high performance on these external resection
whole-slide images with a mean accuracy of 0.95, a mean precision of 0.92, a mean recall of 0.90, a mean F1-score
of 0.91, and a mean AUC of 0.97 (95% CI: 0.96–0.98). Table 3 presents the per-class and mean performance
metrics of our model on 79 biopsy whole-slide images from DHMC. Our model shows great generalizability on
Scientific Reports | (2021) 11:7080 | https://doi.org/10.1038/s41598-021-86540-4 2
Vol:.(1234567890)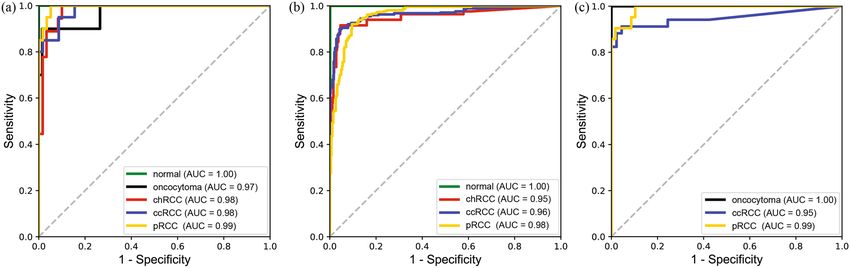
www.nature.com/scientificreports/
Subtype Accuracy Precision Recall F1–score AUROC
0.96 1.00 0.87 0.93 1.00
Oncocytoma
(0.94–0.99) (1.00–1.00) (0.79–0.95) (0.88–0.98) (1.00–1.00)
0.96 1.00 0.91 0.95 0.95
Clear cell RCC
(0.94–0.99) (1.00–1.00) (0.85–0.97) (0.92–0.98) (0.89–1.00)
0.97 0.91 1.00 0.95 0.99
Papillary RCC
(0.95–1.00) (0.83–0.98) (1.00–1.00) (0.91–0.99) (0.97–1.00)
0.97 0.97 0.93 0.95 0.98
Average
(0.94–0.99) (0.94–0.99) (0.88–0.97) (0.90–0.98) (0.96–1.00)
Table 3. Model’s performance metrics and their 95% confidence intervals on 79 biopsy whole-slide images
from DHMC.
Figure 1. Each confusion matrix compares the classification agreement of our model with pathologists’
consensus for each of our three test sets: (a) surgical resection whole-slide images from DHMC, (b) surgical
resection whole-slide images from TCGA, and (c) biopsy whole-slide images from DHMC.
Figure 2. Receiver operating characteristic curves for (a) surgical resection whole-slide images from DHMC,
(b) surgical resection whole-slide images from TCGA, and (c) biopsy whole-slide images from DHMC.
the internal biopsy test set, with a mean accuracy of 0.97, a mean precision of 0.97, a mean recall of 0.93, a mean
F1-score of 0.95, and a mean AUC of 0.98 (95% CI: 0.96–1.00).
Of note, our pipeline is the same for resection and biopsy slides and processes each slide using the same
method and parameters. Typical biopsy core specimens include 2 to 8 biopsy cores. In this study, the biopsy
cores were analyzed and evaluated together at the slide level. Some biopsy cores may only consist of benign
renal parenchyma, and some biopsy cores may contain an insufficient amount of lesional tissue; therefore, our
approach considered all biopsy cores together at the level of slide.
The confusion matrices for each of our three test sets are shown in Fig. 1. Overall, the normal cases could
be easily recognized by our model, whereas a minor portion of oncocytoma cases could be misclassified as
chromophobe RCC and papillary RCC in both surgical resection cases and biopsy cases. We provide a detailed
error analysis in the discussion section. The Receiver Operating Characteristic (ROC) curves of all the test sets
are plotted in Fig. 2.
Scientific Reports | (2021) 11:7080 | https://doi.org/10.1038/s41598-021-86540-4 3
Vol.:(0123456789)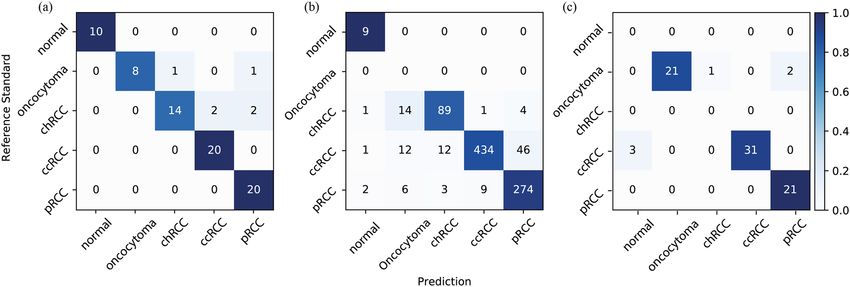
www.nature.com/scientificreports/
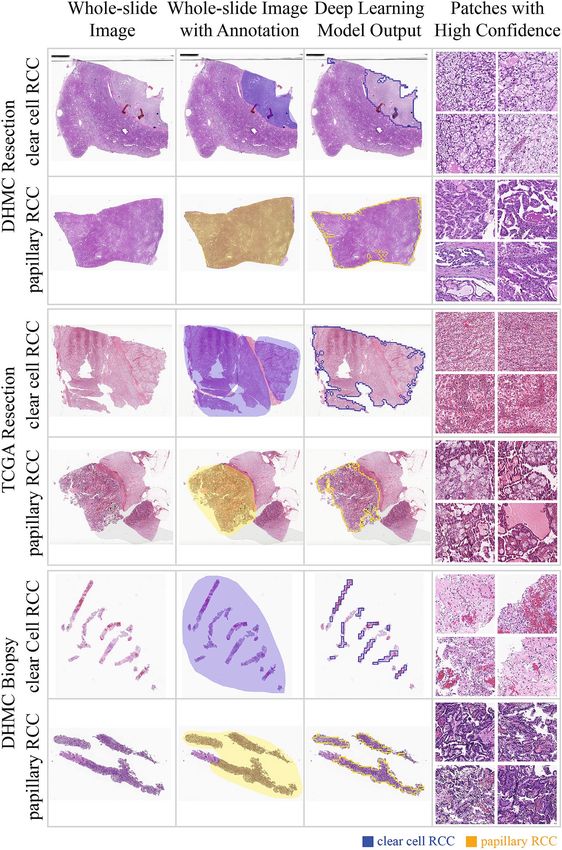
We visualize the patches on whole-slide images in our test sets with a color-coded scheme according to the
classes predicted by our model. This visualization provides pathologists with insights into the major regions and
features that contribute to the classification decisions of our method, to avoid the “black-box” approach toward
the outputs. Figure 3 shows a sample visualization for slides from each test set. More visualization examples
from the DHMC surgical resection test set are included in Figure S1 in the Supplementary Material. In addi-
tion, Figure S3 shows the visualization of patch-level classifications using GradCAM method to enhance the
interpretability of our model22.
Discussion
Classification of renal cell carcinoma subtype is a clinically important task that enables clinicians to predict
prognosis and to choose the optimal management for patients with RCC. Different RCC subtypes may have
different prognosis, underlining the importance of differentiation of these subtypes. Clear cell RCC has a worse
prognosis compared to chromophobe or papillary RCC at the same stage23–26. Of note, the most common benign
renal tumor is oncocytoma (3–7% of all renal tumors) and is known for mimicking RCC on histology s lides27.
Therefore, it is very important to recognize different subtypes of RCC as well as benign renal neoplasms such
as oncocytoma.
This study proposed and evaluated a deep neural network model for automated renal cell carcinoma clas-
sification on both surgical resection and biopsy whole-slide images. We chose ResNet-18 architecture as the
backbone of our pipeline, which involved a patch-prediction aggregation strategy. Our final model achieved an
average F1-score of 0.92, 0.91, and 0.95 for independent resection whole-slide image test sets from DHMC and
TCGA databases, and DHMC biopsy whole-slide images, respectively. This study is the first step toward utiliz-
ing deep learning methods to automatically classify RCC subtypes and oncocytoma on histopathology images.
Previous work on machine learning applications to kidney cancer histopathology is mostly focused on resec-
tion slides and three RCC subtypes, without the consideration of benign or oncocytoma classes, with validation
on a single test s et17,28–30. To distinguish between chRCC and oncocytoma classes, which are less common in
public datasets, we used region-of-interest annotations to develop a highly accurate patch classifier. Recently, a
combination of a convolutional neural network and directed cyclic graph-support vector machine (DAG-SVM)
was used for the classification of three RCC subtypes using the TCGA d ataset17. Another common method in
digital pathology is using a weakly supervised approach with a multiple instance learning framework to train a
diagnostic model without region-of-interest a nnotations31,32. Our study stands out from this previous study for
several reasons: (1) our approach follows a more intuitive methodology based on patch-level confidence scores
and achieved an average AUC of > 0.95 on the test sets; (2) our method was evaluated on both DHMC and TCGA
datasets to show its generalizability on surgical resection whole-slide images, establishing a strong baseline for
future studies in the classification of renal cell carcinoma subtypes; (3) our study includes identification of benign
renal neoplasm, oncocytoma, in addition to all major RCC subtypes; and (4) we showed the application and
generalizability of our model to a test set of biopsy whole-slide images, which also achieved promising results.
Of note, because the TCGA dataset is focused on malignant cancer cases, oncocytoma, a benign subtype, does
not exist among the TCGA whole-slide images. Therefore, this subtype was not included in the surgical resection
slides in our external test set. Additionally, chromophobe RCC makes up about 5% of RCC occurrences and
we could only identify a few chromophobe biopsy slides at DHMC. Similarly, for clinical purposes, only a few
normal biopsy slides are stored at DHMC, as more emphasis is put on renal tumor biopsy slides. Considering the
prevalence and availability of chromophobe biopsy slides, and the availability of normal slides at our institution,
we excluded chromophobe RCC and normal class from our biopsy test set, and evaluated our model on the two
major RCC subtypes (i.e., clear cell RCC and papillary RCC) and the major renal benign tumor type (i.e., renal
oncocytoma). Notably, the generalizability of our model to biopsy whole-slide images has a wide range of appli-
cation, as it could assist clinicians with fast and reliable diagnoses and follow-up recommendations for patients.
Manual histopathological analysis is a tedious and time-consuming task that could induce errors and vari-
ability among different pathologists. Our model addresses this limitation by providing a new technology that
has the potential to help pathologists achieve a more efficient, objective, and accurate diagnosis and classification
of renal cell carcinoma. In particular, our approach could provide clinical assistance and a second opinion to
general surgical pathologists that are not specialized in genitourinary pathology.
Our error analysis shown in Figure S2 in the Supplementary Material demonstrates that the misclassifications
of our model are mainly due to the atypical morphologic patterns in the histopathologic images. In the DHMC
resection test set, chromophobe RCC is misclassified as clear cell RCC because of the substantial clear cytoplasm
and thin walled vasculature in the images (Figure S2a). Oncocytoma is misclassified as chromophobe RCC or
papillary RCC due to focal tubular growth pattern and less characteristic stroma present (Figure S2b). In the
TCGA test set, papillary RCC is misclassified as clear cell RCC due to focal tumor cells with clear cytoplasm and
thin walled vasculature (Figure S2c) and clear cell RCC is misclassified as papillary RCC due to focal papillary
formation and less clear cytoplasm (Figure S2d). In the DHMC biopsy test set, we observed focal tubular growth
pattern and tumor cell cluster formation in oncocytoma cases, and these patterns share overlaying features with
pRCC and may be mistakenly recognized as pRCC by our model. In our model’s errors for ccRCC cases, the
tumor area consisted less than 5% of whole tissue, which was below the abnormality threshold in our approach
and caused misclassification (Figure S3). Additional error analysis at whole-slide level is included in Figure S3
in Supplementary Materials.
As a future direction, we plan to expand our dataset and test sets through external collaborations for a more
robust and extensive evaluation of RCC subtypes. This extension will include rare subtypes and classes, such
as clear-cell papillary renal cell carcinomas. In addition, Table S3 in Supplementary Materials shows the model
performance on the TCGA test set, stratified by Fuhrman grade. We plan to investigate and identify salient
Scientific Reports | (2021) 11:7080 | https://doi.org/10.1038/s41598-021-86540-4 4
Vol:.(1234567890)www.nature.com/scientificreports/
Figure 3. Examples of visualized slides from our test sets with highlighted regions of interest for predicted
classes using our model. Clear cell RCC and papillary RCC classes are common among the three test sets and
thus are used for this illustration. Top row: A surgical resection whole-slide image in the DHMC test set. Middle
row: A surgical resection whole-slide image from the TCGA test set. Bottom row: A biopsy whole-slide image
from DHMC.
Scientific Reports | (2021) 11:7080 | https://doi.org/10.1038/s41598-021-86540-4 5
Vol.:(0123456789)www.nature.com/scientificreports/
Surgical resection WSIs Biopsy WSIs
DHMC TCGA DHMC
Histologic subtype Training set Dev set Test set #1 Test set #2 Test #3
Normal 15 5 10 9 –
Renal oncocytoma 14 3 10 – 24
Chromophobe RCC 15 5 18 109 –
Clear cell RCC 285 5 20 505 34
Papillary RCC 56 5 20 294 21
Total 385 23 78 917 79
Table 4. Distribution of the collected whole-slide images among renal cell carcinoma and benign subtypes.
“–” indicates the corresponding subtype was not available in the dataset.
morphological features in high-grade cases in future work. According to our error analysis, one of our model’s
limitations is the misclassification of clear cell RCC as normal in the biopsy slides. To address this limitation, we
will pursue developing an adaptive thresholding method that is attentive to differences between biopsy slides
and resection slides. With more available data for rare classes, we expect weakly supervised frameworks could
potentially remove the thresholding requirement for aggregation; however, aggregation methods such as recur-
rent neural networks (RNNs) that are used in these weakly supervised approaches could negatively affect the
interpretability of these models. Moreover, recent studies suggest that weakly supervised learning frameworks
with attention mechanisms are effective for whole-slide classification, which we can utilize in conjunction with
our fully-supervised learning method to further improve the accuracy of our m odel33,34. Another direction of
improvement is to utilize graph-based approaches, such as Slide G raph35, to capture the location information of
features in whole-slide classification. Of note, our proposed whole-slide inference utilizes aggregation of patch-
level predictions, and is permutation invariant and does not consider the location information of patches. Finally,
we plan to implement a prospective clinical trial to validate this approach in clinical settings and quantify its
impact on the efficiency and accuracy of pathologists’ diagnosis of renal cancer.
Materials and methods
Data collection. A total of 486 whole-slide images were collected from patients who underwent renal resec-
tion, including 30 normal slides with benign renal parenchyma and no renal neoplasm, from 2015 to 2019 from
Dartmouth-Hitchcock Medical Center or DHMC, a tertiary medical institution in New Hampshire, USA. These
hematoxylin and eosin (H&E) stained surgical resection slides were digitized by Aperio AT2 scanners (Leica
Biosystems, Wetzlar, Germany) at 20× magnification (0.50 µm/pixel). We partitioned these slides into a train-
ing set of 385 slides, a development (dev) set of 23 slides, and a test set of 78 slides. Additionally, we collected
79 RCC biopsy slides from 2015 to 2017 from DHMC, as well as 917 whole-slide images of kidney cancer from
TCGA for external validation. This study and the use of human participant data in this project were approved by
the Dartmouth-Hitchcock Health Institutional Review Board (IRB) with a waiver of informed consent. The con-
ducted research reported in this article is in accordance with this approved Dartmouth-Hitchcock Health IRB
protocol and the World Medical Association Declaration of Helsinki on Ethical Principles for Medical Research
involving Human S ubjects36. The distribution of whole-slide images that were used in this study is summarized
in Table 4. Additional information about inclusion and exclusion criteria for DHMC datasets are included in
Supplementary Materials, Appendix A.
Data annotation. Two pathologists (R.R. & B.R.) from the Department of Pathology and Laboratory Medi-
cine at DHMC manually annotated the surgical resection whole-slide images in our training and development
sets. In this annotation process, bounding boxes outlining regions of interest (ROIs) for each subtype were gen-
erated using Automated Slide Analysis Platform (ASAP), a fast viewer and annotation tool for high-resolution
histopathology images37. Each ROI was associated and labeled as clear cell RCC, papillary RCC, chromophobe
RCC, oncocytoma, or normal. All annotated ROIs were confirmed by one pathologist at a time before being
broken into fixed-size patches for our model training and validation steps.
Deep neural network for patch classification. Given the large size of high-resolution histology images
and the memory restrictions of currently available computer hardware, it is not feasible to analyze a whole-slide
image all at once. Therefore, in this work, we use a computational framework developed by our group that relies
on deep neural network image analysis on small fixed-size patches with an overlap of 1/3 from the whole-slide
images38. These results are then aggregated through a confidence-based inference mechanism to classify the
whole-slide images. As a result, this framework allows us to analyze a high-resolution, whole-slide image with a
feasible memory requirement. Figure 4 shows the overview of our model in this study.
To do this, we utilized a sliding window a pproach38 on the annotated ROIs in our training and development
sets to generate fixed-size (i.e., 224 × 224 pixels) patches. To balance the dataset, we randomly selected the same
number of 12,240 patches from the training set for each subtype. The distribution of this patch-level dataset is
available in Table S1 in the Supplementary Material. We normalized the color intensity of patches and applied
Scientific Reports | (2021) 11:7080 | https://doi.org/10.1038/s41598-021-86540-4 6
Vol:.(1234567890)www.nature.com/scientificreports/
Figure 4. Overview of our classification pipeline. Tissue patches are extracted from whole-slide images using
a sliding-window method with 1/3 overlap after background removal. Deep neural networks extract histology
features of the patches and compute patch-level confidence scores for each of the target classes. The patch-
level predictions are filtered by low-confidence thresholding and aggregated by computing the percentage of
patches that belong to each class in a whole-slide image. We classify a whole slide using a decision tree based on
the computed percentages of each class. Patch predictions are also used for visualization, which illustrates the
coverage of each class on slides.
standard data augmentation methods, including random horizontal and vertical flips, random 90° rotations, and
color jittering. For model training, we tried four variations of residual neural network (ResNet) architecture with
different numbers of layers: ResNet-18, ResNet-34, ResNet-50 and ResNet-101. All the networks were initialized
using He i nitialization39. These models used the multi-class cross entropy loss function and were trained for 40
epochs with an initial learning rate of 0.001. The learning rate was reduced by a factor of 0.9 every epoch during
the training. The trained models assign a label with a confidence score (i.e., a prediction probability between
0 and 1) for each patch. We compared the trained models in our cross-validation process. Among the trained
models, we selected a ResNet-18 model, which achieved the best average F1-score of 0.96 on the development set,
for further whole-slide inference. The model’s performance on the development set is summarized in Table S2
in the Supplementary Material.
Whole‑slide inference. For whole-slide classification, our approach aggregated patch-level predictions
based on their confidence scores. For each whole-slide image, we automatically processed the image by remov-
ing the white background, breaking down the remaining areas in each whole-slide image into fixed-size (i.e.,
224 × 224 pixels) patches, and feeding the patches to our trained deep neural network to generate a pool of patch-
level predictions. Of note, to enhance the robustness of our method, we removed all low-confidence patches
from this pool so that their confidence scores were less than the threshold of 0.9. We performed a grid search to
find the best threshold for the patch-level confidence score on the development set.
To aggregate the patch-level predictions, we computed the percentage of patches that belongs to each class in
the pool of patches from a whole-slide image. We applied a grid-search optimization on patch-based statistics in
the development set to build our inference criteria for whole-slide inference. In our whole-slide image inference
criteria, if any of the renal subtypes (i.e., clear cell RCC, papillary RCC, chromophobe RCC, or oncocytoma)
accounted for more than 5.0% of the total number of patches, we labeled the whole-slide image as an abnormal
class with the greatest number of patches. Otherwise, we classified the whole-slide image as overall normal. The
details of our grid search process are included in Supplementary Materials, Appendix B.
Evaluation metrics and statistical analysis. To show the accuracy and generalizability of our approach,
we evaluated our method on three different test sets: (1) 78 independent surgical resection whole-slide images
from DHMC, (2) 917 surgical resection whole-slide images from the TCGA database, and (3) 79 biopsy whole-
slide images from DHMC.
In this evaluation, we establish the gold standard for each whole-slide image in our test sets based on the
original institutional label and the verification of a pathologist (R.R.) involved in our study. If there is any disa-
greement, we send the cases to our senior pathologist (B.R.) to resolve the disagreement. For this multi-class
classification, we used precision, recall, the F1-score, and the area under the curve (AUC), as well as confusion
matrices to show the discriminating performance of our approach for renal cancer classification. In addition,
95% confidence intervals (95% CIs) were computed using the bootstrapping method with 10,000 iterations for
all the metrics40.
Received: 17 November 2020; Accepted: 17 March 2021
Scientific Reports | (2021) 11:7080 | https://doi.org/10.1038/s41598-021-86540-4 7
Vol.:(0123456789)www.nature.com/scientificreports/
References
1. Gutierrez Olivares, V. M., Gonzalez Torres, L. M., Hunter Cuartas, G. & Niebles De la Hoz, M. C. Immunohistochemical profile
of renal cell tumours. Rev. Esp. Patol. 52, 214–221. https://doi.org/10.1016/j.patol.2019.02.004 (2019).
2. Hsieh, J. J. et al. Renal cell carcinoma. Nat. Rev. Dis. Primers 3, 17009. https://doi.org/10.1038/nrdp.2017.9 (2017).
3. Chandrasekaran, D., Sundaram, S., Kadhiresan, N. & Padmavathi, R. Programmed death ligand 1; An immunotarget for renal cell
carcinoma. Asian Pac. J. Cancer Prev. 20, 2951–2957. https://doi.org/10.31557/APJCP.2019.20.10.2951 (2019).
4. Ricketts, C. J. et al. The cancer genome atlas comprehensive molecular characterization of renal cell carcinoma. Cell Rep. 23, 3698.
https://doi.org/10.1016/j.celrep.2018.06.032 (2018).
5. Udager, A. M. & Mehra, R. Morphologic, molecular, and taxonomic evolution of renal cell carcinoma a conceptual perspective
with emphasis on updates to the 2016 World Health Organization classification. Arch. Pathol. Lab. Med. 140, 1026–1037. https://
doi.org/10.5858/arpa.2016-0218-RA (2016).
6. Valenca, L. B., Hirsch, M. S., Choueiri, T. K. & Harshman, L. C. Non-clear cell renal cell carcinoma, part 1: histology. Clin. Adv.
Hematol. Oncol. 13, 308–313 (2015).
7. Dey, S., Noyes, S. L., Uddin, G. & Lane, B. R. Palpable abdominal mass is a renal oncocytoma: not all large renal masses are malig-
nant. Case Rep. Urol. 2019, 6016870. https://doi.org/10.1155/2019/6016870 (2019).
8. Tan, P. H. et al. Renal tumors: diagnostic and prognostic biomarkers. Am. J. Surg. Pathol. 37, 1518–1531. https://doi.org/10.1097/
PAS.0b013e318299f12e (2013).
9. Decastro, G. J. & McKiernan, J. M. Epidemiology, clinical staging, and presentation of renal cell carcinoma. Urol. Clin. N. Am. 35,
581–592. https://doi.org/10.1016/j.ucl.2008.07.005 (2008).
10. Lopez-Beltran, A., Scarpelli, M., Montironi, R. & Kirkali, Z. 2004 WHO classification of the renal tumors of the adults. Eur. Urol.
49, 798–805. https://doi.org/10.1016/j.eururo.2005.11.035 (2006).
11. Muglia, V. F. & Prando, A. Renal cell carcinoma: Histological classification and correlation with imaging findings. Radiol. Bras.
48, 166–174. https://doi.org/10.1590/0100-3984.2013.1927 (2015).
12. Al-Aynati, M. et al. Interobserver and intraobserver variability using the Fuhrman grading system for renal cell carcinoma. Arch.
Pathol. Lab. Med. 127, 593–596 (2003).
13. Korbar, B. et al. Deep learning for classification of colorectal polyps on whole-slide images. J. Pathol. Inform. 8, 30. https://doi.org/
10.4103/jpi.jpi_34_17 (2017).
14. Wei, J. W. et al. Evaluation of a deep neural network for automated classification of colorectal polyps on histopathologic slides.
JAMA Netw. Open 3, e203398. https://doi.org/10.1001/jamanetworkopen.2020.3398 (2020).
15. Wei, J. W. et al. Automated detection of celiac disease on duodenal biopsy slides: A deep learning approach. J. Pathol. Inform. 10,
7. https://doi.org/10.4103/jpi.jpi_87_18 (2019).
16. Hua, K. L., Hsu, C. H., Hidayati, S. C., Cheng, W. H. & Chen, Y. J. Computer-aided classification of lung nodules on computed
tomography images via deep learning technique. Onco Targets Ther. 8, 2015–2022. https://doi.org/10.2147/OTT.S80733 (2015).
17. Tabibu, S., Vinod, P. K. & Jawahar, C. V. Pan-Renal Cell Carcinoma classification and survival prediction from histopathology
images using deep learning. Sci. Rep. 9, 10509. https://doi.org/10.1038/s41598-019-46718-3 (2019).
18. Tomita, N., Cheung, Y. Y. & Hassanpour, S. Deep neural networks for automatic detection of osteoporotic vertebral fractures on
CT scans. Comput. Biol. Med. 98, 8–15. https://doi.org/10.1016/j.compbiomed.2018.05.011 (2018).
19. Araujo, T. et al. Classification of breast cancer histology images using Convolutional Neural Networks. PLoS ONE 12, 4. https://
doi.org/10.1371/journal.pone.0177544 (2017).
20. Coudray, N. et al. Classification and mutation prediction from non-small cell lung cancer histopathology images using deep learn-
ing. Nat. Med. 24, 1559–1567. https://doi.org/10.1038/s41591-018-0177-5 (2018).
21. Cruz-Roa, A. et al. Accurate and reproducible invasive breast cancer detection in whole-slide images: A Deep Learning approach
for quantifying tumor extent. Sci. Rep. 7, 46450. https://doi.org/10.1038/srep46450 (2017).
22. Selvaraju, R. R. et al. in Proceedings of the IEEE International Conference on Computer Vision 618–626.
23. Amin, M. B. et al. Prognostic impact of histologic Subtyping of adult renal epithelial neoplasms—An experience of 405 cases. Am.
J. Surg. Pathol. 26, 281–291. https://doi.org/10.1097/00000478-200203000-00001 (2002).
24. Cheville, J. C., Lohse, C. M., Zincke, H., Weaver, A. L. & Blute, M. L. Comparisons of outcome and prognostic features among
histologic subtypes of renal cell carcinoma. Am. J. Surg. Pathol. 27, 612–624. https://doi.org/10.1097/00000478-200305000-00005
(2003).
25. Steffens, S. et al. Clinical behavior of chromophobe renal cell carcinoma is less aggressive than that of clear cell renal cell carcinoma,
independent of Fuhrman grade or tumor size. Virchows Arch. 465, 439–444. https://doi.org/10.1007/s00428-014-1648-9 (2014).
26. Warren, A. Y. & Harrison, D. WHO/ISUP classification, grading and pathological staging of renal cell carcinoma: standards and
controversies. World J. Urol. 36, 1913–1926. https://doi.org/10.1007/s00345-018-2447-8 (2018).
27. van Oostenbrugge, T. J., Futterer, J. J. & Mulders, P. F. A. Diagnostic imaging for solid renal tumors: A pictorial review. Kidney
Cancer 2, 79–93. https://doi.org/10.3233/KCA-180028 (2018).
28. Hogan, J. J., Mocanu, M. & Berns, J. S. The native kidney biopsy: Update and evidence for best practice. Clin. J. Am. Soc. Nephrol.
11, 354–362. https://doi.org/10.2215/CJN.05750515 (2016).
29. Tian, K. et al. Automated clear cell renal carcinoma grade classification with prognostic significance. PLoS ONE 14, e0222641.
https://doi.org/10.1371/journal.pone.0222641 (2019).
30. Yeh, F. C., Parwani, A. V., Pantanowitz, L. & Ho, C. Automated grading of renal cell carcinoma using whole slide imaging. J. Pathol.
Inform. 5, 23. https://doi.org/10.4103/2153-3539.137726 (2014).
31. Campanella, G. et al. Clinical-grade computational pathology using weakly supervised deep learning on whole slide images. Nat.
Med. 25, 1301–1309 (2019).
32. Wang, S. et al. RMDL: Recalibrated multi-instance deep learning for whole slide gastric image classification. Med. Image Anal. 58,
101549 (2019).
33. Lu, M. Y. et al. Data Efficient and Weakly Supervised Computational Pathology on Whole Slide Images. arXiv preprint 2004.09666
(2020).
34. Tomita, N. et al. Attention-based deep neural networks for detection of cancerous and precancerous esophagus tissue on histo-
pathological slides. JAMA Netw. Open 2, e1914645–e1914645 (2019).
35. Lu, W., Graham, S., Bilal, M., Rajpoot, N., & Minhas, F. in Proceedings of the IEEE/CVF Conference on Computer Vision and Pattern
Recognition Workshops 260–261.
36. World Medical, A. World Medical Association Declaration of Helsinki: Ethical principles for medical research involving human
subjects. JAMA 310, 2191–2194. https://doi.org/10.1001/jama.2013.281053 (2013).
37. GJS, L. https://github.com/geertlitjens/ASAP (2017).
38. Wei, J. W. et al. Pathologist-level classification of histologic patterns on resected lung adenocarcinoma slides with deep neural
networks. Sci. Rep. 9, 3358. https://doi.org/10.1038/s41598-019-40041-7 (2019).
39. He, K. M., Zhang, X. Y., Ren, S. Q., & Sun, J. Delving deep into rectifiers: Surpassing human-level performance on ImageNet clas-
sification. In IEEE International Conference on Computer Vision 1026–1034. https://doi.org/10.1109/Iccv.2015.123 (2015).
40. Wood, M. Bootstrapped confidence intervals as an approach to statistical inference. Organ. Res. Methods 8, 454–470. https://doi.
org/10.1177/1094428105280059 (2005).
Scientific Reports | (2021) 11:7080 | https://doi.org/10.1038/s41598-021-86540-4 8
Vol:.(1234567890)www.nature.com/scientificreports/
Acknowledgements
The authors would like to thank Lamar Moss for his help and suggestions to improve the manuscript.
Author contributions
Concept and design: B.R. and S.H.; Acquisition, analysis, or interpretation of data: B.R., R.R., M.S., and N.T.;
Drafting of the manuscript: M.Z. and N.T.; Critical revision of the manuscript for important intellectual content:
All authors.; Statistical analysis: M.Z. and N.T.; Obtained funding: S.H.; Administrative, technical, or material
support: S.H.; Supervision: S.H.
Funding
This research was supported in part by grants from the US National Library of Medicine (R01LM012837) and
the US National Cancer Institute (R01CA249758).
Competing interests
The authors declare no competing interests.
Additional information
Supplementary Information The online version contains supplementary material available at https://doi.org/
10.1038/s41598-021-86540-4.
Correspondence and requests for materials should be addressed to S.H.
Reprints and permissions information is available at www.nature.com/reprints.
Publisher’s note Springer Nature remains neutral with regard to jurisdictional claims in published maps and
institutional affiliations.
Open Access This article is licensed under a Creative Commons Attribution 4.0 International
License, which permits use, sharing, adaptation, distribution and reproduction in any medium or
format, as long as you give appropriate credit to the original author(s) and the source, provide a link to the
Creative Commons licence, and indicate if changes were made. The images or other third party material in this
article are included in the article’s Creative Commons licence, unless indicated otherwise in a credit line to the
material. If material is not included in the article’s Creative Commons licence and your intended use is not
permitted by statutory regulation or exceeds the permitted use, you will need to obtain permission directly from
the copyright holder. To view a copy of this licence, visit http://creativecommons.org/licenses/by/4.0/.
© The Author(s) 2021
Scientific Reports | (2021) 11:7080 | https://doi.org/10.1038/s41598-021-86540-4 9
Vol.:(0123456789)You can also read