Transcriptome analysis discloses dysregulated genes in normal appearing tumor adjacent thyroid tissues from patients with papillary thyroid ...
←
→
Page content transcription
If your browser does not render page correctly, please read the page content below
www.nature.com/scientificreports
OPEN Transcriptome analysis discloses
dysregulated genes in normal
appearing tumor‑adjacent thyroid
tissues from patients with papillary
thyroid carcinoma
Huiling He1,6,7, Sandya Liyanarachchi1,6,7, Wei Li1,6, Daniel F. Comiskey Jr1,6, Pearlly Yan2,6,
Ralf Bundschuh2,3,4, Altan M. Turkoglu3, Pamela Brock2,6, Matthew D. Ringel5,6* &
Albert de la Chapelle1,6
Papillary thyroid carcinoma (PTC) is the most common type of thyroid cancer. The molecular
characteristics of histologically normal appearing tissue adjacent to the tumor (NAT) from PTC
patients are not well characterized. The aim of this study was to characterize the global gene
expression profile of NAT and compare it with those of normal and tumor thyroid tissues. We
performed total RNA sequencing with fresh frozen thyroid tissues from a cohort of three categories
of samples including NAT, normal thyroid (N), and PTC tumor (T). Transcriptome analysis shows that
NAT presents a unique gene expression profile, which was not associated with sex or the presence of
lymphocytic thyroiditis. Among the differentially expressed genes (DEGs) of NAT vs N, 256 coding
genes and 5 noncoding genes have been reported as cancer genes involved in cell proliferation,
apoptosis, and/or tumorigenesis. Bioinformatics analysis with Ingenuity Pathway Analysis software
revealed that “Cancer, Organismal Injury and Abnormalities, Cellular Response to Therapeutics,
and Cellular Movement” were major dysregulated pathways in the NAT tissues. This study provides
improved insight into the complexity of gene expression changes in the thyroid glands of patients
with PTC.
Thyroid cancer is the most common type of endocrine cancer. It is estimated that nearly 44,280 Americans will
be diagnosed and 2200 will die of the disease in 2 0211. Papillary thyroid carcinoma (PTC) is the most common
form of thyroid cancer, accounting for over 80% of all cases and it occurs about 3 times more often in women
than in men2,3. Early stage of PTC has an excellent prognosis with an overall 5-year survival rate > 95%; how-
ever, later stage of PTC is associated with a poor prognosis. While the underlying factors that result in PTC are
incompletely understood, PTC risk is influenced by both environmental and genetic factors4. Thyroid radiation
exposure during childhood is the most established environmental factor associated with PTC5. Lymphocytic
thyroiditis (LT), the most common benign thyroid disease, often coexists with PTC, although its role in PTC
development is c ontroversial6–8. In most studies, obesity has been associated with a higher incidence of thyroid
cancer9,10. Genetic alterations also play an important role in PTC risk. PTC can occasionally occur in families
and a series of GWAS in different populations identified genomic changes that are associated with increased PTC
risk11. Somatic genetic alterations that cause activation of the MAPK and PI3K-AKT signaling are common in
thyroid cancer12. Mutations in BRAF are particularly common in PTC and can have therapeutic and prognostic
1
Department of Cancer Biology and Genetics, The Ohio State University, Columbus, OH 43210, USA. 2Department
of Internal Medicine, The Ohio State University, Columbus, OH 43210, USA. 3Department of Physics, The Ohio
State University, Columbus, OH 43210, USA. 4Department of Chemistry and Biochemistry, The Ohio State
University, Columbus, OH 43210, USA. 5Division of Endocrinology, Diabetes, and Metabolism, Department
of Internal Medicine, The Ohio State University, Columbus, OH 43210, USA. 6The Ohio State University
Comprehensive Cancer Center, The Ohio State University, McCampbell Hall South Room 565, 1581 Dodd Drive,
Columbus, OH 43210, USA. 7These authors contributed equally: Huiling He and Sandya Liyanarachchi. *email:
matthew.ringel@osumc.edu
Scientific Reports | (2021) 11:14126 | https://doi.org/10.1038/s41598-021-93526-9 1
Vol.:(0123456789)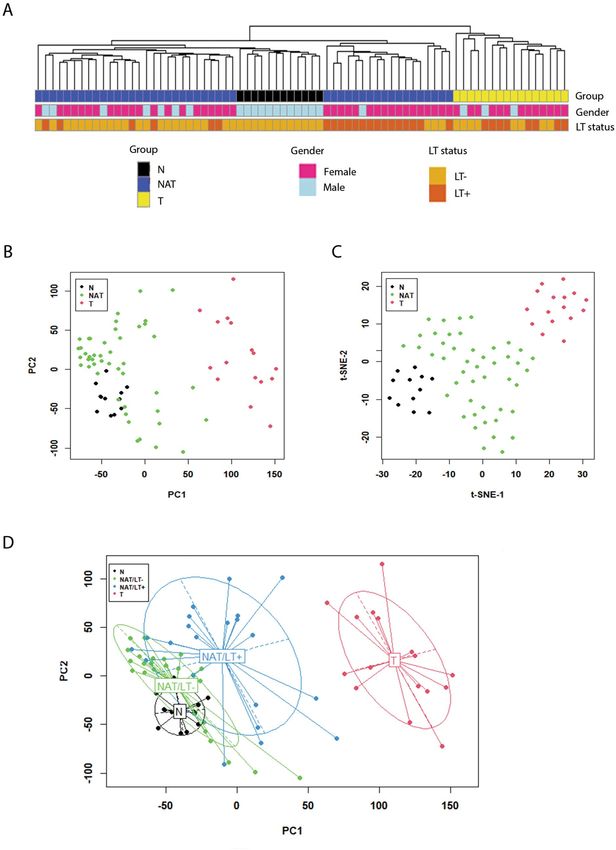
www.nature.com/scientificreports/
implications13–16. High-throughput methods have been developed to measure gene expression profiles and iden-
tify mutations and fusions to improve PTC diagnosis and treatment17–20.
Despite the great advancement in PTC research, the molecular characteristics of histologically normal appear-
ing tissue adjacent to the tumor (NAT) from PTC patients are not well characterized. NAT is commonly used as
a control to enable identification of PTC-specific gene expression profiles of coding and noncoding g enes19,21–24.
However, our knowledge of the gene expression profile changes in NAT of patients with PTC versus those without
PTC is incomplete. Defining PTC NAT-specific genetic alterations might identify alterations in histologically
normal tissue that facilitate PTC oncogenesis and/or progression. For example, we reported previously that
overexpression of miR-221 in PTC-associated N AT21.
Ria et al. compared gene expression levels of histologically normal thyroid tissues from patients with neoplas-
tic and non-neoplastic thyroid diseases and found twenty-eight genes to be differentially expressed in normal tis-
sues surrounding thyroid cancer; however, tumor tissue was not included in this analysis20. Aran et al. compared
RNA-seq data sets from heathy tissue samples obtained at autopsy generated as part of the Genotype-Tissue
Expression (GTEx) project with NAT tissues from a variety of cancer types analyzed in The Cancer Genome
Atlas (TCGA)25. They described unique gene expression profiles of NAT in several tumor types, including thyroid
cancer25. While enabling important comparisons between NAT and normal tissue, postmortem mRNA degrada-
tion in autopsy in the normal tissue may introduce important differences from snap frozen N AT26. In addition,
the impact of the co-existence of LT and patterns of sex-biased gene expression were not addressed27–31. While it is
not clear whether sex-biased expression is present in NAT, PTC has a marked female sex predisposition suggest-
ing it may be important in this d isease32. Overall, while useful for PTC diagnostics, the use of NAT as the baseline
for comparative gene expression studies may mask early changes preceding the appearance of histologically
recognizable tumor that might enable deeper understanding of the requirements for PTC development, more
might be influenced by changes in adjacent tissues that occur in response to the tumor. To address this gap in
knowledge, we compared gene expression profiles in snap-frozen thyroid tissues of normal thyroid from patients
without thyroid cancer, NAT and PTC to identify molecular changes in gene expression unique to the NAT.
Results
Evaluation of expression patterns with bulk RNA‑seq data. We performed whole transcriptome
sequencing (RNA-seq) on three groups of thyroid tissue samples, N (n = 12), NAT (n = 46), and T (n = 16). The T
samples were paired with NAT in 16 out of the 46 patients. Deconvolution analysis confirmed a high percentage
of thyroid cells in each sample (Supplemental Fig. S1). After filtering genes with zero counts and low expression
levels, 22,411 genes were used for analysis. Based on the read counts of these genes, the 74 RNA-seq samples
were hierarchically clustered without supervision. The N and NAT samples clustered together, while the T sam-
ples clustered as a separate sub-group (Fig. 1A). Samples with co-existing LT on histopathology were identified
(NAT/LT+). Among the 21 NAT-PTC/LT+ samples, 15 samples clustered together while 6 samples were scat-
tered with NAT samples without LT (NAT/LT−).
We performed dimensionality reduction analysis to compare the transcriptomes of all 74 samples. Princi-
pal component (PCA) analysis and t-Distributed Stochastic Neighbor embedding (t-SNE) plots are shown in
Fig. 1B,C. Gene expression patterns tended to correlate with sample groups, with N samples found clustered
tightly relative to the other two groups. In general, the NAT samples constituted an intermediate expression state
between N and T; the expression profiles of NAT were closer to the N tissue cluster. In addition, the NAT/LT+
and NAT/LT− showed differences in gene expression patterns as seen in the PCA plot (Fig. 1D).
Differentially expressed genes (DEGs) between NAT and N. We performed DEG analysis com-
paring NAT and N samples. The cut-off for differential expression was a change of at least 1.5-fold and a BH
multiple testing corrected p-value < 0.05 (model was adjusted for age, gender, and LT), and 1000 permutation
p-value < 0.05. Ultimately, we obtained 650 DEGs between NAT and N using these criteria.
To assess for possible sex effect on the NAT DEGs, we compared gene expression levels between NAT from
females (n = 37) and males (n = 9) and identified 52 sex-different genes (Supplemental Table S2). Notably, 22
(42.3%) sex-different genes were found in the Y chromosome, while 7 (13.5%) genes were in the X chromosome
and 23 (44.2%) in autosomes. In contrast, among the DEGs of NAT vs N, the majority (623, 96.3%) were in auto-
somes, 23 (3.5%) genes were in the X chromosome, and none in the Y chromosome. There were 4 sex-difference
genes overlapping with the DEGs of NAT vs N, which were removed for subsequent analysis. Of the final 646
DEGs of NAT vs N, protein coding genes accounted for 273 (42.3%), with 131 (48.0%) upregulated and 142
(52.0%) downregulated. The top 40 coding DEGs are shown in Table 1. The rest of the 373 (57.7%) genes, can be
categorized as: pseudogenes (n = 244), lincRNAs (n = 26), snRNA (n = 20), snoRNA (n = 17), antisense (n = 20),
processed transcripts (n = 14), sense_intronic (n = 11), misc RNA (n = 11), scaRNA (n = 5), sense_overlapping
(n = 2), TEC (n = 2), and retained intron (n = 1). The noncoding genes in the categories of lincRNA, lncRNA,
snRNA, snoRNA, and scaRNA are provided in Table 2. Data on the classification and description of gene biotypes
can be found in Ensemble (http://useast.ensembl.org/info/genome/genebuild/biotypes.html). The 646 DEGs
between NAT and N are provided in Supplemental Table S3.
To investigate the impact of LT, we first performed differential gene expression analysis of NAT/LT− vs N and
NAT/LT+ vs NAT/LT− using the criteria described above, and obtained 632 DEGs and 1793 DEGs, respectively.
The 632 DEGs between NAT/LT− and N are provided in Supplemental Table S4. There are 474 common DEGs
between NAT vs N and NAT/LT− vs N (Fig. 2). All the top 40 coding DEGs and the top 40 non-coding DEGs of
NAT vs N are present among the DEGs of NAT/LT− vs N except one coding gene (Tables 1, 2). In contrast, there
are only 37 common DEGs of all NAT vs N with NAT/LT+ vs NAT/LT− gene list (Fig. 2). Of the 37 LT-related
genes, 23 showed opposite directions of gene expression between the two comparisons.
Scientific Reports | (2021) 11:14126 | https://doi.org/10.1038/s41598-021-93526-9 2
Vol:.(1234567890)www.nature.com/scientificreports/
Figure 1. Gene expression patterns and correlation with clinical information. (A) Sample clusters. Euclidean distance
and average linkage clustering method was used. Gender and the presence of lymphocytic thyroiditis (LT) in each
sample are marked with color bars. (B) Plot of principal component analysis. (C) t-SNE plot. (D) Principal component
analysis with confidence ellipses according to tissue type. A total of 22,411 genes after filtering were included in the
analysis. All the plots were created with log transformed normalized gene expression estimates.
Scientific Reports | (2021) 11:14126 | https://doi.org/10.1038/s41598-021-93526-9 3
Vol.:(0123456789)www.nature.com/scientificreports/
Gene IDb Gene name P valuec Fold change (NAT/N) DEGs of NAT/LT− vs Nd
ENSG00000213977.7 TAX1BP3 2.43E−12 3.67 Yese
ENSG00000147586.9 MRPS28 4.97E−11 2.39 Yes
ENSG00000257727.5 CNPY2 1.34E−08 2.21 Yes
ENSG00000148180.18 GSN 2.1E−08 3.82 Yes
ENSG00000174903.15 RAB1B 4.09E−08 −1.59 Yes
ENSG00000203791.14 METTL10 4.15E−08 1.93 Yes
ENSG00000170296.9 GABARAP 8.02E−08 4.17 Yes
ENSG00000143368.9 SF3B4 7.59E−07 −1.56 Yes
ENSG00000136371.10 MTHFS 2.29E−06 2.42 Yes
ENSG00000171295.12 ZNF440 2.73E−06 1.53 Noe
ENSG00000088038.17 CNOT3 4.31E−06 −2.16 Yes
ENSG00000132471.11 WBP2 6.74E−06 −1.62 Yes
ENSG00000277203.1 F8A1 8.99E−06 −1.75 Yes
ENSG00000183889.12 AC138969.4 1.44E−05 −1.84 Yes
ENSG00000198171.12 DDRGK1 1.87E−05 −1.54 Yes
ENSG00000128739.21 SNRPN 2.59E−05 2.29 Yes
ENSG00000104969.9 SGTA 2.76E−05 −1.51 Yes
ENSG00000263290.5 SCAMP3 3.07E−05 −1.58 Yes
ENSG00000164039.14 BDH2 3.16E−05 1.71 Yes
ENSG00000147955.16 SIGMAR1 3.26E−05 −1.56 Yes
ENSG00000175274.18 TP53I11 5.42E−05 −1.74 Yes
ENSG00000270011.6 ZNF559-ZNF177 5.71E−05 2.80 Yes
ENSG00000205544.3 TMEM256 6.32E−05 3.71 Yes
ENSG00000111775.2 COX6A1 6.36E−05 2.28 Yes
ENSG00000100350.14 FOXRED2 6.66E−05 −1.87 Yes
ENSG00000279576.1 AP000769.1 8.82E−05 16.16 Yes
ENSG00000181264.8 TMEM136 9.61E−05 1.54 Yes
ENSG00000115239.21 ASB3 9.75E−05 1.69 Yes
ENSG00000100348.9 TXN2 0.000123 −1.57 Yes
ENSG00000167182.13 SP2 0.000132 −1.82 Yes
ENSG00000277462.1 ZNF670 0.000133 2.05 Yes
ENSG00000167644.11 C19orf33 0.000162 19.70 Yes
ENSG00000134590.13 FAM127A 0.000174 −1.62 Yes
ENSG00000239697.10 TNFSF12 0.000177 −1.83 Yes
ENSG00000164898.12 C7orf55 0.000191 3.25 Yes
ENSG00000124614.13 RPS10 0.000237 13.41 Yes
ENSG00000188257.10 PLA2G2A 0.000277 −14.64 Yes
ENSG00000196757.7 ZNF700 0.000284 1.59 Yes
ENSG00000116649.9 SRM 0.000299 −1.83 Yes
ENSG00000189171.14 S100A13 0.000328 1.93 Yes
Table 1. Top 40 differentially expressed coding genes between NAT and Na. a NAT, normal appearing tumor
adjacent tissue; N, normal thyroid control. b The human genome GRC38 was used for gene mapping and
annotation. c Benjamini and Hochberg multiple testing corrected p-value. Model was adjusted for age, gender
and LT status. d NAT/LT−, normal appearing thyroid tissue without co-existance of lymphocytic thyroiditis.
e
Yes, the gene is overlapping with the DEGs of NAT/LT− vs N; No, no overlapping.
Cho et al. reported aging-related transcriptomic changes in healthy thyroid tissue using the autopsy-derived
GTEx dataset33. They performed weighted correlation network analysis using all 322 GTEx samples, including
22 LT-positive samples and identified 552 LT-related genes. Of these genes, 456 are included in our annotated
22,411 gene list. Of these 456 genes, 440 (96.5%) are overlapping with the DEGs of NAT/LT+ vs NAT/LT− (Sup-
plemental Table S5).
DEGs between T and NAT. Using the same approach, we performed pair-wise DEG analysis between T
and NAT (n = 16 pairs) and obtained 6,713 DEGs (4,550, 67.8% coding and 2,163, 32.2% non-coding genes). The
top 40 DEGs are summarized in Supplemental Table S6. The overlap of the DEGs in NAT vs N, NAT/LT− vs N,
and T vs NAT is shown as a Venn diagram in Fig. 3. It is noteworthy that tumor samples yield more dysregu-
lated genes than NAT vs N while only a small number of shared DEGs is observed. We also analyzed the TCGA
Scientific Reports | (2021) 11:14126 | https://doi.org/10.1038/s41598-021-93526-9 4
Vol:.(1234567890)www.nature.com/scientificreports/
DEGs of NAT/LT−
Gene ID Gene name Gene biotype P value Fold change (NAT/N) vs N
ENSG00000242299.1 RP11-234A1.1 processed_pseudogene 3.671E−24 8.28 Yes
ENSG00000254911.3 SCARNA9 antisense 1.74E−18 7.48 Yes
ENSG00000233328.3 PFN1P1 processed_pseudogene 1.19E−15 −7.49 Yes
ENSG00000136149.6 RPL13AP25 processed_pseudogene 2.877E−14 7.24 Yes
transcribed_unpro-
ENSG00000272779.1 LL22NC03-80A10.6 1.681E−13 4.04 Yes
cessed_pseudogene
ENSG00000226525.5 RPS7P10 processed_pseudogene 4.401E−13 6.42 Yes
ENSG00000278771.1 Metazoa_SRP misc_RNA 4.444E−10 3.68 Yes
ENSG00000253954.3 HMGN1P38 processed_pseudogene 7.143E−10 −3.10 Yes
ENSG00000259918.1 NDUFA5P11 processed_pseudogene 4.037E−09 −3.79 Yes
ENSG00000243199.1 RP11-408P14.1 processed_pseudogene 4.037E−09 5.23 Yes
ENSG00000233913.7 CTC-575D19.1 processed_pseudogene 1.224E−08 6.18 Yes
ENSG00000251733.1 SCARNA8 scaRNA 1.336E−08 −6.45 Yes
ENSG00000178464.6 CTD-2192J16.15 processed_pseudogene 1.507E−08 4.98 Yes
ENSG00000256745.1 RP11-680H20.1 processed_pseudogene 2.153E−08 3.88 Yes
ENSG00000235776.2 AC000089.3 processed_pseudogene 2.215E−08 20.89 Yes
ENSG00000259706.1 HSP90B2P processed_pseudogene 2.254E−08 2.53 Yes
ENSG00000230629.2 RPS23P8 processed_pseudogene 3.119E−08 3.54 Yes
transcribed_processed_
ENSG00000224631.4 RP11-51O6.1 4.399E−08 7.42 Yes
pseudogene
ENSG00000231767.3 RP11-92K2.2 processed_pseudogene 5.442E−08 7.41 Yes
ENSG00000272101.2 AC243587.1 processed_pseudogene 1.158E−07 3.74 Yes
ENSG00000236534.1 H3F3BP1 processed_pseudogene 2.069E−07 4.02 Yes
ENSG00000236698.1 EIF1AXP1 processed_pseudogene 2.363E−07 2.61 Yes
ENSG00000274574.1 AC006359.1 snRNA 2.363E−07 −3.56 Yes
ENSG00000212607.1 SNORA3B snoRNA 2.957E−07 −4.84 Yes
ENSG00000282670.1 AC254944.3 lncRNA 4.208E−07 4.36 Yes
ENSG00000234797.5 RPS3AP6 processed_pseudogene 4.208E−07 5.31 Yes
ENSG00000239470.3 RP11-16F15.2 processed_pseudogene 4.208E−07 6.50 Yes
ENSG00000235174.1 RPL39P3 processed_pseudogene 4.568E−07 3.07 Yes
ENSG00000214389.2 RPS3AP26 processed_pseudogene 7.386E−07 4.28 Yes
ENSG00000174977.8 AC026271.5 processed_pseudogene 7.838E−07 2.76 Yes
ENSG00000243829.1 CTB-33G10.1 processed_pseudogene 1.064E−06 61.76 Yes
ENSG00000256393.1 RPL41P5 processed_pseudogene 1.876E−06 4.31 Yes
ENSG00000253683.1 CTB-79E8.3 processed_pseudogene 2.023E−06 3.24 Yes
ENSG00000178660.6 ARMC10P1 processed_pseudogene 2.181E−06 3.17 Yes
unprocessed_pseudo-
ENSG00000266992.1 DHX40P1 2.205E−06 3.79 Yes
gene
transcribed_processed_
ENSG00000274026.1 FAM27E3 2.293E−06 −3.17 Yes
pseudogene
ENSG00000265727.2 RN7SL648P misc_RNA 4.46E−06 1.97 Yes
ENSG00000198618.5 PPIAP22 processed_pseudogene 4.543E−06 4.31 Yes
ENSG00000220749.4 RPL21P28 processed_pseudogene 4.871E−06 3.83 Yes
ENSG00000283390.1 RP11-134F2.7 processed_pseudogene 4.871E−06 42.91 Yes
Table 2. Top 40 differentially expressed non-coding genes between NAT and N. The abbreviations, gene
annotation, and statistics are the same as described in Table 1.
RNA-seq data of 56 paired (T and NAT) thyroid tissue samples and compared with our data. The DEGs of T vs
NAT of the OSU cohort was highly correlated with those of the TCGA data (Supplemental Fig. S2, Supplemental
Table S4).
Dynamic gene expression changes. Dimensionality reduction analysis showed that the gene expres-
sion patterns of NAT samples present an intermediate expression state between N and T. We analyzed the gene
expression changes of the 646 DEGs of NAT vs N and their expression changes between T vs NAT. We grouped
the expression changes between sample types into six patterns: (1) upregulated from N to NAT to T (up-up,
n = 38); (2) up-regulated in NAT, but not changed in T (up-stable, n = 354); (3) up-regulated in NAT, but down-
regulated in T (up-down, n = 37); (4) downregulated from N to NAT to T (down-down, n = 31); (5) Downregu-
Scientific Reports | (2021) 11:14126 | https://doi.org/10.1038/s41598-021-93526-9 5
Vol.:(0123456789)www.nature.com/scientificreports/
Figure 2. Venn diagram of differentially expressed genes (DEGs) among samples. Venn diagram to illustrate
the overlapped DEGs between NAT vs N, NAT/LT− vs N, and NAT/LT+ vs NAT/LT−.
Figure 3. Venn diagram of differentially expressed genes (DEGs) among samples. Venn diagram to illustrate
the overlapped DEGs between NAT vs N, NAT/LT− vs N, and T vs NAT.
Scientific Reports | (2021) 11:14126 | https://doi.org/10.1038/s41598-021-93526-9 6
Vol:.(1234567890)www.nature.com/scientificreports/
Figure 4. Line plots showing gene expression patterns. Fold changes from N to NAT to T are plotted. (A)
Up-up, 38 genes. (B) Up-stable, 354 genes. (C) Up-down, 37 genes. (D) Down-down, 31 genes. (E) Down-stable,
148 genes. (F) Down-up, 38 genes. Up, p-value < 0.05 and log2(fold change) > = 0.584; Down, p-value < 0.05
and log2(fold change) < −0.584; Stable, not belonging to “Up” or “Down” groups; some stable genes may have
relatively high/low fold changes but the p-values are not significant.
lated in NAT but not changed in T (down-stable, n = 148). (6) Downregulated in NAT but upregulated in T
(down-up, n = 38) (Fig. 4, Supplemental Table S2). We performed the similar gene expression pattern analysis
with the DEGs of NAT/LT− vs N, and T vs NAT samples without co-existence of LT (T/LT- vs NAT/LT−) as
shown in Supplemental Table S4. Among the common DEGs of NAT vs N and NAT/LT− vs N, most of them
showed consistent expression patterns (Supplemental Table S7).
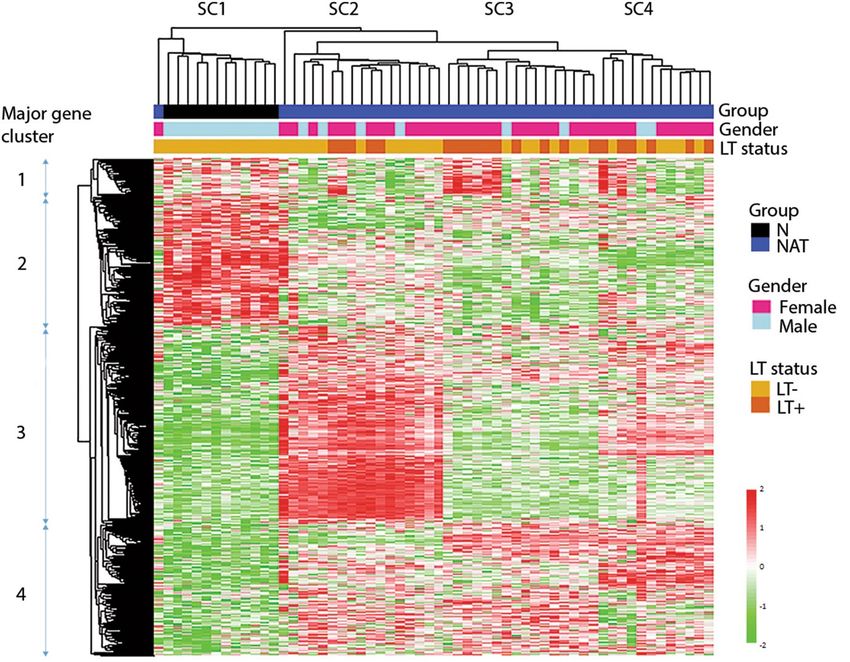
Clustering of DEGs between NAT and N. To identify groups of patients with similar gene expression
and pinpoint co-regulated genes under a subset of samples, we performed hierarchical cluster analysis with the
646 DEGs of NAT vs N, using Euclidean distance and average linkage method as depicted by dendrogram in
Fig. 5. Of 58 samples used in the clustering analysis, the 12 N samples and one NAT sample are clustered together
into a group labeled SC #1. The rest of the 43 NAT samples are sub-grouped into three major clusters (SCs
#2–4), with one outlier not belonging to any of the clusters. The co-existent LT samples (NAT/LT+ samples) are
randomly scattered among the SCs #2–4 clusters (Fig. 5). There are 4 major gene clusters. Gene clusters 1 and 2
are largely down-expressed in NAT with variations among samples. Genes in cluster #3 show relatively higher
Scientific Reports | (2021) 11:14126 | https://doi.org/10.1038/s41598-021-93526-9 7
Vol.:(0123456789)www.nature.com/scientificreports/
Figure 5. Dendrogram and clusters generated using 646 differentially expressed genes of NAT vs N. The heat
map was generated based on 58 samples (46 NAT and 12 N). The annotation bars (above heat map) show
sample clusters (SC1-SC4) and gender and the LT status of samples. The bar on the left side demonstrates the
range for scaled and centered log2 expression. Red means higher expression and green means lower expression.
Four major gene clusters are marked.
expression in NAT and are mainly enriched in one sample cluster of SC #2. Genes in cluster #4 show relatively
higher expression in NAT in three sample clusters of SCs #2–4.
Annotation of the functions of the DEGs between NAT and N. To explore the functions of the dys-
regulated genes in NAT, we analyzed related diseases and biological functions using Ingenuity Pathway Analysis
(IPA) software. The top five categories of “Disease and Biological Functions” include “cancer, organismal injury
and abnormalities, cellular response to therapeutics, cellular movement, and hematological system development
and function” (Supplemental Fig. S3). There are 261 genes associated with cancer (Supplemental Table S8). We
further examined these cancer genes and found that the great majority of them (256/261, 98.1%) are protein
coding genes. The five non-coding cancer genes include one antisense gene, one processed transcript, and three
pseudogenes. “Cancer” genes accounted for 88.0% (256 out of 273, 93.8%) of the total protein coding DEGs of
NAT vs N. Molecular and cellular functions included “cellular response to therapeutics, cellular movement, cell
death and survival, cell morphology, and cell to cell signaling and interaction (Supplemental Table S9). The top
3 molecular networks (Supplemental Fig. S4) are associated with developmental disorder, embryonic devel-
opment, vitamin and mineral metabolism (network 1), cell signaling, post-translational modification, protein
synthesis (network 2), and connective tissue development and function, protein synthesis, tissue morphology
(network 3).
Discussion
In the present study we performed transcriptome analyses with three groups of thyroid tissue samples and
characterized their expression profiles. We focused on the dysregulated genes in NAT. Our data suggest that
NAT harbors unique molecular changes in gene expression. The majority of dysregulated genes in NAT did not
overlap with those in tumors, implying different molecular pathways in these two tissues. We did not observe a
significant impact of sex difference in gene expression profile in NAT.
We hypothesized that the unique expression of specific genes in NAT either could indicate early molecular
events required for PTC tumorigenesis and/or represent local responses to the primary tumor. Consistent with
these hypotheses, the biological functions of the DEGs between NAT and N revealed that about one third of the
NAT genes are related to cancer involving cellular functions and maintenance, cell-to-cell signaling and inter-
action, cell movement, and cellular development. Some of these genes are reported to play a role in cancer. For
example, gelsolin (GSN) has been found to be dysregulated in various cancers34–36. GSN regulates the formation
of the actin cytoskeleton37, is frequently overexpressed in cancer, and it promotes cell motility38–40. GSN also is
associated with epithelial-mesenchymal transition41,42. In our study, GSN was overexpressed in NAT and slightly
but significantly overexpressed in PTC tumor. Interestingly, in the T RPV/PV mouse model of thyroid cancer,
Scientific Reports | (2021) 11:14126 | https://doi.org/10.1038/s41598-021-93526-9 8
Vol:.(1234567890)www.nature.com/scientificreports/
gelsolin is functionally important in Akt-dependent cancer progression, suggesting a functional role for this
particular gene in thyroid cancer biology35,36.
We observed dysregulated expression of a set of small RNA molecules (scaRNA, snoRNA and snRNA) in NAT
versus normal thyroid controls. Interestingly, there were few identified in PTC, consistent with analysis of TCGA
43
. Emerging evidence has revealed the potential significance of snoRNAs and snRNAs in o ncogenesis44,45. For
example, SNORD78 (C/D box) is overexpressed in non-small cell lung and prostate cancer46. SNORD50A/B (C/D
box), which directly binds and inhibits K-Ras, is deleted across multiple cancer t ypes47. Small nuclear RNAs have
been incompletely studied in thyroid cancer48. Our results suggest that additional functional studies are needed.
PTC is reportedly more common among patients who suffered from LT in some, but not all, s tudies7,49. We
found a group of genes preferentially dysregulated in NAT from patients with PTC co-existing with LT. These
genes are largely overlapping with LT-related genes in thyroid tissue samples from individuals without thyroid
cancer, likely reflective of the underlying LT rather than thyroid cancer33. Overall, our data suggest that the dif-
ferential gene expression in NAT was not driven by LT. The dysregulated genes in NAT largely related to cancer
rather than LT. Among the DEGs of NAT vs N, there was a small set of genes showing either continuous upregula-
tion (up-up pattern) from N to NAT to T, or continuous downregulation (down-down pattern) from N to NAT
to T, suggesting they might be candidate genes involved in early molecular events in thyroid tumorigenesis.
Further validation work is warranted, along with functional studies.
In summary, we address a key gap in the understanding of the molecular underpinning of PTC by com-
prehensively characterizing differentially expressed genes in normal-appearing tumor-adjacent thyroid tissue
from PTC patients using fresh frozen tissue samples,. These results provide a basis for further functional studies
defining the earliest tissue requirement that enable PTC development and/or unique events that occur in the
histologically normal tissue adjacent to the primary tumor. Additional research is required to determine the
roles of the identified genes and processes in PTC tumorigenesis and progression to determine their potential
roles as biomarkers and/or treatment targets.
Materials and methods
Patients and sample collection. The study protocol was reviewed and approved by the Institutional Review Board
of The Ohio State University (IRB number: 2006C0047) and was performed in accordance with ethical principles
for medical research involving human s ubjects50. Informed consent was obtained from all participants and/or
their legal guardians about this study. Normal appearing tumor-adjacent thyroid tissue samples (NAT, n = 46)
and paired PTC tumor samples (T, n = 16) were obtained from 46 PTC patients undergoing thyroid surgery. The
NAT samples were procured from tissues outside of tumors. Twenty-one samples had co-existent lymphocytic
thyroiditis (LT) (PTC/LT+) while 25 did not have LT (PTC/LT−). Of the 16 patients with paired tumor samples
8 were LT+. Normal thyroid tissue samples (N, n = 12) were obtained from laryngeal cancer patients without
thyroid lesions who had thyroidectomy as part of their cancer surgery. There were no thyroid diseases revealed
in the pathology reports of these normal thyroid samples. The tissue samples were snap-frozen in liquid nitrogen
and stored at −80 ◦ C. Clinical information is in Supplemental Table S1.
RNA isolation and quality assessment. Total RNA was isolated using TRIzol reagent (Invitrogen)
according to the manufacturer’s instructions. The purity of extracted RNA was measured using a NanoDrop
ND-1000 spectrophotometer (NanoDrop Technologies LLC). The concentration was assessed by Qubit 2.0 Fluo-
rometer (Agilent Technologies) using an RNA HS Assay Kit. Samples with RNA integrity number greater than 4
as assessed by a BioAnalyzer (Agilent Technologies) with no visible sign of genomic DNA contamination from
the HS Nanochip tracings were used for total RNA library generation.
Preparation of RNA‑seq libraries and RNA sequencing. RNA-seq libraries were prepared using the
Illumina TruSeq Stranded Total RNA Sample Prep Kit with Ribo-Zero Gold (catalog #RS-122-2201) according
to the manufacturer’s protocol. The sequencing was performed in paired end manner, generating 2X 100 bp
paired-end reads using the Illumina HiSeq 2500 system. Pre-alignment data QC were assessed with FastQC.
Post-alignment data quality was assessed with an in-house quality control pipeline/database for RNA-seq data51.
RNA-seq data were trimmed for any adapter sequences using AdapterRemoval52.
Gene expression estimate. RNA-Seq reads were mapped to the human genome (GRCh38p7) using
HISAT2 and quantified using the featureCounts in the Subread package for 63,299 Ensemble transcriptome/
genes53,54. Deconvolution analysis was performed to estimate “normal:tumor” cell fraction for each s ample55. To
eliminate bias due to very low expression, genes were filtered-out if each group had zero read counts for more
than 25% of the samples or had average read counts below 10. The relative transcript abundance was measured
in normalized counts obtained by the median of the ratios normalization method of D ESeq256.
Dimensional reduction analysis. Dimensional reduction analysis and visualization was performed using
principal component (PCA) analysis and t-Distributed Stochastic Neighbor embedding (t-SNE) with the Rtsne
(version 0.15) library in R package57. PCA is an unsupervised linear dimensionality reduction method while
t-SNE is an unsupervised non-linear method that preserves the local structure of the data. PCA plots and t-SNE
plots were created with log transformed normalized gene expressions using all remaining genes after filtering.
Differential expression and computational functional analysis. Differential expression analyses
were performed with DESeq2, adjusting for age, gender, and LT. Non-paired comparison of NAT vs N and
Scientific Reports | (2021) 11:14126 | https://doi.org/10.1038/s41598-021-93526-9 9
Vol.:(0123456789)www.nature.com/scientificreports/
paired comparison of T vs NAT were performed. The Benjamini & Hochberg (BH) method was used to correct
p-values for multiple testing. Furthermore, 1000× permutation analysis of samples creates the distribution of the
DESeq2 statistic. To exclude artifactual results due to gender bias, genes that showed a significant sex-difference
(p-value < 0.05) between males and females among NAT samples were filtered out. Cluster analyses and heat
maps were generated to visualize differentially expressed genes. Network, functional and canonical pathway
analyses of differentially expressed genes between NAT and N were performed using Ingenuity Pathway Analysis
(IPA) software (Ingenuity Systems Inc, www.ingenuity.com).
The Cancer Genome Atlas (TCGA) RNA‑seq data set. The TCGA HTSeq counts were downloaded
from the GDC Data portal (https://portal.gdc.cancer.gov/, accessed on March 2020). The DeSeq2 analysis was
performed with 58 pairs of T/NAT.
Data availability
All publicly available datasets used in this study were referenced in the Methods section. Our RNA-seq data have
been deposited in NCBI’s Gene Expression Omnibus (GEO) with GEO Series accession number GSE165724.
Received: 29 April 2021; Accepted: 22 June 2021
References
1. Siegel, R. L., Miller, K. D., Fuchs, H. E. & Jemal, A. Cancer Statistics 2021. CA A Cancer J. Clin. 71, 7–33. https://doi.org/10.3322/
caac.21654 (2021).
2. Rahbari, R., Zhang, L. & Kebebew, E. Thyroid cancer gender disparity. Future Oncol. (Lond., England) 6, 1771–1779. https://doi.
org/10.2217/fon.10.127 (2010).
3. Aschebrook-Kilfoy, B., Ward, M. H., Sabra, M. M. & Devesa, S. S. Thyroid cancer incidence patterns in the United States by his-
tologic type, 1992–2006. Thyroid 21, 125–134. https://doi.org/10.1089/thy.2010.0021 (2011).
4. Kondo, T., Ezzat, S. & Asa, S. L. Pathogenetic mechanisms in thyroid follicular-cell neoplasia. Nat. Rev. Cancer 6, 292–306. https://
doi.org/10.1038/nrc1836 (2006).
5. Iglesias, M. L. et al. Radiation exposure and thyroid cancer: A review. Arch Endocrinol Metabolism 61, 180–187. https://doi.org/
10.1590/2359-3997000000257 (2017).
6. Babli, S., Payne, R. J., Mitmaker, E. & Rivera, J. Effects of chronic lymphocytic thyroiditis on the clinicopathological features of
papillary thyroid cancer. Eur. Thyroid J. 7, 95–101. https://doi.org/10.1159/000486367 (2018).
7. Graceffa, G. et al. Association between Hashimoto’s thyroiditis and papillary thyroid carcinoma: a retrospective analysis of 305
patients. BMC Endocr. Disord. 19, 26. https://doi.org/10.1186/s12902-019-0351-x (2019).
8. Ferrari, S. M. et al. Thyroid autoimmune disorders and cancer. Semin Cancer Biol 64, 135–146. https://doi.org/10.1016/j.semca
ncer.2019.05.019 (2020).
9. Xu, L. et al. Obesity and the risk of papillary thyroid cancer: a pooled analysis of three case-control studies. Thyroid 24, 966–974.
https://doi.org/10.1089/thy.2013.0566 (2014).
10. Kitahara, C. M., Pfeiffer, R. M., Sosa, J. A. & Shiels, M. S. Impact of Overweight and Obesity on US Papillary Thyroid Cancer
Incidence Trends (1995–2015). JNCI: J. Natl. Cancer Inst. 112, 810–817. https://doi.org/10.1093/jnci/djz202 (2019).
11. de la Chapelle, A. & Jazdzewski, K. MicroRNAs in thyroid cancer. J. Clin. Endocrinol. Metab. 96, 3326–3336. https://doi.org/10.
1210/jc.2011-1004 (2011).
12. Zaballos, M. A. & Santisteban, P. Key signaling pathways in thyroid cancer. J. Endocrinol. 235, R43-61. https://doi.org/10.1530/
joe-17-0266 (2017).
13. Nikiforov, Y. E. & Nikiforova, M. N. Molecular genetics and diagnosis of thyroid cancer. Nat. Rev. Endocrinol. 7, 569–580. https://
doi.org/10.1038/nrendo.2011.142 (2011).
14. Podolski, A., Castellucci, E. & Halmos, B. Precision medicine: BRAF mutations in thyroid cancer. Precis. Cancer Med. 2, 29 (2019).
15. Nikiforov, Y. E. Thyroid carcinoma: molecular pathways and therapeutic targets. Mod. Pathol. 21(Suppl 2), S37-43. https://doi.org/
10.1038/modpathol.2008.10 (2008).
16. Knauf, J. A. & Fagin, J. A. Role of MAPK pathway oncoproteins in thyroid cancer pathogenesis and as drug targets. Curr. Opin.
Cell Biol. 21, 296–303. https://doi.org/10.1016/j.ceb.2009.01.013 (2009).
17. Cha, Y. & Koo, J. Next-generation sequencing in thyroid cancer. J. Transl. Med. 14, 322. https://d oi.o
rg/1 0.1 186/s 12967-0 16-1 074-7
(2016).
18. Rossing, M. Classification of follicular cell-derived thyroid cancer by global RNA profiling. J. Mol. Endocrinol. 50, R39-51. https://
doi.org/10.1530/jme-12-0170 (2013).
19. Liyanarachchi, S. et al. Genome-wide expression screening discloses long noncoding RNAs involved in thyroid carcinogenesis. J.
Clin. Endocrinol. Metab. 101, 4005–4013. https://doi.org/10.1210/jc.2016-1991 (2016).
20. Ria, R. et al. Gene expression profiling of normal thyroid tissue from patients with thyroid carcinoma. Oncotarget 7, 29677–29688.
https://doi.org/10.18632/oncotarget.8820 (2016).
21. He, H. et al. The role of microRNA genes in papillary thyroid carcinoma. Proc. Natl. Acad. Sci. USA 102, 19075–19080 (2005).
22. Rusinek, D., Szpak-Ulczok, S. & Jarzab, B. Gene expression profile of human thyroid cancer in relation to its mutational status. J.
Mol. Endocrinol. 47, R91-103. https://doi.org/10.1530/jme-11-0023 (2011).
23. Russo, F. et al. Interplay between long noncoding RNAs and Micro RNAs in Cancer. Methods Mol. Biol. 75–92, 2018. https://doi.
org/10.1007/978-1-4939-8618-7_4 (1819).
24. Cao, J. et al. Non-coding RNA in thyroid cancer - Functions and mechanisms. Cancer Lett. 496, 117–126. https://d oi.o
rg/1 0.1 016/j.
canlet.2020.08.021 (2021).
25. Aran, D. et al. Comprehensive analysis of normal adjacent to tumor transcriptomes. Nat. Commun. 8, 1077. https://doi.org/10.
1038/s41467-017-01027-z (2017).
26. Zhu, Y., Wang, L., Yin, Y. & Yang, E. Systematic analysis of gene expression patterns associated with postmortem interval in human
tissues. Sci. Rep. 7, 5435. https://doi.org/10.1038/s41598-017-05882-0 (2017).
27. Connallon, T. & Knowles, L. L. Intergenomic conflict revealed by patterns of sex-biased gene expression. Trends Genet 21, 495–499.
https://doi.org/10.1016/j.tig.2005.07.006 (2005).
28. Ellegren, H. & Parsch, J. The evolution of sex-biased genes and sex-biased gene expression. Nat Rev Genet 8, 689–698. https://doi.
org/10.1038/nrg2167 (2007).
29. Tukiainen, T. et al. Landscape of X chromosome inactivation across human tissues. Nature 550, 244–248. https://doi.org/10.1038/
nature24265 (2017).
Scientific Reports | (2021) 11:14126 | https://doi.org/10.1038/s41598-021-93526-9 10
Vol:.(1234567890)www.nature.com/scientificreports/
30. Yuan, Y. et al. Comprehensive characterization of molecular differences in cancer between male and female patients. Cancer Cell
29, 711–722. https://doi.org/10.1016/j.ccell.2016.04.001 (2016).
31. Arnold, A. P. & Disteche, C. M. Sexual Inequality in the Cancer Cell. Can. Res. 78, 5504–5505. https://doi.org/10.1 158/0008-5472.
CAN-18-2219 (2018).
32. Haugen, B. R. et al. 2015 American Thyroid Association Management Guidelines for Adult Patients with Thyroid Nodules and
Differentiated Thyroid Cancer: The American Thyroid Association Guidelines Task Force on Thyroid Nodules and Differentiated
Thyroid Cancer. Thyroid 26, 1–133. https://doi.org/10.1089/thy.2015.0020 (2016).
33. Cho, B. A. et al. Transcriptome network analysis reveals aging-related mitochondrial and proteasomal dysfunction and immune
activation in human thyroid. Thyroid 28, 656–666. https://doi.org/10.1089/thy.2017.0359 (2018).
34. Feldt, J. et al. Structure, regulation and related diseases of the actin-binding protein gelsolin. Expert Rev. Mol. Med. 20, e7. https://
doi.org/10.1017/erm.2018.7 (2019).
35. Kim, C. S. et al. Gelsolin: a novel thyroid hormone receptor-beta interacting protein that modulates tumor progression in a mouse
model of follicular thyroid cancer. Endocrinology 148, 1306–1312. https://doi.org/10.1210/en.2006-0923 (2007).
36. Saji, M. et al. Akt1 deficiency delays tumor progression, vascular invasion, and distant metastasis in a murine model of thyroid
cancer. Oncogene 30, 4307–4315. https://doi.org/10.1038/onc.2011.136 (2011).
37. Yin, H. L. & Stossel, T. P. Control of cytoplasmic actin gel-sol transformation by gelsolin, a calcium-dependent regulatory protein.
Nature 281, 583–586. https://doi.org/10.1038/281583a0 (1979).
38. Abedini, M. R. et al. Cell fate regulation by gelsolin in human gynecologic cancers. Proc. Natl. Acad. Sci. 111, 14442. https://doi.
org/10.1073/pnas.1401166111 (2014).
39. Thompson, C. et al. Pancreatic cancer cells overexpress gelsolin family-capping proteins, which contribute to their cell motility.
Gut 56, 95–106. https://doi.org/10.1136/gut.2005.083691 (2007).
40. Deng, R. et al. Gelsolin regulates proliferation, apoptosis, migration and invasion in human oral carcinoma cells. Oncol. Lett. 9,
2129–2134. https://doi.org/10.3892/ol.2015.3002 (2015).
41. Zhang, Y. et al. Gelsolin promotes cancer progression by regulating epithelial-mesenchymal transition in hepatocellular carcinoma
and correlates with a poor prognosis. J. Oncol. 2020, 1980368. https://doi.org/10.1155/2020/1980368 (2020).
42. Chen, Z.-Y., Wang, P.-W., Shieh, D.-B., Chiu, K.-Y. & Liou, Y.-M. Involvement of gelsolin in TGF-beta 1 induced epithelial to
mesenchymal transition in breast cancer cells. J. Biomed. Sci. 22, 90. https://doi.org/10.1186/s12929-015-0197-0 (2015).
43. Gong, J. et al. A Pan-cancer analysis of the expression and clinical relevance of small nucleolar RNAs in human cancer. Cell Rep.
21, 1968–1981. https://doi.org/10.1016/j.celrep.2017.10.070 (2017).
44. Williams, G. T. & Farzaneh, F. Are snoRNAs and snoRNA host genes new players in cancer?. Nat. Rev. Cancer 12, 84–88. https://
doi.org/10.1038/nrc3195 (2012).
45. Krishnan, P. et al. Profiling of small nucleolar RNAs by next generation sequencing: potential new players for breast cancer prog-
nosis. PLoS ONE 11, e0162622–e0162622. https://doi.org/10.1371/journal.pone.0162622 (2016).
46. Martens-Uzunova, E. S. et al. C/D-box snoRNA-derived RNA production is associated with malignant transformation and meta-
static progression in prostate cancer. Oncotarget 6, 17430–17444. https://doi.org/10.18632/oncotarget.4172 (2015).
47. Siprashvili, Z. et al. The noncoding RNAs SNORD50A and SNORD50B bind K-Ras and are recurrently deleted in human cancer.
Nat. Genet. 48, 53–58. https://doi.org/10.1038/ng.3452 (2016).
48. Tabatabaeian, H., Peiling Yang, S. & Tay, Y. Non-coding RNAs: Uncharted mediators of thyroid cancer pathogenesis. Cancers 12,
3264. https://doi.org/10.3390/cancers12113264 (2020).
49. Babli, S., Payne, R. J., Mitmaker, E. & Rivera, J. Effects of chronic lymphocytic thyroiditis on the clinicopathological features of
papillary thyroid cancer. Eur Thyroid J 7, 95–101. https://doi.org/10.1159/000486367 (2018).
50. World Medical Association Declaration of Helsinki. ethical principles for medical research involving human subjects. JAMA 310,
2191–2194. https://doi.org/10.1001/jama.2013.281053 (2013).
51. Kroll, K. W. et al. Quality control for RNA-Seq (QuaCRS): An integrated quality control pipeline. Cancer Inf. 13, 7–14. https://doi.
org/10.4137/cin.s14022 (2014).
52. Stocks, M. B. et al. The UEA sRNA workbench: a suite of tools for analysing and visualizing next generation sequencing microRNA
and small RNA datasets. Bioinformatics 28, 2059–2061. https://doi.org/10.1093/bioinformatics/bts311 (2012).
53. Kim, D., Paggi, J. M., Park, C., Bennett, C. & Salzberg, S. L. Graph-based genome alignment and genotyping with HISAT2 and
HISAT-genotype. Nat. Biotechnol. 37, 907–915. https://doi.org/10.1038/s41587-019-0201-4 (2019).
54. Liao, Y., Smyth, G. K. & Shi, W. featureCounts: an efficient general purpose program for assigning sequence reads to genomic
features. Bioinformatics 30, 923–930. https://doi.org/10.1093/bioinformatics/btt656 (2014).
55. Gong, T. et al. Optimal deconvolution of transcriptional profiling data using quadratic programming with application to complex
clinical blood samples. PLoS ONE 6, e27156. https://doi.org/10.1371/journal.pone.0027156 (2011).
56. Love, M. I., Huber, W. & Anders, S. Moderated estimation of fold change and dispersion for RNA-seq data with DESeq2. Genome
Biol. 15, 550. https://doi.org/10.1186/s13059-014-0550-8 (2014).
57. van der Maaten, L. & Hinton, G. Visualizing data using t-SNE. J. Mach. Learn. Res. 9, 2579–2605 (2008).
Acknowledgements
This article is dedicated to celebrating the life and accomplishments of Dr. Albert de la Chapelle (1933–2020).
We thank Ms Leslie Davidson for administrative work, and the OSU Comprehensive Cancer Center (OSUCCC)
Genomics Shared Resource for RNA-seq and real time PCR. Tissue samples were provided by the Cooperative
Human Tissue Network which is funded by the National Cancer Institute. Data analyses were processed using
HPC clusters in the Ohio Supercomputer Center.
Author contributions
H.H. and A.dlC. conceived and designed the study. H.H. wrote the main manuscript text with input from S.L.,
D.F.C.Jr., P.Y., R.B., P.B., M.D.R., and A.dlC. S.L. performed data analysis and prepared all the figures. S.L. and
H.H. prepared all the tables. W.L. and D.F.C. Jr. contributed to the experiments. P.Y., R.B., and A.M.T. contributed
to data collection and analysis. P.B. contributed to patient recruitment and clinical information. M.D.R. and
A.dlC. supervised the research. All authors were involved with discussion regarding the experimental design
and approved the final manuscript.
Funding
This work was supported by National Cancer Institute Grants P50CA168505 to MDR and R50 CA211524 to PY,
and The Ohio State University CCSG P30CA16058.
Scientific Reports | (2021) 11:14126 | https://doi.org/10.1038/s41598-021-93526-9 11
Vol.:(0123456789)www.nature.com/scientificreports/
Competing interests
The authors declare no competing interests.
Additional information
Supplementary Information The online version contains supplementary material available at https://doi.org/
10.1038/s41598-021-93526-9.
Correspondence and requests for materials should be addressed to M.D.R.
Reprints and permissions information is available at www.nature.com/reprints.
Publisher’s note Springer Nature remains neutral with regard to jurisdictional claims in published maps and
institutional affiliations.
Open Access This article is licensed under a Creative Commons Attribution 4.0 International
License, which permits use, sharing, adaptation, distribution and reproduction in any medium or
format, as long as you give appropriate credit to the original author(s) and the source, provide a link to the
Creative Commons licence, and indicate if changes were made. The images or other third party material in this
article are included in the article’s Creative Commons licence, unless indicated otherwise in a credit line to the
material. If material is not included in the article’s Creative Commons licence and your intended use is not
permitted by statutory regulation or exceeds the permitted use, you will need to obtain permission directly from
the copyright holder. To view a copy of this licence, visit http://creativecommons.org/licenses/by/4.0/.
© The Author(s) 2021
Scientific Reports | (2021) 11:14126 | https://doi.org/10.1038/s41598-021-93526-9 12
Vol:.(1234567890)You can also read