A newborn screening pilot study using methylation sensitive high resolution melting on dried blood spots to detect prader Willi and Angelman ...
←
→
Page content transcription
If your browser does not render page correctly, please read the page content below
www.nature.com/scientificreports
OPEN A newborn screening pilot study
using methylation‑sensitive
high resolution melting on dried
blood spots to detect Prader‑Willi
and Angelman syndromes
Igor Ribeiro Ferreira1,5, Régis Afonso Costa1,5, Leonardo Henrique Ferreira Gomes1,5,
Wilton Darleans dos Santos Cunha1, Latife Salomão Tyszler2, Silvia Freitas2,
Juan Clinton Llerena Junior3, Zilton Farias Meira de Vasconcelos1, Robert D. Nicholls4 &
Letícia da Cunha Guida1*
Prader-Willi (PWS) and Angelman (AS) syndromes are two clinically distinct imprinted disorders
characterized by genetic abnormalities at 15q11-q13. Early diagnosis of both syndromes provides
improved treatment and accurate genetic counseling. Whole blood (WB) is the most common DNA
source of many methodologies to detect PWS and AS, however, the need of WB makes a massive
screening difficult in newborns due to economic and technical limitations. The aim of this study was
to adapt a Methylation-sensitive High-Resolution Melting (MS-HRM) approach from dried blood spot
(DBS) samples, assessing the different DNA isolation techniques and diagnostic performance. Over a
1-year period, we collected 125 DBS cards, of which 45 had already been diagnosed by MS-HRM (20
PWS, 1 AS, and 24 healthy individuals). We tested three different DBS-DNA extraction techniques
assessing the DNA concentration and quality, followed by MS-HRM and statistical comparison.
Each DBS-DNA extraction method was capable of accuracy in detecting all PWS and AS individuals.
However, the efficiency to detect healthy individuals varied according to methodology. In our
experience, DNA extracted from DBS analyzed by the MS-HRM methodology provides an accurate
approach for genetic screening of imprinting related disorders in newborns, offering several benefits
compared to traditional whole blood methods.
Prader-Willi (PWS) and Angelman (AS) syndromes are complex disorders arising from genetic abnormalities
in chromosome 15. Both syndromes are considered rare due to the estimated prevalence of 1 in 10,000–30,000
individuals1,2. While they occur in the same genomic region, multiple genetic alterations and very distinct
clinical characteristics are present. The main features associated with PWS are severe neonatal hypotonia, short
stature, small hands and feet, dysmorphic face, early onset of hyperphagia, development of morbid obesity,
hypogonadism, and cognitive i mpairment3. Congenital hypotonia represents a diagnostic challenge, especially
in newborns, because it is present in several disorders, as metabolic diseases, acute or chronic illness, genetic
syndromes, endocrinopathies, myopathies, and central or peripheral nervous system a bnormalities4. AS patients
present delayed psychomotor development, severe mental retardation, absence of speech, seizures, motor oddi-
ties, and epilepsy5.
1
Laboratório de Alta Complexidade, Instituto Nacional da Saúde da Mulher, da Criança E Do Adolescente
Fernandes Figueira, Fiocruz, Avenida Rui Barbosa 716, Flamengo, Rio de Janeiro, RJ 22250‑020, Brazil. 2Instituto
Estadual de Diabetes E Endocrinologia Luiz Capriglione (IEDE), Rio de Janeiro, Brazil. 3Departamento de Genética,
Instituto Nacional da Saúde da Mulher, da Criança E Do Adolescente Fernandes Figueira, Fiocruz, Rio de Janeiro,
Brazil. 4Division of Medical Genetics, Department of Pediatrics, UPMC Children’s Hospital of Pittsburgh, University
of Pittsburgh, Pittsburgh, PA, USA. 5These authors contributed equally: Igor Ribeiro Ferreira, Régis Afonso Costa
and Leonardo Henrique Ferreira Gomes. *email: leticia.guida@iff.fiocruz.br
Scientific Reports | (2020) 10:13026 | https://doi.org/10.1038/s41598-020-69750-0 1
Vol.:(0123456789)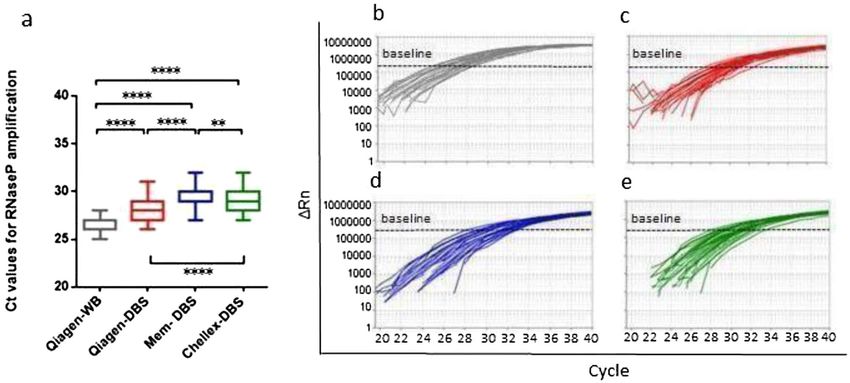
www.nature.com/scientificreports/
Figure. 1. Comparison of DNA quality between nucleic acid extraction methods. The DNA concentration (a),
and DNA purity were assessed using 260/280 and 260/230 parameters (b,c). NS P > 0.05; **P < 0.01; ***P < 0.001;
****P < 0.0001.
There are multiple genetic mechanisms that can lead to PWS or AS. The most frequent occurrence in both
syndromes is deletions at the chromosome 15q11-q13 region, affecting approximately 65–75% of individuals
with PWS or AS. Deletions on the paternal allele result in PWS, whereas on the maternal allele cause AS6,7.
Maternal Uniparental Disomy (mUPD) of chromosome 15 is found in about 25% of PWS p atients8,9, while
Paternal Uniparental Disomy (pUPD) occurs in only 3–7% of individuals with A S2,10. About 1–5% of cases of
both syndromes present hypermethylation (PWS) and hypomethylation (AS) due to an imprinting defect. In
10–15% of these cases the imprinting defect is due to an imprinting centre d eletion11,12. The remaining AS cases
(10–20%) involve coding mutations in the UBE3A gene13,14.
The diagnosis of PWS and AS depends on a combination of clinical features, molecular studies, and cytoge-
netic analysis. The most sensitive laboratory approach for the diagnosis of both syndromes is to analyze the DNA
methylation pattern of the promoter-exon 1 region of the SNURF-SNRPN bicistronic gene (15q11.2)15,16. Further
molecular analysis by Multiplex Ligation Probe-Dependent Amplification (MLPA) and Microsatellite Analysis,
along with molecular cytogenetic analysis by Fluorescence in Situ Hybridization (FISH) will reveal the PWS/AS
etiology17,18. DNA Methylation analysis by Methylation-specific PCR (MS-PCR) technique is based on bisulfite
conversion of DNA, followed by PCR amplification with two pairs of primers amplifying paternal and maternal
alleles along with agarose gel electrophoresis15. However, there is a high risk of false-positives obtained by cross
annealing of primers, and the occurrence of false-negatives due to competition for reagents as already r eported19.
Recently, our group described a methodology using Methylation-sensitive High-Resolution Melting (MS-
HRM) where a single pair of primers amplifies the promoter-exon 1 region of the SNURF-SNRPN locus revealing
its methylation status. The MS-HRM approach dispenses additional techniques such as agarose gel electropho-
resis to detect positive cases. However, the proposed approach does not provide specific information about the
disease etiology requiring subsequent techniques such as FISH, MLPA, and microsatellite analysis to detect the
underlying molecular or cytogenetic cause (deletion, uniparental disomy or imprinting defect)16.
Dried blood spot (DBS) is a form of collection and storage of blood on a filter paper, called Guthrie cards.
These samples contain on average 50 μL of blood per spot and are routinely collected in the first 48–120 h of
life as part of the newborn screening programs (NBS) in many c ountries20. The major goal of NBS is to identify
treatable inherited diseases, avoiding morbidity, and mortality associated with genetic disorders21. Furthermore,
DBS collection is simple to perform, requires minimal training, and does not offer biohazard risks to health care
workers. Guthrie cards can easily be transported from isolated regions to reference centers, avoiding geographical
barriers that would prevent nationwide disease screening. Ultimately, DBS can be easily stored providing the
opportunity to perform population studies for incidence and p revalence22,23.
This work aimed to assess the feasibility and accuracy of PWS/AS screening on DBS samples, using our pre-
viously reported MS-HRM method comparing three different DNA extraction methods and using peripheral
whole blood (WB) samples as reference.
Results
To accomplish the MS-HRM methodology as a potential newborn screening strategy for PWS and AS, this study
started by assessing the best DNA extraction for DBS samples. Genomic DNA was isolated from DBS with three
different methods (Qiagen-DBS, Mem-DBS, and Chellex-DBS). Initially, the DNA extraction with Mem-DBS
and Chellex-DBS kits provided a significantly higher DNA concentration (P < 0.0001) compared to the DNA
extraction from Qiagen-DBS (Fig. 1a). However, when DNA quality was assessed by the 260/280 wavelength
Scientific Reports | (2020) 10:13026 | https://doi.org/10.1038/s41598-020-69750-0 2
Vol:.(1234567890)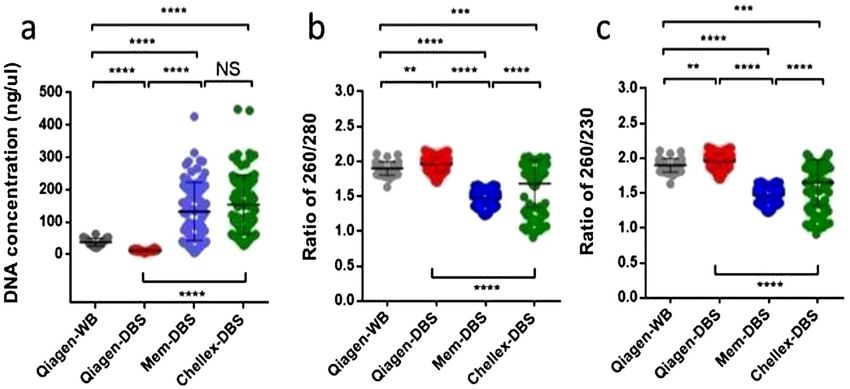
www.nature.com/scientificreports/
Figure 2. Variations of RPP38 amplification per DNA extraction method. (a) Comparative Ct amplification
analysis ****P < 0.0001, **P < 0.01. Representative RPP38 amplification plots: (b) Qiagen-WB; (c) Qiagen-DBS;
(d) Mem-DBS; (e) Chellex-DBS.
(for protein, phenol, or other contaminants), the Qiagen-DBS strategy showed a significantly higher DNA purity
compared to the DNA obtained from Mem-DBS and Chellex-DBS (P < 0.0001) (Fig. 1b). In addition, analyzing
the 230/260 absorbance (for EDTA, carbohydrates, and phenol contamination), the genomic DNA obtained by
the Qiagen-DBS methodology also reached significantly better quality values than Mem-DBS and Chellex-DBS
(Fig. 1c) (P < 0.0001).
To ensure the DNA quality of all clinical samples (WB or DBS) from each individual the human gene RPP38
was tested. The amplification curves for RPP38 for all DNA extraction protocols exclude the possibility of false
negatives.
The Qiagen-DBS amplification curves displayed a mean Ct of 28.18 with a range between 26 and 31, while
Mem-DBS and Chellex-DBS presented higher amplification mean Ct of 29.5327–32 and 29.0327–32, respectively
(Fig. 2a and Additional file 1: Table S1). The representative RPP38 amplification curves are presented in Fig. 2b–e.
The genomic DNA obtained from different clinical samples (WB or DBS) and distinct nucleic acid extraction
approaches were treated with bisulfite. Converted DNA was quantified and the recovery concentration ratio was
~ 10 ng/μL (about 50% of the initial DNA input) in all methods.
The MS-HRM methodology previously described by our group was used to amplify the bisulfite modified
DBS-DNA16. From 125 samples processed with the Qiagen-DBS methodology, 123 samples were amplified
(20 PWS, 1 AS, and 102 Healthy individuals) with a mean Ct of 28, consistent with the mean Ct from RPP38
amplification.
From the Mem-DBS method, only 103 samples were amplified (20 PWS, 1 AS, and 82 Healthy individuals)
with a Ct mean of 31. 115 samples from the Chellex-DBS extraction method were amplified (20 PWS, 1 AS,
and 94 Healthy individuals) with a mean Ct of 32. These results are consistent with the DNA purity extracted
by each different methodology.
None of the extraction methods changed significantly the melting temperature curve displayed after bisulfite-
treated DNA amplification. Among the 45 individuals analyzed by MS-HRM methodology from Qiagen-WB,
all 24 healthy individuals, 20 Prader-Willi, and one Angelman cases (Fig. 3a,e,i, respectively) were confirmed.
The MS-HRM analysis performed using the Qiagen-DBS extraction method detected 102 healthy individuals
(Fig. 3b). Altogether, the MS-HRM analysis on Mem-DBS and Chellex-DBS samples detected, respectively, 82
and 94 healthy patients (Fig. 3c,d). In addition, the dissociation curve analysis of the DNA obtained from DBS by
the three methodologies confirmed all 20 individuals with PWS by the absence of the paternal peak (Fig. 3f–h),
and one individual with AS without maternal methylated allele peak (Fig. 3j–l).
Discussion
The clinical diagnosis of PWS and AS in newborns is challenging since the distinctive phenotypic characteristics
of the diseases are not evident during this phase. Reliable and low-cost molecular analysis techniques are impera-
tive for accurate and early diagnosis to start precise treatment. Our group described an MS-HRM methodology
using a unique pair of primers to evaluate the DNA methylation pattern of the exon 1-promoter region of the
SNURF-SNRPN gene16. This approach makes it possible to distinguish paternal and maternal alleles according
to a clear difference in melting temperature. However, other DNA methylation-sensitive techniques (such as
MS-PCR and MS-MLPA) also use DNA extracted from the WB sample and require minimum logistics for col-
lecting, preserving, and transporting blood samples within a time frame to preserve its integrity until delivery
to a specialized diagnostic c enter26.
Scientific Reports | (2020) 10:13026 | https://doi.org/10.1038/s41598-020-69750-0 3
Vol.:(0123456789)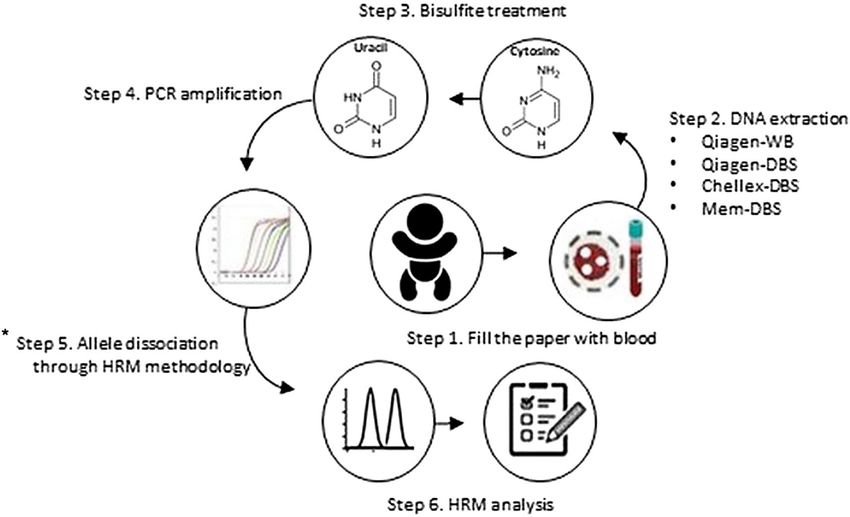
www.nature.com/scientificreports/
Figure 3. Dissociation curve analysis according to each DNA extraction method. (a–d) Normal methylation
pattern, unmethylated paternal (78 °C), and methylated maternal alleles (82 °C) present. (e–h) Absence of
paternal allele, only the maternal allele is present, confirming the PWS pattern. (i–l) Absence of the maternal
allele, only the paternal allele is present, confirming AS pattern. Dissociation curve analysis per DNA extraction
method.
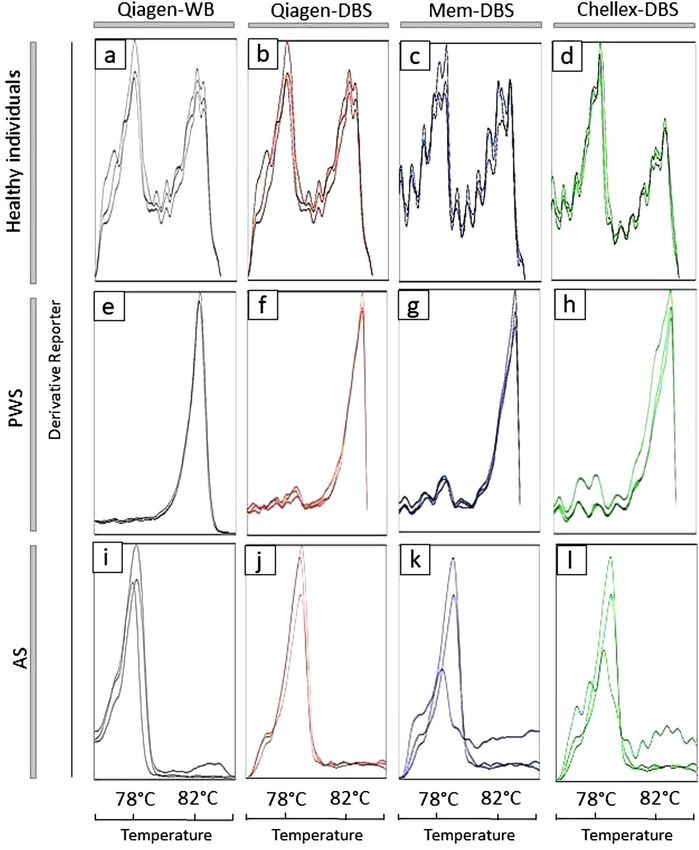
This study evaluated different methodologies for DNA extraction from DBS to screen PWS/AS using the
MS-HRM method (Fig. 4). Guthrie cards are easy to store and ship from isolated areas to diagnostic centers, and
lood21. Our study
they represent a reliable platform for the accurate and fast diagnosis with a small amount of b
tested three different DNA extraction methods: Qiagen-DBS, Mem-DBS, and Chellex-DBS in comparison with
DNA extracted from WB (Qiagen-WB). Initially, we observed a significantly higher DNA concentration with
Mem-DBS and Chellex-DBS methodologies compared to Qiagen-DBS. However, the Mem-DBS and Chellex-
DBS parameters for 260/280 and 260/230 indicated lower DNA purity, suggesting the presence of contaminants
such as phenol and proteins. The Qiagen-DBS method used to extract DNA from DBS showed a significantly
higher DNA quality and purity compared with Mem-DBS and Chellex-DBS. As previously reported, better
quality DNAs are more appropriate for molecular biology a ctivities27.
Scientific Reports | (2020) 10:13026 | https://doi.org/10.1038/s41598-020-69750-0 4
Vol:.(1234567890)www.nature.com/scientificreports/
Figure 4. Methodology of DNA methylation analysis for DBS. Step 1: Collect blood and fill the spots on filter
papers; Step 2: Extract the DNA from each Guthrie cards and from Whole Blood; Step 3: Bisulfite treatment,
converting unmethylated cytosine to uracil; Step 4: PCR amplification; Step 5: Allele discrimination through
HRM methodology: Step 6: Results analysis and diagnostic.*It does not distinguish between the different
molecular causes related to PWS and AS.
In order to detect PCR inhibitors for each DBS-DNA extraction method, the reference control gene RPP38
was used as an amplification internal control. Even though RPP38 was amplified by all DNA extraction meth-
ods, Mem-DBS and Chellex-DBS displayed higher Ct values when compared to Qiagen-DBS. The lower Cts
values observed after Qiagen-DBS DNA extraction likely relate to better DNA integrity and purity, as previously
reported28.
The MS-HRM results from 123 samples by Qiagen-DBS, 103 by Mem-DBS, and 115 by Chellex-DBS DNA
isolation methods indicate an amplification efficiency of 98,4%; 82,4%; 92%, respectively. These results from DBS
samples correlate with DNA purity. In addition, it has been shown that bisulfite treatment reduces considerably
the DNA quality, contributing to reduced qPCR efficiency in all DNA extraction m ethods29–31.
The MS-HRM analysis from genomic DNA extracted from DBS displayed no significant difference from
WB samples in terms of dissociation temperatures, suggesting that SNURF-SNRPN CpG methylation sites are
preserved on DBS samples. This data was compatible with all DNA extraction methods that detected correctly
all 20 PWS and 1 AS evaluated here. However, the HRM peaks related to the temperature of allelic dissociations
were better represented with Qiagen-DBS methodology, suggesting that amplification quality is directly associ-
ated with better allelic dissociation peaks.
Despite the concordance in detecting all PWS and AS individuals, the efficiency to detect healthy individuals
varied. The DNA extraction from DBS by Qiagen-DBS detected 102 Healthy individuals. On the other hand,
the genomic extraction from DBS by Mem-DBS and Chellex-DBS detected 82 and 94 Healthy individuals,
respectively. Our results indicate that once amplification of the bisulfite modified DNA occurs there is a clear
dissociation curve that prevents misinterpretation. Our study also demonstrated that preferentially no amplifi-
cation was seen on healthy individuals samples that represent only 1.6% of all samples tested. The amplification
rate of the DNA obtained by Qiagen-DBS (98.4%) is compatible with other qPCR screening methods studies,
where the efficiency varied from 48 to 100%32–38. The rate of amplification failure observed in Qiagen-DBS can
decrease according to a new DNA extraction or new sample request. Despite this comparative analysis between
the results obtained in this study and the results observed in the literature, it is difficult to compare the DNA
from DBS amplification efficiency across different studies due to many reasons: different protocols of genomic
extraction from DBS, diversity of commercial Guthrie Cards, storage conditions, and year-durations.
An earlier and accurate diagnostic provides not just the anticipation of drug administration but also other
benefits, significantly reducing hospitalization and comorbidities. This is clear for children displaying the worst
speech and language problems, commonly seen in patients with prolonged tube f eeding39. The availability of an
accurate and reliable technique to diagnose PWS and AS, especially for hypotonic neonates potentially could help
atients40. The MS-HRM analysis associated with DBS samples provides a platform
to identify and treat those p
for neonatal screening using molecular techniques, even in remote areas.
The possibility of massive and accurate screening diagnostic methodology of newborns for genetic dis-
eases also affects the routine application of public health services. Several syndromes require periodic clinical
Scientific Reports | (2020) 10:13026 | https://doi.org/10.1038/s41598-020-69750-0 5
Vol.:(0123456789)www.nature.com/scientificreports/
surveillance, and the distinction between severe and milder syndromes reduces costs with genetic disorders
misdiagnosed. Novel diagnostic tools to improve neonatal diagnostics will direct newborns to disease-specific
government programs with specialized multidisciplinary teams that ultimately leads to better prognosis and
quality of l ife41.
Recently, some molecular studies using DBS as a DNA source have been p erformed37,38. DBS provides only a
small amount of D NA42, however, it was demonstrated to be adequate for MLPA analysis and diagnosis of 22q11
deletion syndrome (22q11 DS) according to Copy Number Variations (CNV)43. The gold standard method for
the diagnosis of 22q11 DS is the FISH technique using whole blood. In the same way, FISH is also used for PWS
testing and can detect 15q11-q13 deletions. The possibility to use DNA extracted from DBS in different diagnostic
methodologies could facilitate the detection of each genetic mechanism related to PWS. DBS is commonly used
as a screening method for disorders in newborns, such as Gaucher, Pompe, Fabry, and Mucopolysaccharidosis-
I44–46. The use of DBS as a source of DNA enables the massive screening of severe diseases in newborns, where
early diagnosis allows effective treatments. For instance, the Severe Combined Immunodeficiency (SCID) is a
heterogeneous group of genetic diseases characterized by severe T cell lymphopenia with often lethal outcomes
due to late diagnosis47. T Cell Receptor Excision Circle (TREC) quantitative analysis from DBS by qPCR has
shown to be a powerful and economical methodology for detection of SCID in newborns, providing an early
and life-saving treatment48.
MS-HRM is a robust methodology for laboratory diagnostic and research use. Charoenkwan et al.49, estab-
lished a pattern of High-Resolution Melting curve to detect genetic variations related to beta‑thalassemia disease
with no need for traditional DNA sequencing. Due to the high sensitivity of the MS-HRM technique, single
nucleotide polymorphism (SNP) can be identified in a DNA fragment49. The gold standard method to analyze
mutations in DNA is Sanger sequencing, which is time-consuming with several steps and laborious50. The use
of HRM methods to detect sequence variations from DBS opens the possibility to develop specific assays to
newborns screening for disease-related mutations impacting neonatal development.
Conclusion
The MS-HRM analysis to screen PWS and AS associated with DNA extraction from DBS achieved 100% of
concordance compared to MS-HRM performed with traditional whole blood methodology. The use of the DBS
sample as the main source of DNA provides several advantages against the use of WB; demanding only a small
amount of blood, less invasive procedure with a considerable reduction of the risk of contamination, ease of
storage, and transportation. Furthermore, central laboratories can analyze DBS from remote areas, avoiding
geographic barriers, and allowing long term storage. This method showed accuracy and no misinterpretation was
observed in our experience. We recommend the MS-HRM molecular screening tests preferentially for hypotonic
neonates in order to anticipate diagnosis and improve prognosis. Given the widespread use of DBS as a neonatal
screening method, the MS-HRM analysis from this sample does not require new facilities or guidelines. Our
study demonstrates the potential of DBS as a DNA source for MS-HRM studies and its accuracy on abnormal
DNA methylation detection of imprinting related disorders.
Methods
Sample collection. The study was approved by the Fernandes Figueira Institute IRB (CAAE:
45767015.0.0000.5269). Guthrie cards were obtained from babies born at Fernandes Figueira Institute from
mothers enrolled randomly during our regular prenatal follow up. No selection criteria were used to our sam-
ple should reflect the general population. Our study period comprised 1 year and was able to access 125 stored
Guthrie cards filled with a drop of peripheral blood from neonates. Of these 125 stored DBS cards, we had 45
additional whole blood fresh samples which were also used as positive controls (20 PWS, 1 AS, and 24 healthy
control patients), and further used for comparative purposes analysis between DBS extraction methods.
DNA extraction protocols. Genomic DNA isolation from DBS cards was performed using single-hole
paper punches each 3.2 mm in diameter using three different protocols:
(1) Qiagen-DBS: DNA isolation was performed with the QIAamp DNA Mini kit (QIAGEN, Germantown, MD,
USA) following the manufacturer’s protocol. Briefly, the DNeasy column-based isolation method started
with three paper punches being incubated with proteinase K for 3 h with shaking at 56 °C. Then, two elu-
tions were performed, and each time 20 μL of LoTE buffer (low tris-ethylene diamine tetraacetic acid) was
used (Qiagen-DBS). The same DNA extraction method was performed with the peripheral whole blood
from Prader-Willi, Angelman, and healthy control patients (hereby called Qiagen-WB).
(2) Mem-DBS: The Mem heat extraction protocol was performed as described by Barbi et al. (1996) using three
paper punches from the Guthrie cards (Mem-DBS)24.
(3) Chellex-DBS: For our third DNA extraction, three paper punches from DBS were washed with 1X PBS/0.1%
Tween-20 for 10 min and transferred to a new 1.5-mL microcentrifuge tube, containing 60 μL of nuclease-
free water. After that, 10 μL of Chelex-lysis solution were added, following incubation for 30 min at 60 °C
and another for 30 min at 95 °C. The Chelex was pelleted at 20,000 g for 1 min, the supernatant was dis-
carded and the microcentrifuge tube was storage at − 20°C25.
DNA quantification. DNA concentration and purity (260/280 and 260/230 ratios) were assessed by Nan-
oDrop 2000 Spectrophotometer (Thermo Scientific, Waltham, MA, USA) from DBS or peripheral whole blood
samples processed by each of the three extraction protocols.
Scientific Reports | (2020) 10:13026 | https://doi.org/10.1038/s41598-020-69750-0 6
Vol:.(1234567890)www.nature.com/scientificreports/
Ribonuclease P (RPP38) amplification. To ensure DNA integrity and to exclude the possibility of false
negatives due to the presence of eventual inhibitors, the TaqMan RPP38 Control Reagents kit (Catalog number
4316844, Applied Biosystems, Foster City, CA, USA) was used as a reference amplification control following the
manufacturer’s protocol. All reactions were performed in a MicroAmp Fast Optical 96-Well Reaction Plate using
the 7,500 Fast Real-Time PCR System Mix (Applied Biosystems).
Bisulfite treatment. A total volume of 20 μL [20 ng/μL] of DNA extracted from DBS and WB was treated
with EZ-96 DNA Methylation-Gold Kit (Zymo Research, Irvine, CA, USA), following the manufacturer’s proto-
col. Bisulfite converted DNA was quantified by NanoDrop 2000 Spectrophotometer (Thermo Scientific).
Methylation‑sensitive high‑resolution melting (MS‑HRM). The MS-HRM was performed in trip-
licates with the bisulfite-treated DNA isolated from DBS or WB from each individual. It was performed in a
MicroAmp Fast Optical 96-Well Reaction Plate using the 7,500 Fast Real-Time PCR System Mix (Applied Bio-
systems) with the primers 5′‐GGATTTTTGTATTGCGGTAAATAAG‐3′ and 5′‐CAACTAACCTTACCCACT
CCATC‐3′ (forward and reverse, respectively) as previously described16. The melting temperatures of 78 °C and
83 °C were chosen as a near-proportional amplification of unmethylated and methylated alleles, respectively. As
described by Ferreira et al. (2019), the pair of primers used in this study act as a positive control for the bisulfite
conversion, process due to the particularity of annealing in the treated DNA (Additional file 2: Figure S1).
Statistical analysis. Each group analysis was done with the unpaired Student’s t-test to detect differences
among them. A two-sided P value < 0.05 was considered statistically significant. Percentile, mean, median, and
standard deviation values of RPP38 amplifications were also calculated for comparative purposes.
Ethics approval and consent to participate. The Fernandes Figueira Institute IRB approved the study
(CAAE: 45767015.0.0000.5269). The written informed consent terms were obtained from all participants in this
study and from the consent of the LAR or responsible for the minor involved. All experimental protocols in this
manuscript were carried out in accordance with the ethical principles that govern research with human beings,
in accordance with the guidelines of the Declaration of Helsinki.
Data availability
The datasets generated and/or analyzed during the current study are not publicly available due to the confiden-
tiality and ethical aspects related to patient data but are available from the corresponding author on reasonable
request.
Received: 14 January 2020; Accepted: 14 July 2020
References
1. Driscoll, D. J., Miller, J. L., Schwartz, S. & Cassidy, S. B. Prader-Willi syndrome. In GeneReviews (eds Adam, M. P. et al.) (University
of Washington, Seattle, Seattle, WA, 1993).
2. Dagli, A. I., Mueller, J. & Williams, C. A. Angelman syndrome. In GeneReviews (eds Adam, M. P. et al.) (University of Washington,
Seattle, Seattle, WA, 1993).
3. Cassidy, S. B. & Driscoll, D. J. Prader-Willi syndrome. Eur. J. Hum. Genet. 17(1), 3–13. https://doi.org/10.1038/ejhg.2008.165
(2009).
4. Rodrigues, M. et al. Prader-Willi syndrome: An under-recognized cause of hypotonia?. J. Pediatr. Neonatal Individ. Med. 7(1),
e070107. https://doi.org/10.7363/070107 (2018).
5. Clayton-Smith, J. & Laan, L. Angelman syndrome: A review of the clinical and genetic aspects. J. Med. Genet. 40(2), 87–95. https
://doi.org/10.1136/jmg.40.2.87 (2003).
6. Sun, Y. Breakage in the SNRPN locus in a balanced 46, XY, t(15;19) Prader-Willi syndrome patient. Hum. Mol. Genet. 5(4), 517–524.
https://doi.org/10.1093/hmg/5.4.517 (1996).
7. Cassidy, S. B., Schwartz, S., Miller, J. L. & Driscoll, D. J. Prader-Willi syndrome. Genet. Med. 14(1), 10–26. https://doi.org/10.1038/
gim.0b013e31822bead0 (2012).
8. Angulo, M. A., Butler, M. G. & Cataletto, M. E. Prader-Willi syndrome: A review of clinical, genetic, and endocrine findings. J.
Endocrinol. Investig. 38(12), 1249–1263. https://doi.org/10.1007/s40618-015-0312-9 (2015).
9. Nicholls, R. D. & Knepper, J. L. Genome organization, function, and imprinting in Prader-Willi and Angelman syndromes. Annu.
Rev. Genom. Hum. Genet. 2, 153–175. https://doi.org/10.1146/annurev.genom.2.1.153 (2001).
10. Kotzot, D. & Utermann, G. Uniparental disomy (UPD) other than 15: Phenotypes and bibliography updated. Am. J. Med. Genet.
Part A. 136A(3), 287–305. https://doi.org/10.1002/ajmg.a.30483 (2005).
11. Buiting, K. et al. Inherited microdeletions in the Angelman and Prader-Willi syndromes define an imprinting center on human
chromosome 15. Nat. Genet. 9(4), 395–400. https://doi.org/10.1038/ng0495-395 (1995).
12. Saitoh, S. et al. Clinical spectrum and molecular diagnosis of Angelman and Prader-Willi syndrome patients with an imprinting
mutation. Am. J. Med. Genet. 68(2), 195–206 (1997).
13. Sato, M. Early origin and evolution of the Angelman syndrome ubiquitin ligase gene Ube3a. Front Cell Neurosci. https://doi.
org/10.3389/fncel.2017.00062 (2017).
14. Sadikovic, B. et al. Mutation update for UBE3A variants in Angelman syndrome. Hum. Mutat. 35(12), 1407–1417. https://doi.
org/10.1002/humu.22687(2014).
15. Kosaki, K., McGinniss, M. J., Veraksa, A. N., McGinnis, W. J. & Jones, K. L. Prader-Willi and Angelman syndromes: Diagnosis
with a bisulfite-treated methylation-specific PCR method. Am. J. Med. Genet. 73, 308–313 (1997).
16. Ferreira, I. R. F. I. R. et al. A rapid and accurate methylation-sensitive high-resolution melting analysis assay for the diagnostic of
Prader Willi and Angelman patients. Mol. Genet. Genom. Med. https://doi.org/10.1002/mgg3.637 (2019).
17. Smith, A. & Hung, D. The dilemma of diagnostic testing for Prader-Willi syndrome. Transl. Pediatr. 5(1), 46–56. https://doi.
org/10.21037/tp.2016.07.04 (2017).
Scientific Reports | (2020) 10:13026 | https://doi.org/10.1038/s41598-020-69750-0 7
Vol.:(0123456789)www.nature.com/scientificreports/
18. Beygo, J. et al. Update of the EMQN/ACGS best practice guidelines for molecular analysis of Prader-Willi and Angelman syn-
dromes. Eur. J. Hum. Genet. 27, 1326–1340. https://doi.org/10.1038/s41431-019-0435-0 (2019).
19. Hamajima, N., Saito, T., Matsuo, K. & Tajima, K. Competitive amplification and unspecific amplification in polymerase chain
reaction with confronting two-pair primers. J. Mol. Diagn. 4(2), 103–107. https://doi.org/10.1016/S1525-1578(10)60688-5 (2002).
20. Hollegaard, M. V. et al. Archived neonatal dried blood spot samples can be used for accurate whole genome and exome-targeted
next-generation sequencing. Mol. Genet. Metab. 110(1–2), 65–72. https://doi.org/10.1016/j.ymgme.2013.06.004 (2013).
21. Zakaria, R., Allen, K. J., Koplin, J. J., Roche, P. & Greaves, R. F. Advantages and challenges of dried blood spot analysis by mass
spectrometry across the total testing process. EJIFCC 27(4), 288–317 (2016).
22. Ganz, N. et al. Development and validation of a fully automated online human dried blood spot analysis of bosentan and its metabo-
lites using the Sample Card And Prep DBS system. J. Chromatogr. B 885–886, 50–60. https: //doi.org/10.1016/j.jchrom b.2011.12.012
(2012).
23. Gupta, K. & Mahajan, R. Applications and diagnostic potential of dried blood spots. Int. J. Appl. Basic Med. Res. 8(1), 1–2. https
://doi.org/10.4103/ijabmr.IJABMR_7_18 (2018).
24. Barbi, M., Binda, S., Primache, V., Luraschi, C. & Corbetta, C. Diagnosis of congenital cytomegalovirus infection by detection of
viral DNA in dried blood spots. Clin. Diagn. Virol. 6(1), 27–32. https://doi.org/10.1016/0928-0197(96)00228-0 (1996).
25. Walsh, P. S., Metzger, D. A. & Higuchi, R. Chelex 100 as a medium for simple extraction of DNA for PCR-based typing from
forensic material. Biotechniques 10(4), 506–513. https://doi.org/10.2144/000114018 (1991).
26. Lim, M. D. Dried blood spots for global health diagnostics and surveillance: Opportunities and challenges. Am. J. Trop. Med. Hyg.
99(2), 256–265. https://doi.org/10.4269/ajtmh.17-0889 (2018).
27. Cankar, K., Štebih, D., Dreo, T., Žel, J. & Gruden, K. Critical points of DNA quantification by real-time PCR—Effects of DNA
extraction method and sample matrix on quantification of genetically modified organisms. BMC Biotechnol. 6, 37. https://doi.
org/10.1186/1472-6750-6-37 (2006).
28. Schrader, C., Schielke, A., Ellerbroek, L. & Johne, R. PCR inhibitors—Occurrence, properties and removal. J. Appl. Microbiol.
113(5), 1014–1026. https://doi.org/10.1111/j.1365-2672.2012.05384.x (2012).
29. Ziller, M. J., Stamenova, E. K., Gu, H., Gnirke, A. & Meissner, A. Targeted bisulfite sequencing of the dynamic DNA methylome.
Epigenetics Chromatin. https://doi.org/10.1186/s13072-016-0105-1 (2016).
30. Xu, H. et al. Bisulfite genomic sequencing of DNA from dried blood spot microvolume samples. Forensic Sci. Int. Genet. 6(3),
306–309. https://doi.org/10.1016/j.fsigen.2011.06.007 (2012).
31. Ehrich, M., Zoll, S., Sur, S. & van den Boom, D. A new method for accurate assessment of DNA quality after bisulfite treatment.
Nucleic Acids Res. 35(5), e29. https://doi.org/10.1093/nar/gkl1134 (2007).
32. Cassol, S. et al. Use of dried blood spot specimens in the detection of human immunodeficiency virus type 1 by the polymerase
chain reaction. J. Clin. Microbiol. 29(4), 667–671 (1991).
33. Hamvas, A. et al. Population-based screening for rare mutations: High-throughput DNA extraction and molecular amplification
from guthrie cards. Pediatr. Res. 50(5), 666–668. https://doi.org/10.1203/00006450-200111000-00021 (2001).
34. Uttayamakul, S. et al. Usage of dried blood spots for molecular diagnosis and monitoring HIV-1 infection. J. Virol. Methods
128(1–2), 128–134. https://doi.org/10.1016/j.jviromet.2005.04.010 (2005).
35. Boppana, S. B. Dried blood spot real-time polymerase chain reaction assays to screen newborns for congenital cytomegalovirus
infection. JAMA 303(14), 1375. https://doi.org/10.1001/jama.2010.423 (2010).
36. Sa’adah, N. et al. A rapid, accurate and simple screening method for spinal muscular atrophy: High-resolution melting analysis
using dried blood spots on filter paper. Clin Lab. 61(5–6), 575–580 (2015).
37. Vázquez-Morón, S. et al. Evaluation of dried blood spot samples for screening of hepatitis C and human immunodeficiency virus
in a real-world setting. Sci. Rep. https://doi.org/10.1038/s41598-018-20312-5 (2018).
38. Czibere, L. et al. High-throughput genetic newborn screening for spinal muscular atrophy by rapid nucleic acid extraction from
dried blood spots and 384-well qPCR. Eur. J. Hum. Genet. https://doi.org/10.1038/s41431-019-0476-4 (2019).
39. Bacheré, N. et al. Early diagnosis and multidisciplinary care reduce the hospitalization time and duration of tube feeding and
prevent early obesity in PWS infants. Horm. Res. Paediatr. 69(1), 45–52. https://doi.org/10.1542/pir.30-9-e66 (2008).
40. Peredo, D. E. & Hannibal, M. C. The floppy infant: Evaluation of hypotonia. Pediatr. Rev. 30(9), e66-76. https://doi.org/10.1542/
pir.30-9-e66 (2009).
41. Brooks, B. R. Earlier is better: The benefits of early diagnosis. Neurology. 53(8 Suppl 5), S53-54 (1999) ((discussion S55–57)).
42. George, R. S. & Moat, S. J. Effect of dried blood spot quality on newborn screening analyte concentrations and recommendations
for minimum acceptance criteria for sample analysis. Clin. Chem. 62(3), 466–475. https://doi.org/10.1373/clinchem.2015.24766
8 (2016).
43. Sørensen, K. M. et al. Detecting 22q11.2 deletions by use of multiplex ligation-dependent probe amplification on DNA from
neonatal dried blood spot samples. J. Mol. Diagn. 12(2), 147–151. https://doi.org/10.2353/jmoldx.2010.090099 (2010).
44. Goldstein, J. L. et al. Screening for pompe disease using a rapid dried blood spot method: Experience of a clinical diagnostic
laboratory. Muscle Nerve. 40(1), 32–36. https://doi.org/10.1002/mus.21376 (2009).
45. Scott, C. R. et al. Identification of infants at risk for developing fabry, pompe, or mucopolysaccharidosis-I from newborn blood
spots by tandem mass spectrometry. J. Pediatr. 163(2), 498–503. https://doi.org/10.1016/j.jpeds.2013.01.031 (2013).
46. Lei, K. et al. A pilot screening of high-risk Gaucher disease children using dried blood spot methods in Shandong province of
China. Orphanet. J. Rare Dis. https://doi.org/10.1186/s13023-018-0782-x (2018).
47. Buelow, B. J., Verbsky, J. W. & Routes, J. M. Newborn screening for SCID: Lessons learned. Expert Rev. Hematol. 9(6), 579–584.
https://doi.org/10.1080/17474086.2016.1180243 (2016).
48. Chan, K. & Puck, J. M. Development of population-based newborn screening for severe combined immunodeficiency. J. Allergy
Clin. Immunol. 115(2), 391–398. https://doi.org/10.1016/j.jaci.2004.10.012 (2005).
49. Charoenkwan, P. et al. High-resolution melting analysis for prenatal diagnosis of beta-thalassemia in northern Thailand. Int. J.
Hematol. 106(6), 757–764. https://doi.org/10.1007/s12185-017-2306-1 (2017).
50. Dewey, F. E., Pan, S., Wheeler, M. T., Quake, S. R. & Ashley, E. A. DNA sequencing: Clinical applications of new DNA sequencing
technologies. Circulation 125(7), 931–944. https://doi.org/10.1161/CIRCULATIONAHA.110.972828 (2012).
Acknowledgements
The authors thank the patients and their families for participating in the study. All the experiments were devel-
oped in the technological platform “RPT09I—PCR in Real Time—IFF, belonging to FIOCRUZ Network of
Technical Platforms (PDTIS/FIOCRUZ). This work was supported by “Conselho Nacional de Desenvolvimento
Científico e Tecnológico (CNPQ)” and was financed in part by the “Coordenação de Aperfeiçoamento de Pessoal
de Nível Superior—Brasil (CAPES)—Finance Code 001.
Author contributions
I.R.F., R.A.C., and L.H.F.G. contributed to the design and implementation of the research, to the analysis of the
results and to the writing of the manuscript. W.D.S.C. processed the experimental data. L.S.T., S.F., and J.C.L.J.
Scientific Reports | (2020) 10:13026 | https://doi.org/10.1038/s41598-020-69750-0 8
Vol:.(1234567890)www.nature.com/scientificreports/
clinically diagnosed the patients and collected samples. R.D.N. provided consultation and contributed to the
writing of the manuscript. Z.F.M.V. and L.C.G. conceived the study and were in charge of the overall direction
of the project. All authors discussed the results and contributed to the final manuscript.
Competing interests
The authors declare no competing interests.
Additional information
Supplementary information is available for this paper at https://doi.org/10.1038/s41598-020-69750-0.
Correspondence and requests for materials should be addressed to L.d.G.
Reprints and permissions information is available at www.nature.com/reprints.
Publisher’s note Springer Nature remains neutral with regard to jurisdictional claims in published maps and
institutional affiliations.
Open Access This article is licensed under a Creative Commons Attribution 4.0 International
License, which permits use, sharing, adaptation, distribution and reproduction in any medium or
format, as long as you give appropriate credit to the original author(s) and the source, provide a link to the
Creative Commons license, and indicate if changes were made. The images or other third party material in this
article are included in the article’s Creative Commons license, unless indicated otherwise in a credit line to the
material. If material is not included in the article’s Creative Commons license and your intended use is not
permitted by statutory regulation or exceeds the permitted use, you will need to obtain permission directly from
the copyright holder. To view a copy of this license, visit http://creativecommons.org/licenses/by/4.0/.
© The Author(s) 2020
Scientific Reports | (2020) 10:13026 | https://doi.org/10.1038/s41598-020-69750-0 9
Vol.:(0123456789)You can also read