H-TFIDF: What makes areas specific over time in the massive flow of tweets related to the covid pandemic? - Agritrop
←
→
Page content transcription
If your browser does not render page correctly, please read the page content below
AGILE: GIScience Series, 2, 2, 2021. https://doi.org/10.5194/agile-giss-2-2-2021
Proceedings of the 24th AGILE Conference on Geographic Information Science, 2021.
Editors: Panagiotis Partsinevelos, Phaedon Kyriakidis, and Marinos Kavouras.
This contribution underwent peer review based on a full paper submission.
© Author(s) 2021. This work is distributed under the Creative Commons Attribution 4.0 License.

H-TFIDF: What makes areas specific over time in the massive
flow of tweets related to the covid pandemic?
Rémy Decoupesa (corresponding author), Rodrique Kafandoa , Mathieu Rochea,b and Maguelonne
Teisseirea
remy.decoupes@inrae.fr, rodrique.kafando@inrae.fr, mathieu.roche@cirad.fr, maguelonne.teisseire@inrae.fr

a
    TETIS, Univ Montpellier, AgroParisTech, CIRAD, CNRS, INRAE, Montpellier, France
b
    CIRAD, F-34398 Montpellier, France

Abstract.                                                                       works focus on identifying trends, top-k most signifi-
Data produced by social networks may contain weak                               cant words over a period of time, the most represen-
signals of possible epidemic outbreaks. In this paper,                          tative words for a city or for a country, to a certain
we focus on Twitter data during the waiting period be-                          month, in a year, and etc. Nevertheless, what is crucial
fore the appearance of COVID-19 first cases outside                             for a pandemic analysis is to exactly identify the dis-
China. Among the huge flow of tweets that reflects a                            criminant vocabulary over space and time by exploring
global growing concern in all countries, we propose to                          the possible specificities without any a priori. The de-
analyze such data with an adaptation of the TF-IDF                              cision maker needs include a dynamic analysis allow-
measure. It allows the users to extract the discriminant                        ing him to navigate through the spatial and temporal
vocabularies used across time and space. The results                            dimensions (Depoux et al. (2020)).
are then discussed to show how the specific spatio-                             That is the main objective of the work presented in
temporal anchoring of the extracted terms make it pos-                          this paper. More precisely, the two following points
sible to follow the crisis dynamics on different scales                         are detailed: (1) identifying the specific terms and (2)
of time and space.                                                              focusing on the spatial and temporal navigation that
                                                                                could improve the tweet analysis. We illustrate these
Keywords. TF-IDF, Hierarchical analysis, Pandemic                               various ways of exploring tweet corpus in the health
situation, social network                                                       context of the coronavirus COVID-19 pandemic. By
                                                                                using an adaptive interest measure, our proposal offers
                                                                                a global view of the evolution of words over space
                                                                                and time. Experiments applied on a public dataset
1     Introduction                                                              underline that some lessons could be learned.

Social networks have become useful to detect and an-                            The interest of our proposal is illustrated through the
alyze events, dangers or threats like disease outbreaks,                        analysis of the top extracted terms for Greece (See
nature hazards, social movements, etc (Tsou and Leit-                           Section 4.3 for more details). In the TOP10 terms
ner (2013)). Users of these platforms can be seen as                            at the end of February, the words "thessaloniki" and
citizen journalists or sensor observations (Nagarajan                           "carnival" appear. The first term refers to the first
et al. (2009)). Their reporting cover three dimensions:                         COVID-19 case in Greece who have been treated in
theme, spatial and temporal. Unlike other social net-                           the Thessaloniki hospital. Tweets containing this term
works, Twitter has the particularity of allowing its                            report panic buying of antiseptic in this area two days
users to access, comment and contribute to all topics                           after. Following up "carnival" highlights the Greek
or threads (Li et al. (2012)).                                                  government decision to cancel the Xanthi Carnival.
Analysing such big amount of information is still chal-                         Our approach extracts terms mainly used for a certain
lenging due to the specificity of the messages (i.e.                            region and period that report information about the
specific vocabulary, shortness of the message). Most                            local situation, the crisis management and opinions

                          Reproducibility review: https://doi.org/10.17605/osf.io/rdnyu                                           1 of 8
of inhabitants. These information would be hard to                     Retrospective spatio-temporal analysis of tweets con-
discovered using methods from the literature (See                      tents need discriminant methods for extracting terms
Section 4.3 for details). Hence, proposing navigation                  as well. Working on past trending topics, the authors
on different levels of a hierarchy could be very helpful               of (Nagarajan et al., 2009) alter the TF-IDF metrics
for the epidemiological surveillance.                                  to find new key features to answer to the question:
                                                                       what is a region paying attention during a past event?
The rest of the paper is organized as follows. Section 2               They defined spatio-temporal subsets of the corpus
is devoted to related work. Section 3 details the specific             according to time and space intervals. TF-IDF is then
measure for tweet analysis. Some experiments and re-                   modified to enhance term that are often used during
sults are presented in Section 4. Finally, we conclude                 this spatio-temporal set and less used globally. At
in Section 5 with some future works.                                   the end of this step, term scores are improved if they
                                                                       are not present in the previous time interval or in
                                                                       the geographical spaces. This emphasizes even more
                                                                       the discriminating terms of a space-time window.
2   Related work                                                       In (Bringay et al., 2011), the authors analyze tweets
                                                                       according to their multidimensional characteristics in
From the first signs of the emergence of the COVID-                    a data-warehouse by using a Roll-up operator. Each
19 disease, the panic may spreads faster than the virus                specific context is defined at its associated spatial
itself. The weight of public sentiment have sometimes                  hierarchy level.
led to disproportionate decisions in regard of the pub-
lic health needs (Depoux et al. (2020)). The authors                   To the best of our knowledge, there is no approach
call for public health agencies to equip themselves with               exploiting both spatial and temporal hierarchical
tools to monitor alerts and concerns and lead spatio-                  aspects. In this paper, we focus on the hierarchical
temporal analysis of social media in order to adapt                    characteristics of these dimensions to provide an
their communication to specific regions. Although this                 adaptive measure for extracting the more relevant
is a rich source of information, tweets are still very                 information as well as the specific indicators related
noisy and sometimes meaningless (Li et al. (2012)).                    to one or more hierarchies. Moreover, to review and
These difficulties are exacerbated by the discussions                  analyse our results, we adopt a specific representation
generated by the pandemic crisis, on which the whole                   model called BERT (Devlin et al., 2019). Based on
world focuses its attention (Alshaabi et al. (2021)) and               a very large training set (billion word corpus), this
shares similar terms among countries like coronavirus,                 model assigns to each term a list of values (a vector)
mask, lockdown. To meet the needs of public health,                    that reflects the meaning of a word with its context.
it is therefore necessary to be able to extract the terms              This representation in vectors allows mathematical
specifically used by regions among the massive flow of                 computations as semantic distance calculation be-
common words.                                                          tween terms. Multiple models, based on different
                                                                       training set, are openly available like RoBERTa (Liu
Based on linguistics and statistics approaches, metrics
                                                                       et al., 2019), COVID-Twitter-BERT (Müller et al.,
are developed to detect discriminating terms. Twitter-
                                                                       2020), or DistilBert (Sanh et al., 2020).
based monitoring or alerting systems must adapt to
detect change in the terminology used by users. In
(Le Sceller et al., 2017), authors want to follow cyber-
security news by enriching their list of keywords used                 3    Hierarchy-based measure for tweet
to query Twitter. They track co-occurrences of term                         analysis
with their list to extract candidates which would be se-
lected according to a threshold on TF-IDF score (See
                                                                       In this section, we present the improvement of the
Section 3). This method deals with the thematic dimen-
                                                                       TF-IDF measure that allows us to take advantage
sion. Other studies adapt the TF-IDF measure to the
                                                                       of the available hierarchies. It aim is to provide the
time dimension. The authors in (Alsaedi et al., 2016)
                                                                       end-user with facilities to focus on particular levels.
are facing computational issues when they try to sum-
                                                                       Traditionally, the T F -IDF measure gives greater
up new tweets by extracting TF-IDF top five scores in a
                                                                       weight to the specific words of a document (Salton
time interval. Indeed, with each new tweet, all TF-IDF
                                                                       et al., 1975).
score must be updated for the whole corpus. When the
computation time get longer, it becomes difficult to fol-
low the real time flux. In (Erra et al., 2015), the authors            Let D = d1 , d2 , ..., dn be a collection of documents and
propose an approximate version of the TF–IDF mea-                      t a term in the collection, the term frequency-inverse
sure for data stream. Following the hypothesis of a fast               document measure is defined as follows:
response needed and a memory small and limited, an
approximative TF-IDF measure is computed showing
interested performances compare to the classic one.                    T F − IDF (t, d, D) = T F (t, d) × IDF (t, D)         (1)

AGILE: GIScience Series, 2, 2, 2021 | https://doi.org/10.5194/agile-giss-2-2-2021                                          2 of 8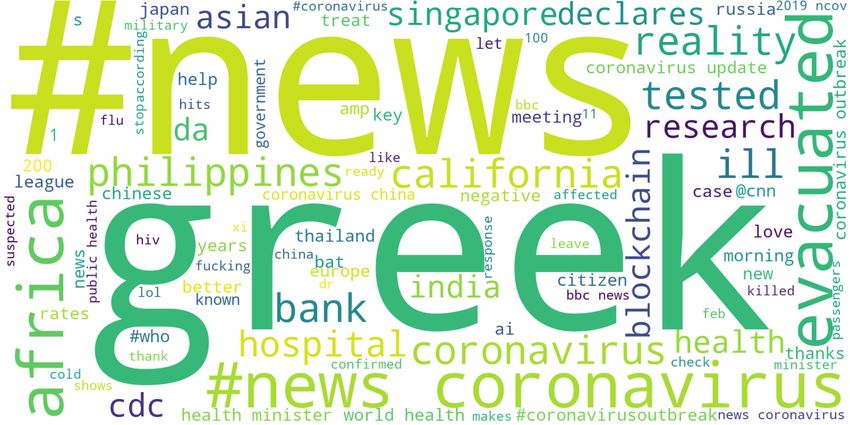
with TF and IDF defined as:                                                 4         Experiments

                   f req(t, d)                                              4.1       Description of the corpus
         T F (t, d) =
                       |d|
                      |D|                                                   To evaluate the H-TFIDF efficiency for extracting
IDF (t, D) = log2                                                     (2)
                  |{d|t ∈ d}|                                               discriminant terms in spatial and temporal windows,
                                                                            the experiments are conducted on a corpus of tweets
                                                                            related to COVID-19. Several initiatives have been
Our proposal is inspired of the T F -IDFadaptive ,                          carried out since the beginning of the crisis like (Ofli,
which identifies the most significant words according                       2020), (Balech et al., 2020) and on the machine
to spatial level hierarchies of data cube in the data-                      learning competitions platform Kaggle1 . As we want
warehouse context (Bringay et al., 2011). In this frame-                    to focus on the early beginning of the outbreak, we
work, we want to focus on the desired level of the hi-                      processed the dataset collected by E.Chen (Chen et al.,
erarchy. The hierarchical IDF is thus defined for the                       2020) which starts the earliest (i.e., January 22, 2020).
elements sharing the same hierarchical path. Starting                       During this period, common words related to the
from the TF-IDF definition, we adapt the measure to                         COVID-19 have been used worldwide (Alshaabi et al.,
the specific levels of the associated dimensions (time                      2021). In this massive flow of similar terminologies,
and space hierarchies).                                                     we want to assess the spatio-temporal anchoring of
Taking into account the specificities of the tweets, we                     the terms extracted by H-TFIDF. This corpus has
adopt the following hypothesis: a term appears only                         been also used by other studies. (Ferrara, 2020)
once in a tweet (unlike academic papers or media news,                      characterizes the impact of Twitter bots on COVID-19
words are rarely repeated inside a tweet), that means                       conspiracies and (Jiang et al., 2020) analyses the
TF of terms are low . Thus a tweet cannot be the doc-                       political polarization in the United States. This corpus
ument unit in the TF-IDF definition. A document d is                        have been enhanced as well by (Lopez and Gallemore,
considered as a triple (si , tj , {ek , occ}) where si stands               2020) to complete their collection with other key-
for a specific value on the space dimension of the i                        words and apply state-of-the-art methods on sentiment
level of the associated hierarchy, tj stands for a specific                 analysis and named entity recognition.
value on the time dimension of the j level of the asso-
ciated hierarchy, {ek , occ} stands for the set of terms                    For our study, we worked on a subset of this corpus.
related to the tweets concerned by the value si and tj                      First, we removed retweets because they provide a res-
with its occurrence number. The corpus D is the set                         onance chamber and increase number of occurrences
of documents considered as the nodes at level i for the                     that can distort our statistical measurement. Then we
space dimension and level j on the time dimension.                          only focused on the period between January 22 to
Varying the space and time dimensions will modify                           February 29, 2020 with around 8,7 Millions of tweets,
both T F and IDF contrary to the adaptative mea-                            as countries were encountering their first COVID-19
sure defined in (Bringay et al., 2011) where only the                       cases. As described in the next section, Processing
IDF value definition changes. The Hierarchical TF-                          pipeline, we geocoded around 2,7 Millions of tweets
IDF denoted H-TF-IDF is thus defined as: H − T F −                          world wild. Finally, we conducted our experiments on
IDF (t, d(si ,tj ) , D(leveli ,tj ) ) =                                     European countries (670 000 tweets) in English (270
                                                                            000 tweets). Fig. 1 shows the distribution of tweets in
                                                                            European countries.

T F (t, d(si ,tj ) ) × IDF (t, D(leveli ,tj ) )                       (3)
                                                                            4.2       Processing pipeline

with TF and IDF defined as:                                                 The processing pipeline, available in our repository2
                                                                            has four main steps: collect, indexing & geocoding,
                                              f req(t, d(si ,tj )           pre-process and computation of H-TFIDF as described
                     T F (t, d(si ,tj ) ) =                                 in fig. 2. The first step consists to retrieve tweets, also
                                                 |d(si ,tj ) |
                                                                            called hydrate tweets, from E.Chen corpus of tweet
                                        |D(leveli ,tj ) |                   IDs3 .
IDF (t, D(leveli ,tj ) ) = log2
                                  |{d0(si ,tj ) |t ∈ d0(si ,tj ) }|
                                                                                  1
                                                                      (4)         https://www.kaggle.com/smid80/coronavirus-covid19-
                                                                            tweets-early-april,
                                                                            https://www.kaggle.com/gpreda/covid19-tweets
with d0(si ,tj ) having the same hierarchical path on the                       2
                                                                                  https://gitlab.irstea.fr/remy.decoupes/covid19-tweets-
space dimension and the same time dimension value as                        mood-tetis
                                                                                3
d(si ,tj ) .                                                                      https://github.com/echen102/COVID-19-TweetIDs/

AGILE: GIScience Series, 2, 2, 2021 | https://doi.org/10.5194/agile-giss-2-2-2021                                                  3 of 8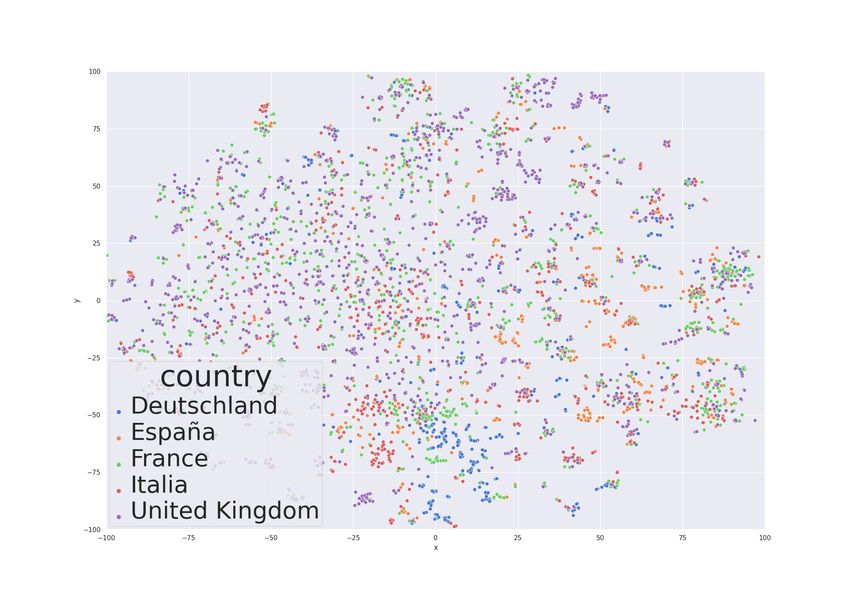
Tweets metadata and content are then both indexed into
                                                                       an ElasticSearch4 database in the second step. Elastic-
                                                                       Search shorten search queries duration which is useful
                                                                       to extract subcorpora, explore data or for pre- and post-
                                                                       processing (Barbaresi and Tinoco (2018)). To increase
                                                                       the number of georeferenced tweets from 2% to almost
                                                                       20%, locations defined by users (i.e. user.location in
                                                                       tweet metadata) are geocoded (Dredze et al. (2013)),
                                                                       during the indexing, using OpenStreetMap data5 and
                                                                       the open source geocoder photon hosted by Komoot6 .
                                                                       Other studies decide to geocode tweets not only with
                                                                       the user location but also with the language used (Al-
                                                                       shaabi et al. (2021)) or the content of tweets (Ofli
                                                                       (2020)). However infer location based on the language
                                                                       may lead to mistakes as English, Spanish, Arab or
                                                                       French could be spoken in different countries. Geocod-
                                                                       ing spatial information in tweet content could add
                                                                       noise, as well, for example in tweets talking about a
                                                                       football match between two cities which could spread
                                                                       the virus among supporters.
Figure 1. Distribution of geocoded tweets for European
countries from 2020-01-22 to 2020-02-29 from E.Chen cor-               Filtering tweets based on their location and metadata is
pus                                                                    then processed in the third step. We filter in only orig-
                                                                       inal tweets (no re-tweets), in English, from European
                                                                       country.
                                                                       The fourth task is dedicated to the computation of
                                                                       H-TFIDF. First, tweet contents are aggregated on the
                                                                       smallest spatial and time slot defined, i.e. by city
                                                                       and day. Token occurrences are then calculated using
                                                                       scikit-learn (Pedregosa et al., 2011) on a vocabulary of
                                                                       25 000 unigram that have at least one character and
                                                                       eventually a "" or "#" to keep name accounts and key-
                                                                       words. Finally we compute multiple TF-IDF on the
                                                                       corpus with multiple document configurations, i.e., ag-
                                                                       gregated over spatial (city, state, country) and temporal
                                                                       (day, week, month) dimensions to retrieve H-TFIDF.

                                                                       4.3       Results

                                                                       H-TFIDF extracts insight terms for each level of the hi-
                                                                       erarchy, from country per month to city per day. Fig.3
                                                                       illustrates H-TFIDF results for Greece during Febru-
                                                                       ary. The size of the term font reflects the rank of the
                                                                       term. We can easily identify terms mainly used in
                                                                       Greece to then explore a specific topic. For example,
                                                                       the analysis of tweets containing the word "cruise" for
                                                                       the week 2020-02-02 reports two topics. The first one
                                                                       is the fear that the virus would spread through boats
                                                                       passengers. The second topic reports concerns about
                                                                       passengers forced to stay on board. Other example,
                                                                       tweets containing the word "Thessaloniki" extracted in
                                                                       week 2020-02-23 report two pieces of information of
                                                                       the local situation in Greece. Thessaloniki hospital is
Figure 2. Description of the processing pipeline                       treated the first COVID-19 case in Greece and Twitter

                                                                             4
                                                                               https://www.elastic.co
                                                                             5
                                                                               https://www.openstreetmap.org/
                                                                             6
                                                                               https://photon.komoot.io/

AGILE: GIScience Series, 2, 2, 2021 | https://doi.org/10.5194/agile-giss-2-2-2021                                         4 of 8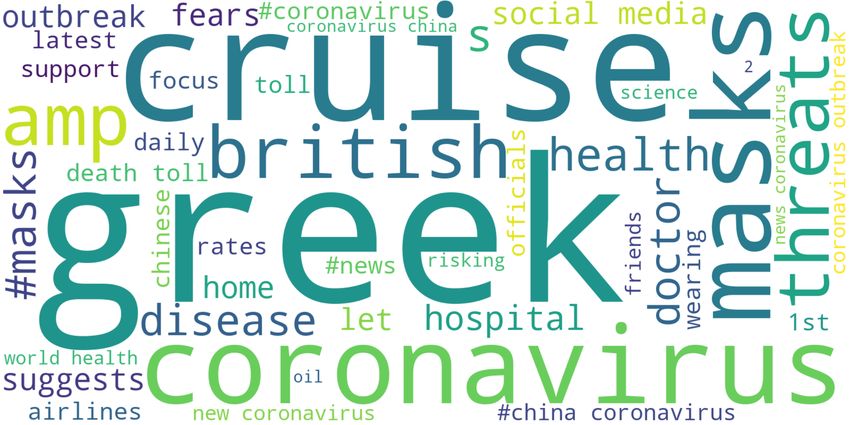
users are reporting first panic buying of surgical masks
                                                                       and antiseptic.

                                                                       4.4   Discussion

                                                                       In order to evaluate and compare our measure with the
                                                                       state-of-the-art TF-IDF measure (equation 1), we car-
                                                                       ried out two kinds of experiments. The first one as-
                                                                       sesses H-TFIDF ability to extract discriminating terms,
                                                                       i.e. terms that can characterise a country / region / city
                                                                       for a period. We thus compute the overlapping between
                                                                       extracted terms from H-TFIDF, TF-IDF and the most
                                                                       frequent terms used by a country. For example, let us
                                                                       focus on United Kingdom (UK) during the last week of
                                                                       January. The table 1 shows the TOP15 terms for each
                                                                       measure. We can observe that H-TFIDF captures terms
                      (a) week 2020-02-02                              with a strong anchoring in UK as #brexitday or #coro-
                                                                       navirusuk. Other terms like #missamericana or Ighalo
                                                                       refers to movie release or football events that were dis-
                                                                       cussed a lot during this period in UK even if they were
                                                                       not related to the COVID-19 crisis. Finally, global used
                                                                       terms like "coronavirus" or "wuhan" are still present
                                                                       in H-TFIDF but in a lesser amount than TF-IDF. The
                                                                       fig. 4 is another visualisation of the TOP100 terms
                                                                       for each measure. It is a Venn diagram representation
                                                                       (Ho et al., 2021), the intersections of circles give the
                                                                       list of common terms between measures. The inter-
                      (b) week 2020-02-09                              section between H-TFIDF and the most used terms in
                                                                       UK is greater than TF-IDF and the most used terms.
                                                                       This is confirmed for each country studied. Indeed the
                                                                       fig.5 shows percentage of common words between H-
                                                                       TFIDF or TF-IDF terms in one hand and the most fre-
                                                                       quent terms used by country in the other hand. The
                                                                       analysis of these overlap ratios reveals that H-TFIDF
                                                                       (in blue) succeed in extracting terms mainly used by
                                                                       local areas better than TF-IDF (in orange). However
                                                                       the overlap between H-TFIDF and the most frequent
                                                                       terms should not be 100% either because we except H-
                                                                       TFIDF to not extract terms also used in other countries.
                      (c) week 2020-02-16

                                                                         H-TFIDF           TF-IDF                   Frequent terms
                                                                        #brexitday         #brexit                   coronavirus
                                                                        #coronavirusuk     #china                    china
                                                                        #missamericana #corona                       #coronavirus
                                                                        #walls             #coronavirus              people
                                                                        coronavirus        #coronavirusoutbreak virus
                                                                        wuhan              #coronavirustruth         corona
                                                                        #coronarivus       #covid19                  outbreak
                                                                        model              #hongkong                 just
                                                                        virus              #outbreak                 news
                      (d) week 2020-02-23                               china              #usa                      like
                                                                        people             #wuhan                    chinese
Figure 3. Wordcloud of H-TFIDF terms for Greece by week
                                                                        york               #wuhancoronavirus         cases
                                                                        #coronavirus       #wuhanvirus               world
                                                                        just               absolutely                death
                                                                        ighalo             according                 wuhan
                                                                       Table 1. Term ranking - last week of January - UK

AGILE: GIScience Series, 2, 2, 2021 | https://doi.org/10.5194/agile-giss-2-2-2021                                           5 of 8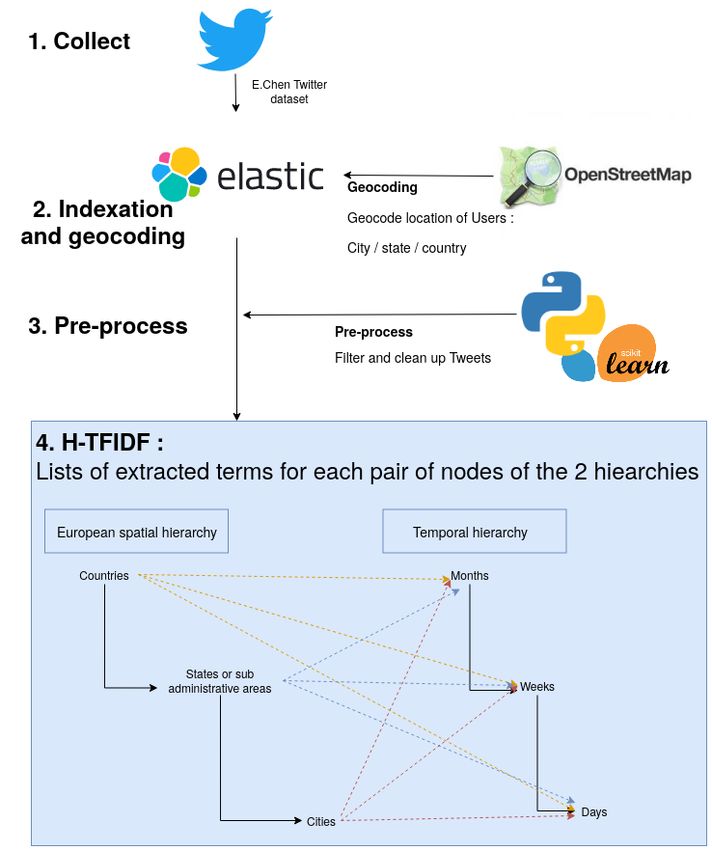
Figure 4. Common terms between H-TFIDF, TF-IDF and
most frequent terms for United Kingdom in the last week of
February

                                                                                          (a) TOP 100 first terms

For the next evaluation, we highlight and compare
semantic diversity of H-TFIDF selected terms com-
pare to TF-IDF selected terms. We thus encode each
term using the language model DistilBERT (Sanh
et al., 2020) as introduced in the related work section.
To visualize this comparison, we apply a dimension
reduction of the DistilBert representation of our
terms with t-SNE algorithm, i.e., we reduce the 766
dimensions to 2 and then visualize it in a scatter
plot for H-TFIDF terms in fig.6a and for TF-IDF
terms in fig. 6b. Both figures have the same scale.
Each term is a dot and is defined by two coordinates
                                                                                          (b) TOP 200 first terms
in this semantic space. The axes therefore have no
unit. The distance between two dots (or two terms)
is anti-proportional to their semantic similarity. For
instance "coronavirus" and "corona" will be closer
than "coronavirusuk". For this study, we focus on the
semantic extent of H-TFIDF compared to TF-IDF. We
can observe that H-TFIDF term projections have a
taller extent than TF-IDF. The analysis of term clusters
(set of nearby terms) could be part of further works
related to topic modelling. This reflects the greater
semantic diversity of H-TFIDF terms. This diversity
of terms is interesting as it could be used as a proxy to
monitor a local situation and could help to understand
what makes this local situation special compared with
other places during a crisis or an emergency.

                                                                                          (c) TOP 500 first terms
To sum-up, H-TFIDF has three advantages. These
evaluations show that H-TFIDF captures terms with                      Figure 5. Comparison of percentage of common words be-
a strong anchoring for a region at a period. More-                     tween H-TFIDF or TF-IDF with the most frequent terms per
over, these terms reflect local concerns since there are               country
widely and specifically used in their spatio-temporal
windows. Finally, we pointed out that these terms bring
also a greater semantic richness.

AGILE: GIScience Series, 2, 2, 2021 | https://doi.org/10.5194/agile-giss-2-2-2021                                        6 of 8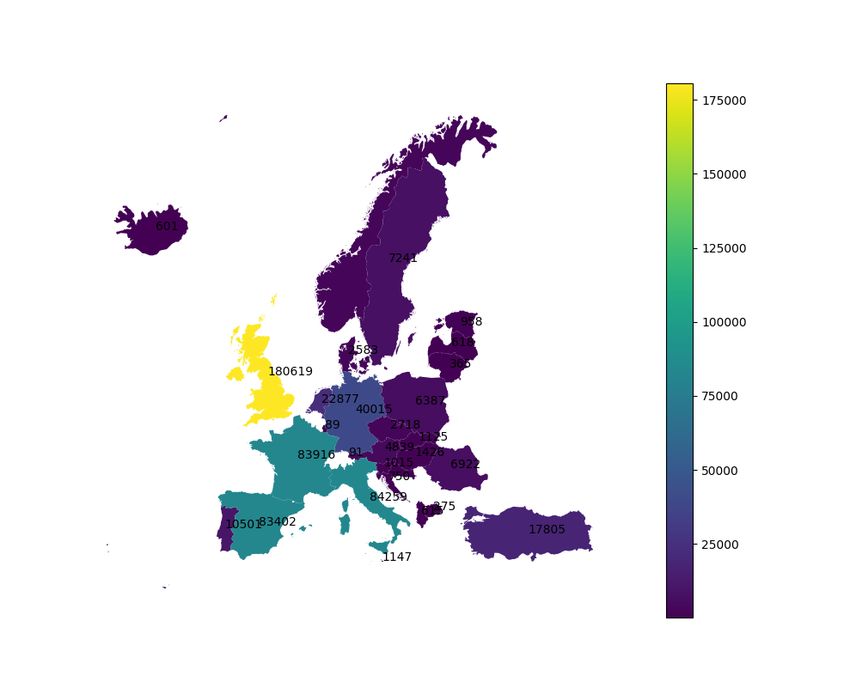
criteria. Browsing through spatial and temporal
                                                                       hierarchies (from country to city and month to
                                                                       day) provides insight of local concerns at different
                                                                       scales. This method, applied on COVID-19 related
                                                                       tweets, illustrates how public health agencies could
                                                                       have new sources of information about local situations.

                                                                       Our future work will focus on the automatic exploita-
                                                                       tion of H-TFIDF results in order to monitor the evo-
                                                                       lution and the dynamic of crisis. To do so, we will
                                                                       enhance H-TFIDF thank to language models such as
                                                                       BERT or GPT-3. These unsupervised models will be
                                                                       used to transliterate the meaning or the semantic of the
                                                                       extracted terms. This semantic representation will be
                          (a) H-TFIDF                                  leveraged with specialised controlled vocabularies in
                                                                       disaster management and public health to drive the cri-
                                                                       sis monitoring.
                                                                       In addition, an effort will also be made to take into
                                                                       account multilingualism. Indeed, in this current work,
                                                                       we decided to focus only on English tweets as the cor-
                                                                       pus was collected using only English keywords. This
                                                                       aspect will reduce the representativeness bias of Twit-
                                                                       ter for non English native speaker and will more effec-
                                                                       tively reflect the situation in European countries.

                                                                       Acknowledgements. This study was partially funded by EU
                                                                       grant 874850 MOOD and is catalogued as MOOD012. The
                                                                       contents of this publication are the sole responsibility of the
              (b) TF-IDF on subcorpora by country                      authors and do not necessarily reflect the views of the Eu-
                                                                       ropean Commission. This work was also partially supported
Figure 6. Projection of H-TFIDF and TF-IDF DistilBert rep-             by the French National Research Agency under the Invest-
resentation in a t-SNE space                                           ments for the Future Program, referred as ANR-16-CONV-
                                                                       0004, #DigitAg.

4.5   Data and Software Availability
                                                                       References
The      whole        workflow     is    available   at
https://gitlab.irstea.fr/remy.decoupes/covid19-tweets-                 Alsaedi, N., Burnap, P., and Rana, O.: Temporal TF-IDF: A
mood-tetis. This repository provides a detailed set of                   High Performance Approach for Event Summarization in
instructions for downloading the data and executing                      Twitter, in: 2016 IEEE/WIC/ACM International Confer-
the workflow, including data ingestion to Elastic-                       ence on Web Intelligence (WI), pp. 515–521, 2016.
                                                                       Alshaabi, T., Arnold, M. V., Minot, J. R., Adams,
Search, computing H-TFIDF and creating figures as
                                                                         J. L., Dewhurst, D. R., Reagan, A. J., Muhamad,
presented in this paper.
                                                                         R., Danforth, C. M., and Dodds, P. S.: How the
The workflow underlying this paper was partially                         world’s collective attention is being paid to a pan-
reproduced using a data subset by an indepen-                            demic: COVID-19 related n-gram time series for 24
dent reviewer during the AGILE reproducibility re-                       languages on Twitter, PLOS ONE, 16, e0244 476,
view and a reproducibility report was published at                       https://doi.org/10.1371/journal.pone.0244476, https://dx.
https://doi.org/10.17605/osf.io/rdnyu. The data subset                   plos.org/10.1371/journal.pone.0244476, 2021.
                                                                       Balech, S., Benavent, C., and Calciu, M.: The First French
and the associated configuration of the workflow are
                                                                         COVID19 Lockdown Twitter Dataset, 2020.
available at https://doi.org/10.5281/zenodo.4742151.                   Barbaresi, A. and Tinoco, A. R.: Using Elasticsearch for lin-
                                                                         guistic analysis of tweets in time and space, in: Proceed-
                                                                         ings of the Eleventh International Conference on Lan-
5     Conclusion and Future Work                                         guage Resources and Evaluation (LREC 2018), edited
                                                                         by Banski, P., Kupietz, M., Barbaresi, A., Biber, H.,
                                                                         Breiteneder, E., Clematide, S., and Witt, A., European
This paper proposes a new method for term ex-                            Language Resources Association (ELRA), Paris, France,
traction from tweet data based on spatio-temporal                        2018.

AGILE: GIScience Series, 2, 2, 2021 | https://doi.org/10.5194/agile-giss-2-2-2021                                              7 of 8
Bringay, S., Béchet, N., Bouillot, F., Poncelet, P., Roche, M., ciation for Computing Machinery, New York, NY, USA, and Teisseire, M.: Towards an On-Line Analysis of Tweets https://doi.org/10.1145/2396761.2396785, https://doi.org/ Processing, in: Database and Expert Systems Applications 10.1145/2396761.2396785, 2012. - 22nd International Conference, DEXA 2011, Toulouse, Liu, Y., Ott, M., Goyal, N., Du, J., Joshi, M., Chen, D., France, August 29 - September 2, 2011, Proceedings, Levy, O., Lewis, M., Zettlemoyer, L., and Stoyanov, V.: Part II, pp. 154–161, https://doi.org/10.1007/978-3-642- RoBERTa: A Robustly Optimized BERT Pretraining Ap- 23091-2_15, 2011. proach, 2019. Chen, E., Lerman, K., and Ferrara, E.: Tracking So- Lopez, C. E. and Gallemore, C.: An Augmented Multilingual cial Media Discourse About the COVID-19 Pan- Twitter Dataset for Studying the COVID-19 Infodemic, demic: Development of a Public Coronavirus Twit- preprint, In Review, https://doi.org/10.21203/rs.3.rs- ter Data Set, JMIR Public Health and Surveil- 95721/v1, https://www.researchsquare.com/article/ lance, 6, e19 273, https://doi.org/10.2196/19273, rs-95721/v1, 2020. http://publichealth.jmir.org/2020/2/e19273/, 2020. Müller, M., Salathé, M., and Kummervold, P. E.: COVID- Depoux, A., Martin, S., Karafillakis, E., Preet, R., Wilder- Twitter-BERT: A Natural Language Processing Smith, A., and Larson, H.: The pandemic of social Model to Analyse COVID-19 Content on Twitter, media panic travels faster than the COVID-19 out- arXiv:2005.07503 [cs], http://arxiv.org/abs/2005.07503, break, Journal of Travel Medicine, 27, taaa031, arXiv: 2005.07503, 2020. https://doi.org/10.1093/jtm/taaa031, https://academic. Nagarajan, M., Gomadam, K., Sheth, A. P., Ranabahu, A., oup.com/jtm/article/doi/10.1093/jtm/taaa031/5775501, Mutharaju, R., and Jadhav, A.: Spatio-Temporal-Thematic 2020. Analysis of Citizen Sensor Data: Challenges and Experi- Devlin, J., Chang, M.-W., Lee, K., and Toutanova, K.: BERT: ences, in: Web Information Systems Engineering - WISE Pre-training of Deep Bidirectional Transformers for Lan- 2009, edited by Vossen, G., Long, D. D. E., and Yu, J. X., guage Understanding, 2019. pp. 539–553, Springer Berlin Heidelberg, Berlin, Heidel- Dredze, M., Paul, M. J., Bergsma, S., and Tran, H.: Carmen: berg, 2009. A Twitter Geolocation System with Applications to Public Ofli, U. Q. M. I. F.: GeoCoV19: A Dataset of Health, in: AAAI Workshop on Expanding the Boundaries Hundreds of Millions of Multilingual COVID- of Health Informatics Using AI (HIAI), 2013. 19 Tweets with Location Information, IEEE Erra, U., Senatore, S., Minnella, F., and Caggianese, G.: Ap- Dataport, https://doi.org/10.21227/et8d-w881, proximate TF–IDF based on topic extraction from massive http://dx.doi.org/10.21227/et8d-w881, 2020. message stream using the GPU, Information Sciences, Pedregosa, F., Varoquaux, G., Gramfort, A., Michel, V., 292, 143 – 161, 2015. Thirion, B., Grisel, O., Blondel, M., Prettenhofer, P., Ferrara, E.: What types of COVID-19 conspira- Weiss, R., Dubourg, V., Vanderplas, J., Passos, A., Cour- cies are populated by Twitter bots?, First Mon- napeau, D., Brucher, M., Perrot, M., and Duchesnay, E.: day, https://doi.org/10.5210/fm.v25i6.10633, https: Scikit-learn: Machine Learning in Python, Journal of Ma- //journals.uic.edu/ojs/index.php/fm/article/view/10633, chine Learning Research, 12, 2825–2830, 2011. 2020. Salton, G., Wong, A., and Yang, C. S.: A vector space model Ho, S. Y., Tan, S., Sze, C. C., Wong, L., and Goh, for automatic indexing, Commun. ACM, 18, 613–620, W. W. B.: What can Venn diagrams teach us 1975. about doing data science better?, International Sanh, V., Debut, L., Chaumond, J., and Wolf, T.: DistilBERT, Journal of Data Science and Analytics, 11, 1– a distilled version of BERT: smaller, faster, cheaper and 10, https://doi.org/10.1007/s41060-020-00230-4, lighter, 2020. http://link.springer.com/10.1007/s41060-020-00230-4, Tsou, M.-H. and Leitner, M.: Visualization of social 2021. media: seeing a mirage or a message?, Cartogra- Jiang, J., Chen, E., Yan, S., Lerman, K., and Fer- phy and Geographic Information Science, 40, 55– rara, E.: Political polarization drives online con- 60, https://doi.org/10.1080/15230406.2013.776754, https: versations about COVID -19 in the United States, Human Behavior and Emerging Technologies, 2, 200–211, https://doi.org/10.1002/hbe2.202, https: //onlinelibrary.wiley.com/doi/abs/10.1002/hbe2.202, 2020. Le Sceller, Q., Karbab, E. B., Debbabi, M., and Iqbal, F.: SONAR: Automatic Detection of Cyber Secu- rity Events over the Twitter Stream, in: Proceed- ings of the 12th International Conference on Avail- ability, Reliability and Security, ARES ’17, Associa- tion for Computing Machinery, New York, NY, USA, https://doi.org/10.1145/3098954.3098992, https://doi.org/ 10.1145/3098954.3098992, 2017. Li, C., Sun, A., and Datta, A.: Twevent: Segment-Based Event Detection from Tweets, in: Proceedings of the 21st ACM International Conference on Information and Knowledge Management, CIKM ’12, p. 155–164, Asso- AGILE: GIScience Series, 2, 2, 2021 | https://doi.org/10.5194/agile-giss-2-2-2021 8 of 8
You can also read