Time efficient three dimensional transmural scar assessment provides relevant substrate characterization for ventricular tachycardia features and ...
←
→
Page content transcription
If your browser does not render page correctly, please read the page content below
www.nature.com/scientificreports

                OPEN              Time‑efficient three‑dimensional
                                  transmural scar assessment
                                  provides relevant substrate
                                  characterization for ventricular
                                  tachycardia features and long‑term
                                  recurrences in ischemic
                                  cardiomyopathy
                                  Susana Merino‑Caviedes1,14, Lilian K. Gutierrez2,14, José Manuel Alfonso‑Almazán2,
                                  Santiago Sanz‑Estébanez1, Lucilio Cordero‑Grande3,4, Jorge G. Quintanilla2,5,6,
                                  Javier Sánchez‑González7, Manuel Marina‑Breysse2,6, Carlos Galán‑Arriola2,6,
                                  Daniel Enríquez‑Vázquez2,5, Carlos Torres5, Gonzalo Pizarro2,6,8, Borja Ibáñez2,6,9,
                                  Rafael Peinado10, Jose Luis Merino10, Julián Pérez‑Villacastín5,6,11, José Jalife2,6,
                                  Mariña López‑Yunta12, Mariano Vázquez12,13, Jazmín Aguado‑Sierra12,
                                  Juan José González‑Ferrer5,6, Nicasio Pérez‑Castellano5,6,11, Marcos Martín‑Fernández1,
                                  Carlos Alberola‑López1* & David Filgueiras‑Rama2,5,6*

                                  Delayed gadolinium-enhanced cardiac magnetic resonance (LGE-CMR) imaging requires novel and
                                  time-efficient approaches to characterize the myocardial substrate associated with ventricular
                                  arrhythmia in patients with ischemic cardiomyopathy. Using a translational approach in pigs and
                                  patients with established myocardial infarction, we tested and validated a novel 3D methodology
                                  to assess ventricular scar using custom transmural criteria and a semiautomatic approach to obtain
                                  transmural scar maps in ventricular models reconstructed from both 3D-acquired and 3D-upsampled-
                                  2D-acquired LGE-CMR images. The results showed that 3D-upsampled models from 2D LGE-CMR
                                  images provided a time-efficient alternative to 3D-acquired sequences to assess the myocardial
                                  substrate associated with ischemic cardiomyopathy. Scar assessment from 2D-LGE-CMR sequences
                                  using 3D-upsampled models was superior to conventional 2D assessment to identify scar sizes
                                  associated with the cycle length of spontaneous ventricular tachycardia episodes and long-term
                                  ventricular tachycardia recurrences after catheter ablation. This novel methodology may represent an

                                  1
                                   University of Valladolid, Laboratorio de Procesado de Imagen, Valladolid, Spain. 2Centro Nacional de
                                  Investigaciones Cardiovasculares (CNIC), Myocardial Pathophysiology Area, Madrid, Spain. 3Universidad
                                  Politécnica de Madrid, Biomedical Image Technologies, ETSI Telecomunicación, Madrid, Spain. 4Centro de
                                  Investigación Biomédica en Red de Bioingeniería, Biomateriales y Nanomedicina (CIBER-BBN), Madrid,
                                  Spain. 5Instituto de Investigación Sanitaria del Hospital Clínico San Carlos (IdISSC), Cardiovascular Institute,
                                  Madrid, Spain. 6Centro de Investigación Biomédica en Red de Enfermedades Cardiovasculares (CIBERCV),
                                  Madrid, Spain. 7Philips Healthcare Iberia, Madrid, Spain. 8Hospital Ruber Juan Bravo Quironsalud UEM, Cardiology
                                  Department, Madrid, Spain. 9IIS‑University Hospital Fundación Jiménez Díaz, Cardiology Department, Madrid,
                                  Spain. 10Hospital Universitario La Paz, Cardiology Department, Madrid, Spain. 11Fundación Interhospitalaria
                                  para la Investigación Cardiovascular (FIC), Madrid, Spain. 12Barcelona Supercomputing Center (BSC), Barcelona,
                                  Spain. 13ELEM Biotech SL., Barcelona, Spain. 14These authors contributed equally: Susana Merino-Caviedes and
                                  Lilian K. Gutierrez. *email: caralb@tel.uva.es; david.filgueiras@cnic.es

Scientific Reports |   (2021) 11:18722               | https://doi.org/10.1038/s41598-021-97399-w                                               1

                                                                                                                                           Vol.:(0123456789)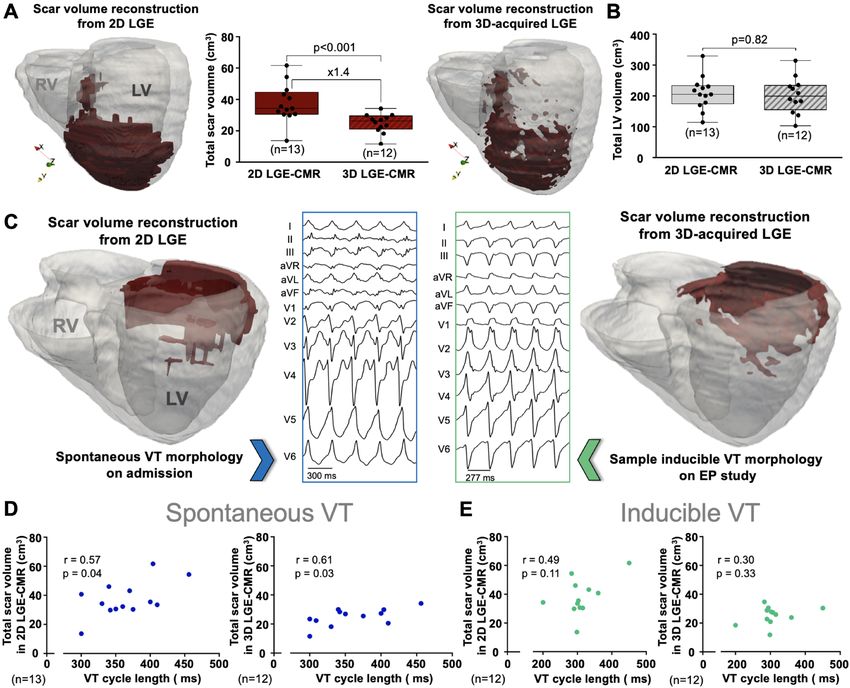
www.nature.com/scientificreports/
efficient approach in clinical practice after manual or automatic segmentation of myocardial borders in
a small number of conventional 2D LGE-CMR slices and automatic scar detection.
Delayed gadolinium-enhanced cardiac magnetic resonance (LGE-CMR) imaging represents a well-established
method to identify infarct-related scar tissue based on signal intensity criteria after gadolinium administration1.
Several studies have shown that scar tissue quantification using LGE-CMR may increase the predictive per-
formance of ventricular arrhythmic events in patients with established myocardial infarction2,3. Nonetheless,
scar characterization remains controversial and has not been incorporated as a standard stratification tool for
ventricular arrhythmic events or ventricular tachycardia (VT) characterization in patients with ischemic car-
diomyopathy (ICM)4.
Two-dimensional LGE-CMR sequences with large slice thickness (normally 8 mm) are the most common
images in the c linic5. Conversely, 3D sequences with higher and isotropic resolution are substantially less com-
mon in daily clinical practice, although frequently performed in research s tudies6. State-of-art 3D LGE-CMR
sequences require larger acquisition time, appropriate patient collaboration, and time-consuming manual or
semiautomatic processing for accurate myocardial s egmentation7. Altogether, these drawbacks make 3D LGE-
CMR sequences potentially inefficient in highly demanding agendas during regular clinical practice. The com-
mon alternative using 2D sequences provides sufficient information for assessing ventricular function. However,
2D-derived scar reconstructions may have limitations to properly assess the myocardial substrate compared to
isotropic high-resolution 3D data. Moreover, these differences might have implications on accurate characteriza-
tion of the ventricular substrate associated with VT episodes in patients with ICM.
Recently, we have developed a 3D methodology to assess ventricular scar using custom transmural criteria and
a semiautomatic approach to obtain transmural scar m aps8. This approach can be also implemented in upsampled
9
3D reconstructions obtained from conventional 2D LGE-CMR sequences. This methodology might provide an
intermediate and time-efficient approach to improve performance of 2D LGE-CMR sequences to characterize the
myocardial substrate particularly associated with clinical presentation of ICM-related VT episodes and potential
recurrences after ablation. This may be especially relevant in patients without primary prevention indication for
implantable cardioverter defibrillator (ICD).
We hypothesize that transmural scar assessment using 3D-upsampled data from 2D-LGE-CMR sequences
will be sufficient and superior to conventional analysis from 2D-LGE images to identify myocardial regions rel-
evant for infarct-related substrate characterization in patients with ICM and VT episodes. Patient-specific scar
reconstructions from isotropic 3D-acquired sequences were used as benchmark comparisons.
Methods
Study design. Experimental and clinical study including 10 pigs with established myocardial infarction
and 15 patients admitted to hospital with spontaneous VT episodes and underlying infarct-related ventricular
scar. All procedures in pigs were approved by the Centro Nacional de Investigaciones Cardiovasculares (CNIC)
Committee on Use and Care of Animals and by the Comunidad de Madrid (Ref#PROEX097/17). Animal
experiments comply with Spanish (RD53/2013, ECC/566/2015), European (2010/63/EU) and Animal Research:
Reporting of In Vivo Experiments (ARRIVE) guidelines. The ethical committees of the Hospital Clínico San
Carlos and Hospital Universitario La Paz approved the protocol in patients (Ref#14/246-E_BC and #PI-1464,
respectively). The study in patients was performed in accordance with the standards of the 2013 revision of
the Declaration of Helsinki. Patients were prospectively included from two tertiary hospitals from May 2013
to December 2016. All patients signed the informed consent before inclusion in the study. Pigs underwent 3D
LGE-CMR sequences to test and optimize the performance of a 3D transmural-based methodology that takes
into account individual-specific myocardial g eometry8. The validation and clinical impact of the method were
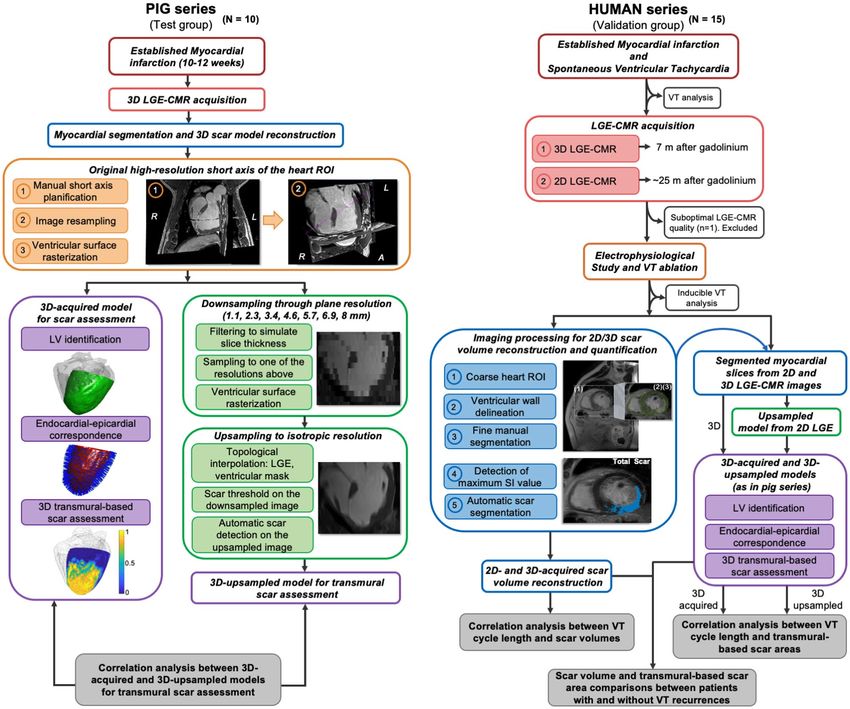
tested in the patients’ cohort undergoing 3D and 2D LGE-CMR studies within the same protocol. Figure 1 shows
the study flowchart. The data that support the findings of this study are available from the corresponding authors
upon reasonable request.
Pig model of myocardial infarction. Pigs (male, large-white strain, ~ 35 kg) underwent percutaneous
catheterization of the left anterior descending coronary artery using femoral access and fluoroscopic guidance
under general anesthesia. An angioplasty balloon was inflated in the coronary artery for 60 min to generate myo-
cardial infarction. Then, the balloon was deflated and a coronary angiogram was recorded to confirm patency of
the coronary artery and reperfusion as described elsewhere (see also Supplementary Information)7.
Magnetic resonance studies. Ten-to-twelve weeks after myocardial infarction pigs underwent sub-
strate characterization using a Philips Achieva 3T-Tx whole-body scanner equipped with a 32-element and
phased-array cardiac coil (Philips Healthcare, Best, The Netherlands). Seven minutes after intravenous contrast
injection (0.2 mM/kg. Dotarem, Guerbet) 3D LGE-CMR sequences were acquired using an inversion-recov-
ery spoiled turbo field echo (IR-T1TFE) with isotropic resolution of 1.5 × 1.5 × 1.5 mm (reconstruction resolu-
tion 0.57 × 0.57 × 0.75 mm). Segmented and ECG-gated cine steady-state free precession was also performed
to acquire 11–13 contiguous short-axis slices covering the ventricles from the base to the apex to evaluate left
ventricular ejection fraction (LVEF) (field of view of 280 × 280 mm; slice thickness of 6 mm without gap; repeti-
tion time-TR-2.8 ms; echo time-TE-1.4 ms, flip angle 45; cardiac phases 25; voxel size 1.8 × 1.8 mm; 3 number
of excitations).
CMR scans in patients were performed 24-to-48 h prior to invasive electrophysiological procedures for VT
mapping and ablation. LVEF was assessed by multiphase-multislice acquisition with a balanced TFE sequence
Scientific Reports | (2021) 11:18722 | https://doi.org/10.1038/s41598-021-97399-w 2
Vol:.(1234567890)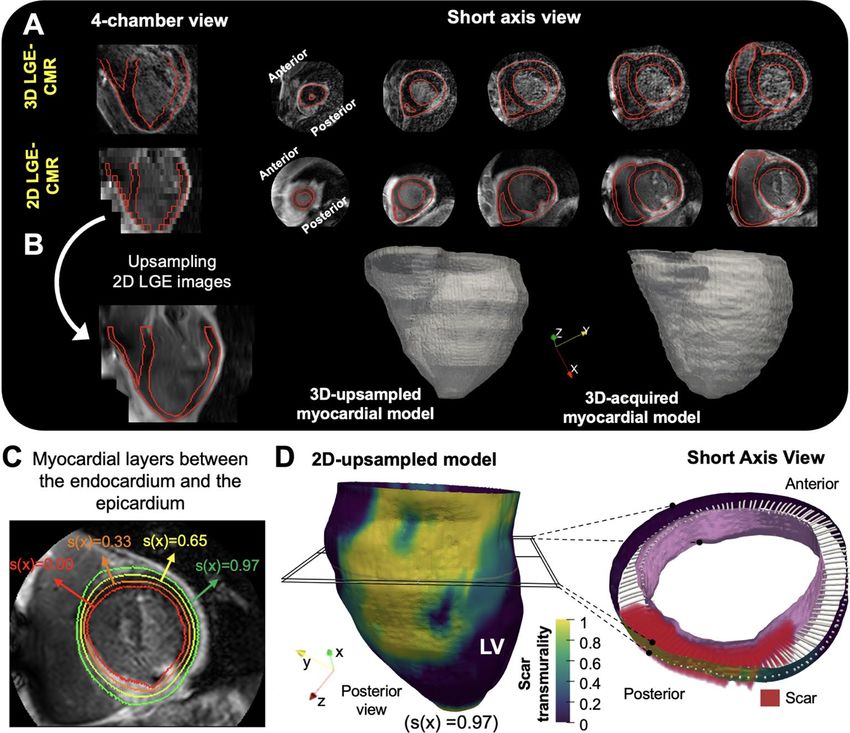
www.nature.com/scientificreports/
Figure 1. Study flowchart. LGE-CMR: late gadolinium-enhanced cardiac magnetic resonance, ROI: region of
interest, SI: signal intensity, VT: ventricular tachycardia.
(1.8 × 1.8 × 8.0 mm). Three-dimensional LGE-CMR sequences (acquisition resolution 1.5 × 1.5 × 1.5 mm, recon-
struction resolution: 0.70 × 0.70 × 0.75 mm) were obtained based on IR-TFE, seven minutes after intravenous
contrast administration. The entire sequence was triggered with a respiratory navigator to compensate for
minor volume displacements. The multislice IR-TFE delayed-enhanced 2D sequences (acquisition resolution
1.5 × 1.5 × 8.0 mm, reconstruction resolution: 0.59 × 0.59 × 8.0 mm) were acquired after completion of the 3D
sequence. Good scar definition was ensured using a Look-Locker sequence before each acquisition and phase
sensitive reconstruction for 3D acquisitions to select correct inversion time for proper healthy myocardium
signal nulling.
Three‑dimensional scar volume reconstruction. LGE-CMR sequences, in both pigs and patients,
were carefully segmented using a semi-automatic approach with custom-made software in Matlab (Mathworks
Inc, Natick, US). First, we obtained a region of interest, which roughly contained the heart and minimized sur-
rounding tissue from other intrathoracic structures. Second, we automatically delineated the endocardial and
epicardial contours using an automatic algorithm with an active contour method. Third, this initial myocardial
segmentation was subsequently complemented with fine manual segmentation by one single operator and fur-
ther reviewed by a second expert operator (Fig. 2A,B). This approach, although time-consuming on 3D-acquired
sequences (~ 8–12 h) for further implementation in clinical practice, was used as a benchmark reference for
highly accurate patient-specific scar volume reconstructions. Finally, scar segmentation was performed using
a full-width-half-maximum method1. In patients, maximum signal intensity in 3D isotropic acquisitions was
calculated using a slice thickness of ≈ 8-mm (i.e. average of 12 neighbouring voxels in the through-plane direc-
tion) to prevent any potential signal-to-noise effect from smaller pixel sizes compared to calculations in lower
resolution 2D sequences (Supplementary Fig. 1). Scar threshold criterion was set at 0.45 of the maximum signal
intensity based on our previous data using high resolution in vivo and ex vivo c omparisons7. Representative
Scientific Reports | (2021) 11:18722 | https://doi.org/10.1038/s41598-021-97399-w 3
Vol.:(0123456789)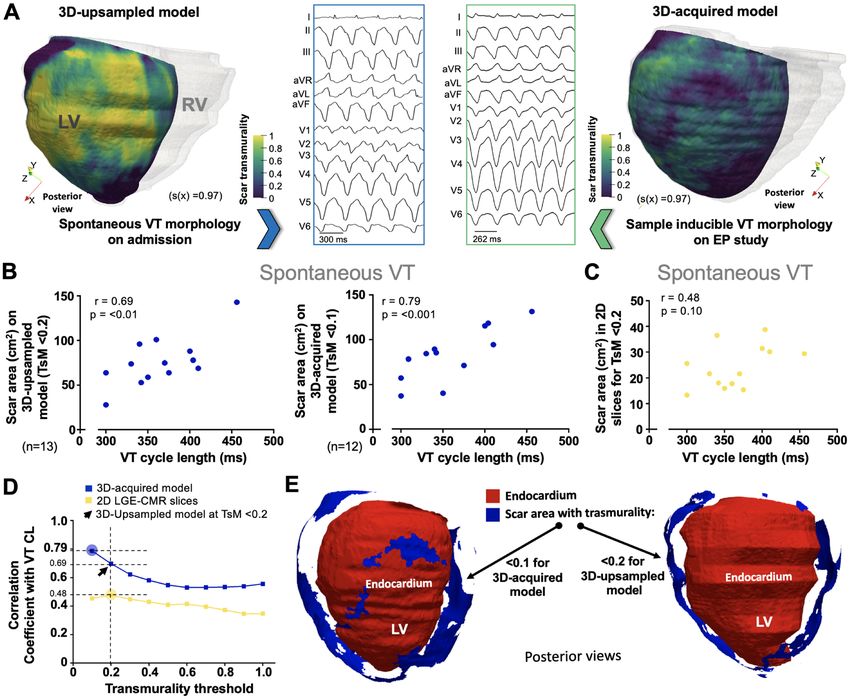
www.nature.com/scientificreports/
Figure 2. Myocardial segmentation and generation of patient-specific scar-volume reconstructions in 3D
models. (A,B) Identification and segmentation of the endocardium and epicardium of 2D (A) and 3D (B) LGE-
CMR sequences from the same patient after initial automatic processing and fine manual segmentation. (C)
Representative 3D models with scar volume reconstructions obtained from 2D and 3D LGE-CMR sequences in
(A), (B). Acquisition shifts in 2D slices were corrected using the contours of the 3D-acquired shell.
3D scar-volume reconstructions are shown in Fig. 2C. Further details can be found in the Supplementary
Information.
Three‑dimensional transmural‑based scar assessment. In pigs, 3D LGE-CMR images in the coronal
plane were first reoriented in the short axis using 3D Slicer (Slicer 4.10.2) and then reconstructed with different
slice thicknesses. For each slice thickness reconstruction, scar segmentations were created by averaging the high-
resolution 3D scar segmentations to the new reconstructed slice thickness (Fig. 1). Downsampled images in pigs
or 2D LGE-CMR images in patients, together with their associated myocardial segmentations, were upsampled
to the 3D isotropic resolution using a topologic interpolation algorithm (Fig. 3A,B) as described elsewhere9.
Three-dimensional transmurality maps of the left ventricle (i.e., the ratio of myocardial wall thickness covered
by scar) were represented on the epicardial surface and computed as reported elsewhere8. This method also pro-
vides point-wise correspondences between the endocardium and the epicardium (as other authors have done in
the past)10–13 by finding a function s(x) for which s(x) = 0 at the endocardium, s(x) = 1 at the epicardium, and its
intermediate values which define different myocardial layers (Fig. 3C). Transmural-based scar assessment was
performed using different transmurality thresholds (0.1, 0.2, etc.) to quantify scar areas (Fig. 3D). Execution
times for transmural scar assessment, including point-wise correspondences between the endocardium and the
epicardium took on the order of 7 min with unoptimized Matlab code. See Supplementary Methods and Sup-
plementary Figs. 2–4 for further details.
Mapping and ablation procedure. The invasive electrophysiology study was performed using percuta-
neous venous and arterial femoral access to reach the right and left ventricles, respectively. Additional epicar-
dial access, if necessary, was achieved using a percutaneous subxiphoid approach. Ventricular geometries were
generated using the Carto3 (Biosense Webster, Diamond Bar, CA) or the Ensite NavX (Abbott, St. Paul, MN)
electroanatomic mapping system. VT induction was attempted using programmed ventricular stimulation from
Scientific Reports | (2021) 11:18722 | https://doi.org/10.1038/s41598-021-97399-w 4
Vol:.(1234567890)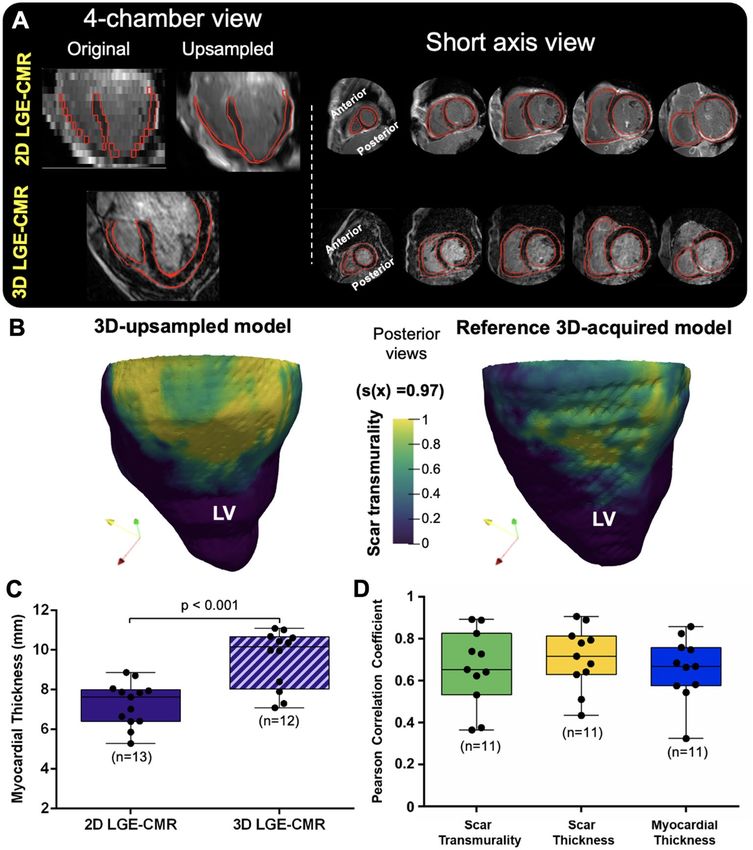
www.nature.com/scientificreports/
Figure 3. Three-dimensional transmural-based scar assessment. (A) Long-axis and short-axis views of 2D and
3D LGE-CMR images from the same patient. (B) Resolution upsampling from 2D images and representative
3D-upsampled and 3D-acquired myocardial models. (C) Wall segmentation for scar transmurality analysis at
different layers. (D) Representative transmurality map from a 3D-upsampled model with a short axis view at
high-magnification to illustrate the 3D methodology for transmural-based scar assessment. LV: left ventricle.
the right ventricular apex. All stimuli were synchronized with the intrinsic QRS complex. The protocol consisted
of two sequential basic drive cycle lengths (CLs) of 10 beats each (S1) at 600 or 400 ms. Each basic drive CL
was followed by up to 3 extrastimuli (S2, S3, S4) decremented in CL until reaching refractoriness or a mini-
mum coupling interval of 200 ms. If the arising VT was hemodynamically stable, activation maps and entrain-
ment maneuvers were performed with the ablation catheter or a 20-pole steerable mapping catheter (Pentaray,
Biosense Webster) to localize the protected isthmus of the reentrant circuit. Ablation was performed with an
open-irrigated-tip catheter (Navistar Thermocool, Biosense Webster or FlexAbility, Abbott). Direct current defi-
brillation was delivered to restore sinus rhythm in case of ventricular fibrillation or hemodynamic collapse. In
the case of hemodynamic instability during mapping of VT morphologies documented on admission (i.e. spon-
taneous clinical VT), deductive reconstruction of the reentrant circuit and ablation was performed using pace-
mapping as described by de Chillou et al.14. Hemodynamically instable VT morphologies only documented
during the electrophysiological study (non-clinical VTs) were targeted using substrate ablation based on late and
fragmented potentials. Local abnormal ventricular activities (LAVA) were not specifically ablated15. However,
during data analysis, LAVA quantification was performed to further describe the electrophysiological substrate
specially in the regions with higher density mapping during baseline sinus rhythm.
Clinical follow‑up and analysis of spontaneous and inducible ventricular tachycardia epi-
sodes. Ventricular tachycardia CL was measured on VT tracings documented at the time of hospital admis-
sion before attempting pharmacological or electrical cardioversion. The number of induced VT morphologies
and the CL of each morphology were quantified for each patient. Twelve out of 15 patients underwent implant-
able cardioverter defibrillator (ICD) implantation before hospital discharge. Patients underwent annual clinical
follow-up to detect VT recurrences of any morphology after new hospital admissions or any sustained VT (epi-
sode duration > 30 s or terminated by the ICD) detected on the ICD.
Statistical analysis. Data are expressed as median and interquartile range for quantitative variables, and
number and percentage for qualitative variables. Data normality was assessed with the Shapiro–Wilk test. The
Mann–Whitney U test was used for two-group comparisons. The Pearson’s correlation coefficient (r) was used
Scientific Reports | (2021) 11:18722 | https://doi.org/10.1038/s41598-021-97399-w 5
Vol.:(0123456789)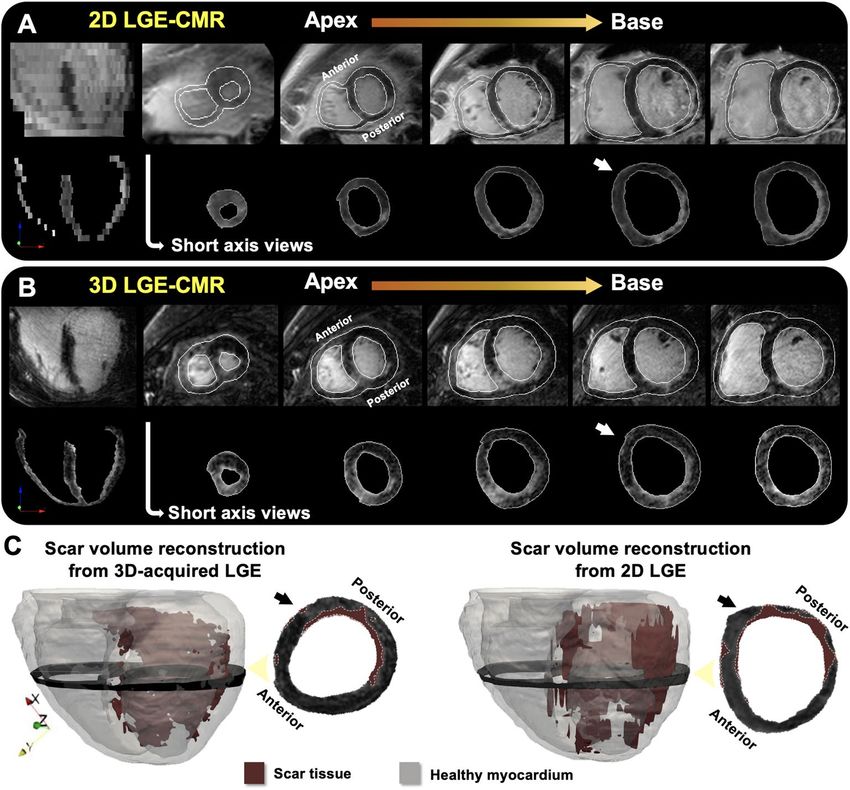
www.nature.com/scientificreports/
Pigs (N = 10) Patients (N = 14)
Baseline characteristics
Male, n (%) 10 (100.0) 12 (85.7)
Age, pigs (months) patients (years) 5.0 (4.7, 5.4) 69.3 (65.7, 73.0)
Weight (kg) 54.7 (53.0, 60.8) 78.8 (66.6, 85.5)
LVEF (%) 34.7 (32.0, 40.2) 40.0 (34.8, 42.3)
Hypertension, n (%) – 13 (92.8)
Diabetes, n (%) – 2 (14.3)
Smoking –
Current smoker, n (%) 2 (14.3)
Former smoker, n (%) 8 (57.1)
Dyslipidemia, n (%) – 12 (85.7)
Medical treatment
ACEis/ARBs, n (%) – 12 (85.7)
β-Blockers, n (%) – 14 (100)
Antiarrhythmic drugs, n (%) – 0 (0)
Antiaggregation, n (%) – 11 (78.6)
Oral anticoagulation, n (%) – 5 (35.7)
MRAs, n (%) – 2 (14.3)
Statins, n (%) – 13 (92.8)
LGE-CMR sequences 3D LGE-CMR (n = 10) 3D LGE-CMR (n = 12) 2D LGE-CMR (n = 13)
LGE sequence, n (%) 10 (100.0) 12 (85.7) 13 (92.8)
Acquisition resolution (mm3) 1.5 × 1.5 × 1.5 1.5 × 1.5 × 1.5 1.5 × 1.5 × 8.0
Reconstruction resolution (mm3) 0.57 × 0.57 × 0.75 0.70 × 0.70 × 0.75 0.59 × 0.59 × 8.0
Acquisition time (min) 12.0 (11.25, 13.75) 22.0 (16.0, 27.5) 7.0 (6.25, 7.75)
Myocardial/scar volume quantification (cm3)
Total myocardial volume 105.8 (98.7, 122.6) 199.5 (172.2, 232.0) 205.2 (178.5, 230.8)
Healthy myocardial volume 85.9 (79.5, 92.6) 174.1 (146.8, 201.9) 174.4 (144.9, 190.0)
Heterogeneous scar volume 17.4 (14.0, 22.9) 17.7 (15.5, 19.2) 23.5 (19.5, 26.6)
Dense volume 5.4 (3.9, 7.8) 8.2 (6.1, 9.2) 14.3 (9.3, 17.7)
Total scar volume 23.3 (17.6, 30.9) 26.3 (22.0, 28.8) 34.4 (30.7, 43.2)
Electrophysiological data
Spontaneous VT cycle length (ms) – 355.0 (332.5, 393.7)
Inducible VT cycle length (ms) – 300.0 (290.0, 338.0)
Inducible VT morphologies (n) – 2.0 (1.0, 2.8)
LAVA/total mapping points (n) – 149 (96, 250)/359 (198, 656)
LAVA (%) – 41.0 (34.5, 43.5%)
Table 1. Baseline patient and animal characteristics. Values are expressed as median and interquartile ranges
or n (%), as appropriate. ACEis: angiotensin converting enzyme inhibitors, ARBs: angiotensin II receptor
blockers, LAVA: local abnormal ventricular activities, LGE-CMR: delayed gadolinium-enhancement cardiac
magnetic resonance, LVEF: left ventricular ejection fraction, MRAs: mineralocorticoid receptor antagonists,
VT: ventricular tachycardia.
for correlation analysis between scar volumes or transmural-based scar areas and VT CLs. A p < 0.05 was con-
sidered statistically significant for differences in group comparisons and for a non-null Pearson correlation coef-
ficient. The intraclass correlation coefficient was also used as a measure of concordance (ICC 2.1 version). All
data were analyzed in Graphpad Prism6 (California, US) and custom-made software in Matlab.
Results
Baseline patient and animal characteristics are shown in Table 1. One patient was excluded due to low CMR
imaging quality on both the 3D and 2D sequences. Patients (age 69.3 [65.7, 73.0] years old) showed a median of
16 (12.2, 23.2) years from the infarction to hospital admission. None of the patients had previous history of ven-
tricular arrhythmic events, the LVEF was 40.0% (34.8, 42.3%) and 13 out of 14 patients were in NYHA functional
class I. In 11 patients, it was possible to acquire sequential 3D and 2D LGE-CMR images within the same study.
In the remaining 3 patients, one patient refused the 2D acquisition after the 3D CMR study and in the other 2
patients, 3D sequences required long acquisition times (> 30 min) which provided suboptimal imaging quality.
Three‑dimensional‑upsampled models showed significant correlation with the 3D‑acquired
reference. The maximum downsampling factor used for LGE-CMR 3D sequences in pigs reached 8.0 mm
Scientific Reports | (2021) 11:18722 | https://doi.org/10.1038/s41598-021-97399-w 6
Vol:.(1234567890)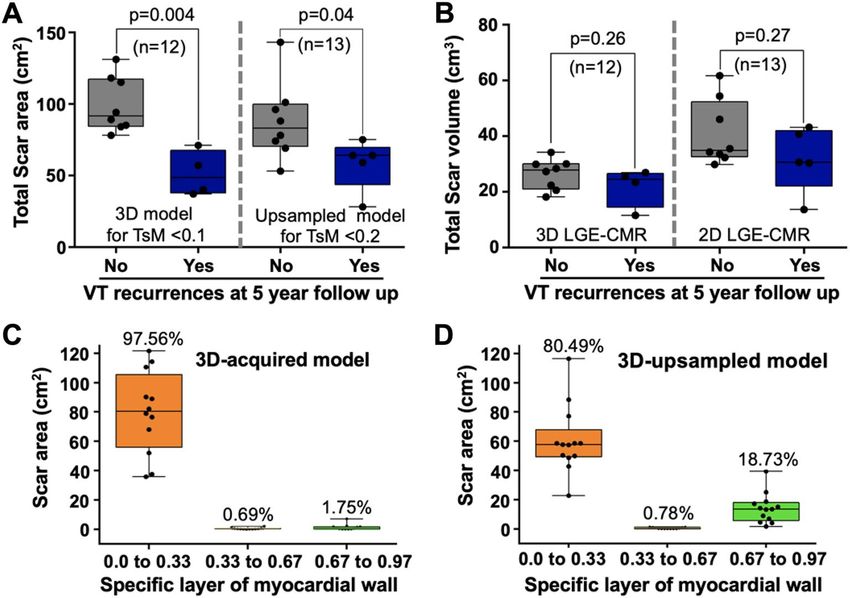
www.nature.com/scientificreports/

                                  Figure 4.  Three-dimensional transmural scar assessment in patients. (A) Long axis view of representative 3D
                                  and 2D LGE-CMR images from the same patient. (B) Sample scar transmurality maps from the 3D and 2D
                                  LGE-CMR images showed in (A). (C) Myocardial thickness comparison between 2D and 3D LGE-CMR images.
                                  (D) Pearson correlation coefficients of scar transmurality, scar thickness and myocardial thickness between
                                  3D-acquired and 3D-upsampled models in patients. LV: left ventricle.

                                  slice thickness on the longitudinal ventricular axis (Supplementary Fig. 5A,B). Quantification of 3D surface
                                  distortion showed a maximum distance of 0.16 (0.16, 0.17) mm between the 3D-upsampled model using 8-mm
                                  slice thickness and the 3D-acquired reference (Supplementary Fig. 5C). Automatic 3D scar transmurality quan-
                                  tification showed ICC > 0.94 between both (Supplementary Fig. 5D).
                                       Results in pigs motivated the validation of the methodology using 3D-upsampled models from 2D LGE-
                                  CMR images in the clinic (n = 11, Fig. 4A,B). This analysis showed a myocardial distortion of 1.57 (1.46, 2.33)
                                  mm from the reference 3D-acquired model. This increase with respect to pigs was mostly explained by different
                                  myocardial wall thicknesses in 3D (10.37 [8.03, 10.67] mm) and 2D sequences (7.63 [6.40, 8.02] mm) (Fig. 4C).
                                  The Pearson correlation coefficient between transmurality values in 3D-acquired and 3D upsampled 2D-derived
                                  models was 0.65 (0.56, 0.81) (Fig. 4D). Analyzing scar and myocardial thickness values separately, the Pearson
                                  correlation coefficients were 0.72 (0.63, 0.81) and 0.67 (0.58, 0.76), respectively (Fig. 4D).

                                  Scar volume quantification showed direct correlation with the cycle length of spontaneous VT
                                  episodes. Scar volume quantification from the original 2D LGE-CMR sequences showed larger scar vol-
                                  umes than those from 3D-acquired LGE reconstructions (Table 1, Fig. 5A). Conversely, left ventricular wall vol-
                                  ume (including myocardium and scar) was not significantly different between 2D- and 3D-acquired ventricular
                                  reconstructions (Fig. 5B). Data from one representative patient who underwent sequential 3D–2D–3D CMR-

Scientific Reports |   (2021) 11:18722 |              https://doi.org/10.1038/s41598-021-97399-w                                               7

                                                                                                                                          Vol.:(0123456789)
www.nature.com/scientificreports/
Figure 5. Patient-specific scar volume reconstruction and correlation analysis with the cycle length
of ventricular tachycardia episodes. (A) Scar volume comparisons between 3D- and 2D-LGE-CMR
reconstructions. (B) Left ventricular (LV) myocardial volume comparisons between 3D- and 2D-LGE-CMR
reconstructions. (C) Representative case of 2D- and 3D-LGE-CMR scar reconstructions and the associated
ventricular tachycardia (VT) episodes on admission and during the electrophysiological (EP) study. (D,E)
correlation analysis between the cycle length of spontaneous (D) /inducible (E) VT episodes and scar volumes
from 3D (D) and 2D-LGE-CMR (E) reconstructions. RV: right ventricle.
LGE acquisitions further supported larger scar volume from 2D images compared to scar volumes obtained
from any of the 3D acquisitions (Supplementary Fig. 6).
Both 2D- and 3D-acquired scar volume reconstructions (see representative examples in Fig. 5C) showed
statistically significant correlation with the CL of spontaneous VT episodes documented at the time of hospi-
tal admission (r = 0.57; p = 0.04 and r = 0.61; p = 0.03, respectively. Figure 5D). The larger the scar volume, the
slower was the CL of the spontaneous VT episode. More specific analysis using a double cutoff criterion at 0.45
and 0.67 of the maximum signal intensity (for heterogeneous and dense scar characterization, respectively)7,
showed higher correlation coefficients using 3D-acquired heterogeneous scar volumes (r = 0.72; p = 0.01. Sup-
plementary Fig. 7A). Conversely, dense scar volumes did not show any statistically significant correlation with
spontaneous VT CLs (Supplementary Fig. 7B). The median CL of inducible VT episodes per patient did not show
statistically significant correlation with 2D- or 3D-acquired total scar volumes (Fig. 5E).
Transmural‑based scar assessment in 3D‑upsampled models is sufficient to identify scar
regions associated with the cycle length of spontaneous VT episodes. Scar area quantification
in myocardial regions with 3D transmurality < 0.2 for 3D-upsampled and < 0.1 for 3D-acquired models showed
significant correlation with the CL of spontaneous VT episodes (r = 0.69; p < 0.01 and r = 0.79; p < 0.01, respec-
tively. Figure 6A,B). The correlation value using transmural scar areas from 3D-upsampled models was higher
than the one obtained from scar volume reconstructions from 3D-acquired images (Figs. 6B, 5D, respectively).
The transmurality threshold in 3D-upsampled models was selected using the highest correlation coefficient in
the original 2D LGE-CMR slices (Fig. 6C,D). In fact, scar areas from 3D-upsampled models showed higher cor-
Scientific Reports | (2021) 11:18722 | https://doi.org/10.1038/s41598-021-97399-w 8
Vol:.(1234567890)www.nature.com/scientificreports/
Figure 6. Correlation analysis of transmural scar assessment with the cycle length of ventricular tachycardia
episodes. (A) Representative 3D-acquired and 3D-upsampled models with transmurality (TsM) maps and
the associated ventricular tachycardia (VT) episodes on admission and during the electrophysiological (EP)
study. (B,C) Correlation analysis between the cycle length (CL) of spontaneous VT episodes and scar areas
for wall transmurality < 0.2 (for 3D-upsampled models), < 0.1 (for 3D-acquired models) and < 0.2 [for original
2D LGE-CMR slices, in (C)]. (D) Pearson correlation coefficients between scar assessment at sequential TsM
thresholds and the CL of spontaneous VT episodes. (E) 3D visualization of scar areas (in blue) using < 0.2 (for
3D-upsampled models) and < 0.1 (for 3D-acquired models) transmurality criteria in the sample case shown in
(A).
relation coefficients with spontaneous VT CL episodes than values obtained from conventional 2D transmural
scar assessment on the original 2D LGE images (r = 0.48; p = 0.10) using the same transmurality threshold (< 0.2,
Fig. 6C). A representative sample case of 3D visualization of scar areas using < 0.2 (for 3D-upsampled models)
and < 0.1 (for 3D-acquired models) transmurality criteria is shown in Fig. 6E. Similar to correlation analysis
using scar volume reconstructions (Fig. 5E), the median CL of inducible VT episodes per patient did not show
statistically significant correlation with 3D transmural-based scar assessment (Supplementary Fig. 8).
Transmural‑based scar assessment identifies myocardial substrates associated with long‑term
VT recurrences after ablation. Entrainment maneuvers and pace mapping were performed in 6 and 8
patients, respectively, to target and ablate the myocardial substrate associated with clinical VT morphologies.
This and further substrate ablation to eliminate other inducible VT morphologies showed that most of radi-
ofrequency lesions (75 [71, 81] %) were delivered in LAVA regions, although complete LAVA elimination was
not pursued in any of the cases. The total ablation time during the procedure was 15.8 (10.1, 17.8) min. Non-
inducibility of clinical VT morphologies was achieved in 13 out of 14 cases. In 3 patients, other non-clinical
and non-mappable morphologies remained inducible on programmed ventricular stimulation after ablation.
Epicardial mapping was only attempted in one patient, although severe pericardial adherences did not enable
further mapping of the region of interest and radiofrequency energy was only delivered from the endocardium.
At 5 years of follow-up VT recurrences of any morphology were documented in 5 out of 15 patients. Four
patients were under class III antiarrhythmic drugs at the end of the follow-up. Patients with VT recurrences
showed lower scar areas on 3D-acquired and 3D-upsampled models using < 0.1 and < 0.2 transmurality criteria,
Scientific Reports | (2021) 11:18722 | https://doi.org/10.1038/s41598-021-97399-w 9
Vol.:(0123456789)www.nature.com/scientificreports/
Figure 7. Clinical value of transmural scar assessment in ventricular tachycardia recurrences after long-term
follow up. (A) Scar areas quantification on 3D-acquired (left) and 3D-upsampled (right) models using < 0.1
and < 0.2 transmurality criteria, respectively, in patients with and without ventricular tachycardia (VT)
recurrences. (B) Scar volumes quantification from 3D-acquired and 2D LGE-CMR sequences in patients with
and without VT recurrences. (C,D) Scar tissue quantification in the regions with 3D transmurality < 0.1 (for
3D-acquired models) (C) and < 0.2 (for 3D-upsampled models) (D).
respectively, than patients without VT recurrences (48.5 [37.7, 67.5] vs. 91.5 [84.3, 117.3] cm2, respectively, for
3D-acquired models; p = 0.004, and 64.0 [43.5, 69.5] vs. 83.0 [70.2, 99.7] c m2, respectively, for 3D-upsampled
models; p = 0.04, Fig. 7A). Conversely, scar volume reconstructions from the original images did not reach
statistically significant differences between patients with and without VT recurrences (24.5 [14.6, 26.6] vs. 27.9
[21.1, 30.1] cm3, respectively, for 3D-acquired LGE-CMR; p = 0.26, and 30.7 [22.1, 42.1] vs. 35.0 [32.7, 52.4] cm3,
respectively, for 2D LGE-CMR; p = 0.27, Fig. 7B).
Further analysis establishing boundaries in the myocardial wall depth at 0.33, 0.67 and 0.97 of the myocar-
dial thickness showed that the majority of scar tissue in the regions with 3D transmurality < 0.1 (for 3D-acquired
models) and < 0.2 (for 3D-upsampled models) was located in the endocardial layer (97.56% and 80.49%, respec-
tively, Fig. 7C,D and Supplementary Figs. 9, 10).
Discussion
This study shows that semiautomatic transmural scar assessment on 3D models from both 3D-upsampled and
3D-acquired LGE-CMR sequences provide clinically relevant scar characterization in patients with established
myocardial infarction. The CL of spontaneous VT episodes significantly correlated with transmural scar values
mainly reflecting endocardial scar. Moreover, patients with VT recurrences after a long-term follow-up showed
significantly lower scar areas on 3D-upsampled and 3D-acquired models compared with patients without recur-
rences. Conversely, scar volume quantifications did not reach statistically significant differences between patients
with and without VT recurrences. The latter reflects the relevance of endocardial scar assessment rather than the
entire scar volume in ICM-related VT episodes. In fact, transmurality criteria at < 0.1 (for 3D-acquired models)
and < 0.2 (for 3D-upsampled models), mainly reflected endocardial scar (Fig. 7C,D). Hence, the methodology we
propose in this paper may represent an efficient approach in clinical practice after segmentation of myocardial
borders and automatic scar detection. Manual accurate segmentation in a small number (≈ 12) of conventional
2D LGE-CMR slices can be performed in less than 15 min by expert operators. However, reliable novel software
tools and machine learning algorithms will be a time-efficient alternative for the initial segmentation s tep16.
Several studies have shown that scar tissue quantification using LGE-CMR images may represent an independ-
ent predictor of ventricular arrhythmic events after myocardial infarction3,17. However, CMR-based scar char-
acterization and quantification to predict ventricular arrhythmic events or VT features remains c ontroversial18.
Moreover, these associations have not been consistent across s tudies19,20. Imaging resolution, myocardial and
scar segmentation, and partial volume averaging represent important factors that may explain the lack of uni-
form results and variable scar identification criteria among series21,22. Partial volume averaging may also explain
the differences we documented in myocardial wall thickness using 2D and 3D LGE-CMR images. Larger scar
Scientific Reports | (2021) 11:18722 | https://doi.org/10.1038/s41598-021-97399-w 10
Vol:.(1234567890)www.nature.com/scientificreports/
extension is expected to be present in lower resolution i mages7,21, which might substantially affect the predictive
performance of scar assessment from LGE-CMR sequences. In fact, our results are consistent with larger scar
volumes in patient-specific 3D models obtained from 2D LGE-CMR sequences compared to those from 3D
LGE-CMR studies (Fig. 5A). This may explain higher correlation coefficients between the CL of spontaneous
VT episodes and scar volumes obtained from higher-resolution 3D-acquired sequences. However, 3D sequences
require larger acquisition times compared to 2D sequences (Table 1) and time-consuming reliable segmentation
on sequences with > 100 slices, which directly affect regular implementation in clinical practice. The proposed
methodology based on 3D transmural scar assessment, using a < 0.2 transmurality threshold in 3D-upsampled
models from conventional 2D LGE-CMR sequences, may help to overcome these limitations since scar areas
provided higher correlation coefficients with the CL of spontaneous VT episodes than reconstructed scar volumes
from 3D-acquired LGE sequences. This highlights that the transmural-based approach was able to identify scar
regions relevant for ICM-related spontaneous VT episodes. In other myocardial substrates with less relevance
of endocardial scars, 3D transmural-based scar assessment would also permit quantifying scar using different
myocardial layer criteria.
A relevant limitation for further implementation of CMR-LGE sequences as a standard stratification tool in
the clinic is the of lack of consensus on a uniform scar evaluation criterion and signal intensity thresholding for
scar tissue6,23, which varies among series and makes substrate characterization particularly sensitive to sampling
bias. This requires additional efforts among the scientific community to reach a more general agreement on scar
identification. Here, we used a single signal intensity threshold value to simplify scar tissue differentiation from
healthy myocardium. We chose a scar cutoff at 0.45 of the maximum signal intensity based on previous analyses
in animal models reporting that below such threshold, in high-resolution postcontrast CMR images, remote
myocardial areas started to show false positive scar detection7. Although mild fibrotic remodeling may also be
present in remote ventricular regions, outside the infarcted region, using a 0.45 criterion on signal intensity we
documented that this remote scar was ≤ 1% of the remote myocardium, which is consistent with histopathologi-
cal data reported in animal models with myocardial infarction24. Our results further support that a single 0.45
criterion on signal intensity may be a good reference cutoff for substrate characterization in patients.
Our data provide new insights into the role of scar characterization in clinical presentation and long-term
follow-up of patients with infarct-related VT episodes undergoing catheter-based ablation, especially in patients
without primary ICD indication (14 out of 15 patients in this series). Lower scar areas in patients with VT recur-
rences at 5 years of follow-up might reflect more viable myocytes within scar r egions25, which settles a heterogene-
ous substrate with areas of potentially slow conduction leading to reentrant ventricular arrhythmias. Two small
series by Woie et al.26 and Alexandre et al.17 have previously shown that the number of scar islands and scar size,
respectively, were associated with the mean CL of VT episodes recorded by ICDs over a segment of 12-to-13
VT intervals from the first non-sustained or sustained monomorphic VT morphology. These short recording
periods for analysis have limitations to extrapolate results to longer duration VT episodes or clinically relevant
spontaneous episodes admitted to the emergency department. Our current prospective series including patients
admitted to hospital with spontaneous VT, without neither previous documented episodes nor ICD, supports the
role of LGE-CMR imaging to identify relevant myocardial regions and potentially predict VT features in patients
with established myocardial infarction. The results are also consistent with other series suggesting that scar
extension is not associated with the mean CL of inducible VT episodes during an electrophysiological s tudy27.
Similar results were reported in a previous study using a pig model with established myocardial infarction, in
which we did not document any statistically significant correlation between total, heterogeneous or dense scar
volumes with the median CL of inducible VT episodes after programmed ventricular s timulation25. Altogether
these results highlight that other factors, beyond the underlying substrate, may be involved in inducible VT
episodes (e.g. functional and unstable re-entrant circuits, stimulation site, etc.).
Limitations. Time-to-imaging acquisition after gadolinium administration was not the same for 3D and 2D
LGE-CMR acquisitions. However, in both sequences scar identification was performed using the same spatial
resolution and signal intensity criterion. Scar volume results were also consistent with previous data reporting
the implications of imaging resolution and partial volume effects on scar a ssessment7,21. Data from one repre-
sentative patient undergoing sequential 3D-2D-3D LGE-CMR acquisitions also supported the notion that lower
resolution images show larger scar regions (Supplementary Fig. 6).
Clinical implications of transmural scar assessment in spontaneous VT features were only studied in patients
with established myocardial infarction. Other ventricular events as ventricular fibrillation and polymorphic VT
episodes have not been studied in this series, which mainly included patients with mild to moderate decrease
in LVEF, without ICD at the time of hospital a dmission4. New data from currently ongoing trials (e.g. CMR-
GUIDE trial; NCT01918215) will provide more insight into this specific question. Statistical association of scar
areas derived from transmurality analysis with VT recurrences might have been affected by individual specific
substrate modification during the ablation procedure. Further series are warranted to confirm these descriptive
results in relatively limited ablation strategies without extensive scar homogenization.
Conclusion
Three-dimensional transmural scar assessment in ventricular models reconstructed from 3D-upsampled or
3D-acquired LGE sequences may provide relevant scar characterization for clinical presentation and long-term
ablation outcomes in patients with infarct-related spontaneous VT episodes.
Scientific Reports | (2021) 11:18722 | https://doi.org/10.1038/s41598-021-97399-w 11
Vol.:(0123456789)www.nature.com/scientificreports/
Received: 23 April 2021; Accepted: 17 August 2021
References
1. Amado, L. C. et al. Accurate and objective infarct sizing by contrast-enhanced magnetic resonance imaging in a canine myocardial
infarction model. J. Am. Coll. Cardiol. 44, 2383–2389. https://doi.org/10.1016/j.jacc.2004.09.020 (2004).
2. Disertori, M. et al. Myocardial fibrosis assessment by LGE is a powerful predictor of ventricular tachyarrhythmias in ischemic and
nonischemic LV dysfunction: A meta-analysis. J. Am. Coll. Cardiol. Imaging 9, 1046–1055. https://doi.org/10.1016/j.jcmg.2016.
01.033 (2016).
3. Klem, I. et al. Assessment of myocardial scarring improves risk stratification in patients evaluated for cardiac defibrillator implanta-
tion. J. Am. Coll. Cardiol. 60, 408–420. https://doi.org/10.1016/j.jacc.2012.02.070 (2012).
4. Al-Khatib, S. M. et al. 2017 AHA/ACC/HRS Guideline for management of patients with ventricular arrhythmias and the preven-
tion of sudden cardiac death: Executive summary. Circulation 138, e210–e271. https://doi.org/10.1161/CIR.0000000000000548
(2018).
5. Jablonowski, R. et al. Cardiovascular magnetic resonance to predict appropriate implantable cardioverter defibrillator therapy in
ischemic and nonischemic cardiomyopathy patients using late gadolinium enhancement border zone: Comparison of four analysis
methods. Circ. Cardiovasc. Imaging. https://doi.org/10.1161/CIRCIMAGING.116.006105 (2017).
6. Andreu, D. et al. Cardiac magnetic resonance-aided scar dechanneling: Influence on acute and long-term outcomes. Heart Rhythm
14, 1121–1128. https://doi.org/10.1016/j.hrthm.2017.05.018 (2017).
7. Lopez-Yunta, M. et al. Implications of bipolar voltage mapping and magnetic resonance imaging resolution in biventricular scar
characterization after myocardial infarction. Europace 21, 163–174. https://doi.org/10.1093/europace/euy192 (2019).
8. Merino-Caviedes, S. et al. Multi-stencil streamline fast marching: A general 3-D framework to determine myocardial thickness
and transmurality in late enhancement images. IEEE Trans. Med. Imaging 33, 23–37. https://doi.org/10.1109/TMI.2013.2276765
(2014).
9. Cordero-Grande, L., Vegas-Sanchez-Ferrero, G., Casaseca-de-la-Higuera, P. & Alberola-Lopez, C. A Markov random field approach
for topology-preserving registration: Application to object-based tomographic image interpolation. IEEE Trans. Image Process.
Publ. IEEE Signal Process. Soc. 21, 2047–2061. https://doi.org/10.1109/TIP.2011.2171354 (2012).
10. Jones, S. E., Buchbinder, B. R. & Aharon, I. Three-dimensional mapping of cortical thickness using Laplace’s equation. Hum. Brain
Mapp. 11, 12–32. https://doi.org/10.1002/1097-0193(200009)11:1%3c12::aid-hbm20%3e3.0.co;2-k (2000).
11. Yezzi, A. J. Jr. & Prince, J. L. An Eulerian PDE approach for computing tissue thickness. IEEE Trans. Med. Imaging 22, 1332–1339.
https://doi.org/10.1109/TMI.2003.817775 (2003).
12. Prasad, M. et al. Quantification of 3D regional myocardial wall thickening from gated magnetic resonance images. J. Magn. Reson.
Imaging JMRI 31, 317–327. https://doi.org/10.1002/jmri.22033 (2010).
13. Khalifa, F., Beache, G. M., Gimel’farb, G., Giridharan, G. A. & El-Baz, A. Accurate automatic analysis of cardiac cine images. IEEE
Trans. Biomed. Eng. 59, 445–455. https://doi.org/10.1109/TBME.2011.2174235 (2012).
14. de Chillou, C. et al. Localizing the critical isthmus of postinfarct ventricular tachycardia: The value of pace-mapping during sinus
rhythm. Heart Rhythm 11, 175–181. https://doi.org/10.1016/j.hrthm.2013.10.042 (2014).
15. Jais, P. et al. Elimination of local abnormal ventricular activities: A new end point for substrate modification in patients with scar-
related ventricular tachycardia. Circulation 125, 2184–2196. https://doi.org/10.1161/CIRCULATIONAHA.111.043216 (2012).
16. Leiner, T. et al. Machine learning in cardiovascular magnetic resonance: Basic concepts and applications. J. Cardiovasc. Magn.
Reson. 21, 61. https://doi.org/10.1186/s12968-019-0575-y (2019).
17. Alexandre, J. et al. Scar extent as a predictive factor of ventricular tachycardia cycle length after myocardial infarction: Implications
for implantable cardioverter-defibrillator programming optimization. Europace 16, 220–226. https://doi.org/10.1093/europace/
eut289 (2014).
18. Santangeli, P. & Marchlinski, F. E. Substrate mapping for unstable ventricular tachycardia. Heart Rhythm 13, 569–583. https://doi.
org/10.1016/j.hrthm.2015.09.023 (2016).
19. Schmidt, A. et al. Infarct tissue heterogeneity by magnetic resonance imaging identifies enhanced cardiac arrhythmia susceptibil-
ity in patients with left ventricular dysfunction. Circulation 115, 2006–2014. https://doi.org/10.1161/CIRCULATIONAHA.106.
653568 (2007).
20. Piers, S. R. et al. Myocardial scar predicts monomorphic ventricular tachycardia but not polymorphic ventricular tachycardia or
ventricular fibrillation in nonischemic dilated cardiomyopathy. Heart Rhythm 12, 2106–2114. https://doi.org/10.1016/j.hrthm.
2015.05.026 (2015).
21. Bizino, M. B. et al. High spatial resolution free-breathing 3D late gadolinium enhancement cardiac magnetic resonance imaging in
ischaemic and non-ischaemic cardiomyopathy: Quantitative assessment of scar mass and image quality. Eur. Radiol. 28, 4027–4035.
https://doi.org/10.1007/s00330-018-5361-y (2018).
22. Suinesiaputra, A. et al. Quantification of LV function and mass by cardiovascular magnetic resonance: Multi-center variability
and consensus contours. J. Cardiovasc. Magn. Reson. 17, 63. https://doi.org/10.1186/s12968-015-0170-9 (2015).
23. Arenal, A. et al. Noninvasive identification of epicardial ventricular tachycardia substrate by magnetic resonance-based signal
intensity mapping. Heart Rhythm 11, 1456–1464. https://doi.org/10.1016/j.hrthm.2014.04.022 (2014).
24. van den Borne, S. W. et al. Molecular imaging of interstitial alterations in remodeling myocardium after myocardial infarction. J.
Am. Coll. Cardiol. 52, 2017–2028. https://doi.org/10.1016/j.jacc.2008.07.067 (2008).
25. Leon, D. G. et al. Three-dimensional cardiac fibre disorganization as a novel parameter for ventricular arrhythmia stratification
after myocardial infarction. Europace 21, 822–832. https://doi.org/10.1093/europace/euy306 (2019).
26. Woie, L. et al. The heart rate of ventricular tachycardia following an old myocardial infarction is inversely related to the size of
scarring. Europace 13, 864–868. https://doi.org/10.1093/europace/euq466 (2011).
27. Ávila, P. et al. Scar extension measured by magnetic resonance-based signal intensity mapping predicts ventricular tachycardia
recurrence after substrate ablation in patients with previous myocardial infarction. JACC Clin. Electrophysiol. 1, 353–365 (2015).
Acknowledgements
The Centro Nacional de Investigaciones Cardiovasculares (CNIC) is supported by the Instituto de Salud Carlos
III (ISCIII), the Ministerio de Ciencia e Innovación and the ProCNIC Foundation (Madrid, Spain). The CNIC
and the Barcelona Supercomputing Center (BSC, Barcelona, Spain) are Severo Ochoa Centers of Excellence
(SEV-2015-0505 and SEV-2011-0067, respectively). This study was also supported by grants from the Fondo
Europeo de Desarrollo Regional (CB16/11/00458), the Ministerio de Ciencia e Innovación (PID2019-109329RB-
I00) and the Heart Rhythm Association of the Spanish Society of Cardiology (ARC). The study was also part of
a Master Research Agreement between CNIC and Philips Healthcare. The study was partially supported by the
Fundación Interhospitalaria para la Investigación Cardiovascular (FIC, Madrid, Spain) and the Fundación Euge-
nio Rodríguez Pascual (Madrid, Spain). J.A.-S. is funded by the CompBioMed2 project grant agreement 823712,
Scientific Reports | (2021) 11:18722 | https://doi.org/10.1038/s41598-021-97399-w 12
Vol:.(1234567890)www.nature.com/scientificreports/
H2020-EU.1.4.1.3 European Union’s Horizon 2020 research and innovation program, the SILICOFCM pro-
ject, grant agreement 777204, H2020-EU.3.1.5 and by a Ramón y Cajal fellowship (RYC-2017-22532), MINECO,
Spain. L.K.G was funded by the Fundación Carolina-BBVA. Grant TEC2017-82408-R is also acknowledged.
Author contributions
(1) Conception and design: D.F.-R., C.A.-L., J.S.-G. (2) Experimental work, patient recruitment, analysis or
interpretation of data: S.M.-C., L.K.G., J.M.A.-A., S.S.-E., L.C.-G., J.G.Q., J.S.-G., M.M.-B., C.G.-A., D.E.-V., G.P.,
C.T., B.I., R.P., J.L.M., J.P.-V., J.J., M.L.-Y., M.V., J.A.-S., J.J.G.-F., N.P.-C., M.A.M.F.; C.A.-L., D.F.-R. (3) Drafting of
the manuscript or revising it critically for important intellectual content: S.M.-C., L.K.G., J.S.-G., J.G.Q., J.A.-S.,
L.C.-G., G.P., R.P., J.J., D.F.-R., C.A.-L. (4) Final approval of the manuscript submitted: all authors.
Competing interests
Javier Sánchez González is a Philips employee. All other authors do not have relationships with the industry
related with this manuscript.
Additional information
Supplementary Information The online version contains supplementary material available at https://doi.org/
10.1038/s41598-021-97399-w.
Correspondence and requests for materials should be addressed to C.A.-L. or D.F.-R.
Reprints and permissions information is available at www.nature.com/reprints.
Publisher’s note Springer Nature remains neutral with regard to jurisdictional claims in published maps and
institutional affiliations.
Open Access This article is licensed under a Creative Commons Attribution 4.0 International
License, which permits use, sharing, adaptation, distribution and reproduction in any medium or
format, as long as you give appropriate credit to the original author(s) and the source, provide a link to the
Creative Commons licence, and indicate if changes were made. The images or other third party material in this
article are included in the article’s Creative Commons licence, unless indicated otherwise in a credit line to the
material. If material is not included in the article’s Creative Commons licence and your intended use is not
permitted by statutory regulation or exceeds the permitted use, you will need to obtain permission directly from
the copyright holder. To view a copy of this licence, visit http://creativecommons.org/licenses/by/4.0/.
© The Author(s) 2021
Scientific Reports | (2021) 11:18722 | https://doi.org/10.1038/s41598-021-97399-w 13
Vol.:(0123456789)You can also read