Color tunable bioluminescence imaging portfolio for cell imaging - Nature
←
→
Page content transcription
If your browser does not render page correctly, please read the page content below
www.nature.com/scientificreports
OPEN Color‑tunable bioluminescence
imaging portfolio for cell imaging
Shota Tamaki1,3, Nobuo Kitada1,3, Masahiro Kiyama1, Rika Fujii2, Takashi Hirano1,
Sung Bae Kim2* & Shojiro Maki1*
The present study describes a color-tunable imaging portfolio together with twelve novel
coelenterazine (CTZ) analogues. The three groups of CTZ analogues create diverse hues of
bioluminescence (BL) ranging from blue to far red with marine luciferases. We found that the hue
completes the whole color palette in the visible region and shows red-shifted BL with a marine
luciferase: for example, Renilla luciferase 8 (RLuc8) and Artificial Luciferase 16 (ALuc16) show
187 nm- and 105 nm-redshifted spectra, respectively, by simply replacing the substrate CTZ with 1d.
The optical properties of the new CTZ analogues were investigated such as the kinetic parameters,
dose dependency, and luciferase specificity. The 2-series CTZ analogues interestingly have specificity
to ALucs and are completely dark with RLuc derivatives, and 3d is highly specific to only NanoLuc.
We further determined the theoretical background of the red-shifted BL maximum wavelengths
(λBL) values according to the extended π conjugation of the CTZ backbone using Density Functional
Theory (DFT) calculations. This color-tunable BL imaging system provides a useful multicolor imaging
portfolio that efficiently images molecular events in mammalian cells.
Cells provoke diverse intracellular signal transductions in response to a myriad of stimuli from the surround-
ing environment1. As cellular systems are such dynamical entities, multiplex imaging is a plausible modality for
spying and visualizing such molecular events in cells. To date, bioluminescence (BL) has been broadly utilized
for imaging diverse molecular events in the complex context of living subjects2. However, conventional BL sys-
tems have mostly depended on a limited color palette and narrow choices of luciferases such as firefly luciferase
(FLuc) and Renilla luciferase (RLuc)3. The limited color palette at shorter wavelengths commonly suffers from
severe attenuation by hemoglobin; hence red-shifted BL is more appropriate for in vivo imaging of signals from
deep physiological t issues4. This region ranging from 600 to 900 nm is especially called an “optical window”.
To address this limitation, many researchers have focused on expending the optical repertories toward red and
near infrared (NIR) region. Thanks to the efforts, a couple of excellent NIR imaging systems have been developed.
Yao et al. developed a multicolor imaging system with a beetle luciferase and a π-Extended L uciferin5. We also
developed a bioluminescence imaging (BLI) system with Akalumine and FLuc variants, and applied it to even
few cells in animal m odels6, where the maximal optical intensity (λmax) reaches 650 nm with A kaLuc7. Further,
we developed dye-conjugated CTZ a nalogues8 and a CTZ analogue emitting NIR BL for through-bond energy
transfer (TBET)-based imaging m odalities9 for far-red and NIR imaging.
In contrast to the success with red-shifted substrates and mutated luciferases, the color palette of marine lucif-
erases still has been confined mostly in blue and green region. Among marine luciferases, RLuc and its derivatives
have been mostly used in conventional BL imaging systems. Nevertheless, even RLuc derivatives merely reached
545 nm at the λmax by reacting to the unstable CTZ analogue, CTZv10. Recently, Kim et al. developed Artificial
Luciferases (ALuc), however, they emit BL only in the greenish-blue region, thus having an incomplete color
palette with respect to multicolor imaging modality.
NanoLuc has been utilized in various BLI systems, one of which maximally luminesces at 583 nm through
combining red-shifted coelenterazine (CTZ) analogues and a fusion protein of NanoLuc named “Antares2”11. It
is known that even NanoLuc alone has potential to emit red-shifted BL with Furimazine analogues12. NanoLuc
was further modified for bioluminescence resonance energy transfer (BRET)-based multicolor BLI by chemically
labeling it with either SNAP‐tag or HaloTag713.
We previously accomplished an NIR imaging s ystem4, which surprisingly achieved a ca. 300 nm blue-to-NIR
shift of BRET by combining a novel CTZ analogue, named “Bottle Blue (BBlue)”, with an infrared fluorescent
1
Department of Engineering Science, Graduate School of Informatics and Engineering, The University of
Electro-Communications, Chofu, Tokyo 182‑8585, Japan. 2Research Institute for Environmental Management
Technology, National Institute of Advanced Industrial Science and Technology (AIST), 16‑1 Onogawa,
Tsukuba 305‑8569, Japan. 3These authors contributed equally: Shota Tamaki and Nobuo Kitada. *email:
kimu‑sb@aist.go.jp; s‑maki@uec.ac.jp
Scientific Reports | (2021) 11:2219 | https://doi.org/10.1038/s41598-021-81430-1 1
Vol.:(0123456789)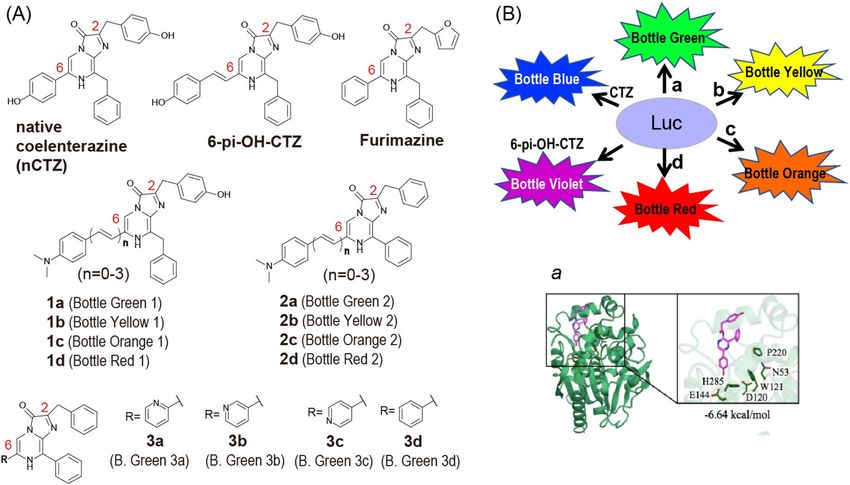
www.nature.com/scientificreports/
Figure 1. (A) Chemical structures of CTZ analogues for marine luciferases. The 12 luciferins were categorized
into three groups according to the chemical structures: 1, 2, and 3. B. Green means Bottle Green. (B) Schematic
diagram illustrating a color-tuneable BL imaging system, where the alphabets a, b, c, and d symbolize respective
CTZ analogues. Inset a shows the binding model between RLuc8 and coelenteramide.
protein (iRFP)-linked RLuc8.6-535SG (iRFP-RLuc8.6-535SG) fusion protein as a probe. The λmax reached 715 nm
after BRET.
In the present study, we synthesized nine novel CTZ analogues together with three known analogues (1a14,
3c , 3d11,15). They were categorized into three groups, which create diverse hues of BL colors ranging from
15,16
blue to far red with marine luciferases, where any visible colors may be generated by simply mixing a marine
luciferase with one of the CTZ analogues (Figs. 1, S8 and S9). The synthesis procedures were described in Figs. S8
and S9 in detail. Initially, we characterized the optical properties of the newly synthesized CTZ analogues such
as the kinetic parameters, dose dependency, and luciferase specificity. We further investigated the theoretical
background of the red-shifted BL maximum wavelengths (λBL) values according to the extended π conjugation
at the C6 position of the CTZ backbone using Density Functional Theory (DFT) and Time-Dependent Density
Functional Theory (TD-DFT) calculations.
The present color-tunable BL imaging system is an important addition to the molecular imaging studies
in vitro and in vivo.
Results and discussion
Synthesis of CTZ analogues. The basic molecular designs in Fig. 1 were inspired by our precedent studies
with luciferin analogues such as A kalumine17 and 6-pi-OH-CTZ18: (i) The first idea is to exert the significant red-
shifts of BL by replacing the benzothiazole backbone of D-Luciferin with an extended π c onjugation7,17; and (ii)
the second idea is to develop the luciferase specificity through the π conjugation at the C6 position of the CTZ
backbone18. Herein, we introduced the appendages with various lengths of the π conjugation at the C6 position
of the CTZ backbone, inspired by these two ideas. Furthermore, we deployed a dimethylamino group at the para
position of the phenyl moiety in the appendages at C6 that mimics the same functional group as in Akalumine.
The dimethylamino group plays important roles as an electron donating group (EDG) to increase the lumi-
nescence quantum yield and modulate emission w avelength19. Based on all the ideas, we synthesized the CTZ
analogues 1a–d and 2a–d. The analogues were categorized into two groups, Group 1 and Group 2, with respect
to the presence or absence of a hydroxyl group (-OH) at the benzene backbone of the C2 position (Fig. 1).
Separately, we synthesized another category of the CTZ analogues, that is specific to NanoLuc (Group 3),
where the phenyl group at the C6 position of Furimazine20 was substituted by a pyridine group, while the furan
group at the C2 position was replaced with a benzene (Fig. 1).
CTZ analogues are abbreviated as “[number] plus [alphabet]” according to Rules 1 and 2, wherein the groups
are represented as 1, 2, or 3 (Rule 1); and the double bind numbers at the C6 position are alphabetized as a (0
double bond), b (1 double bond), c (2 consecutive double bonds), and d (3 consecutive double bonds) (Rule 2).
CTZ analogues may be called Bottles Green, Yellow, Orange, or Red according to the colors as shown in Fig. 1.
Scientific Reports | (2021) 11:2219 | https://doi.org/10.1038/s41598-021-81430-1 2
Vol:.(1234567890)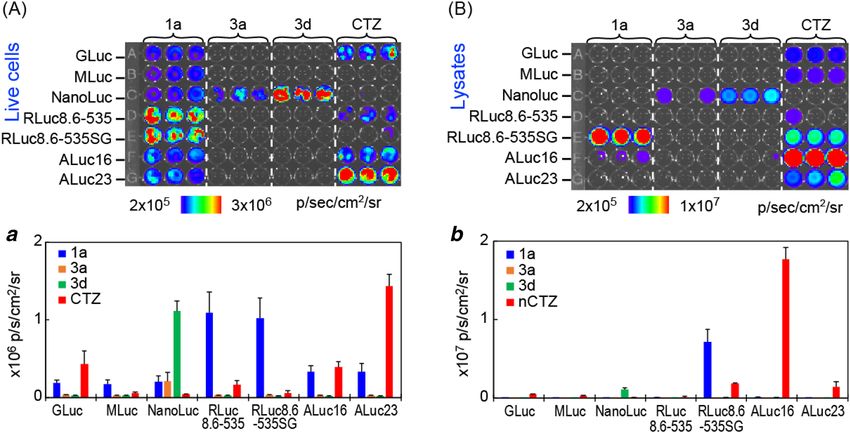
www.nature.com/scientificreports/
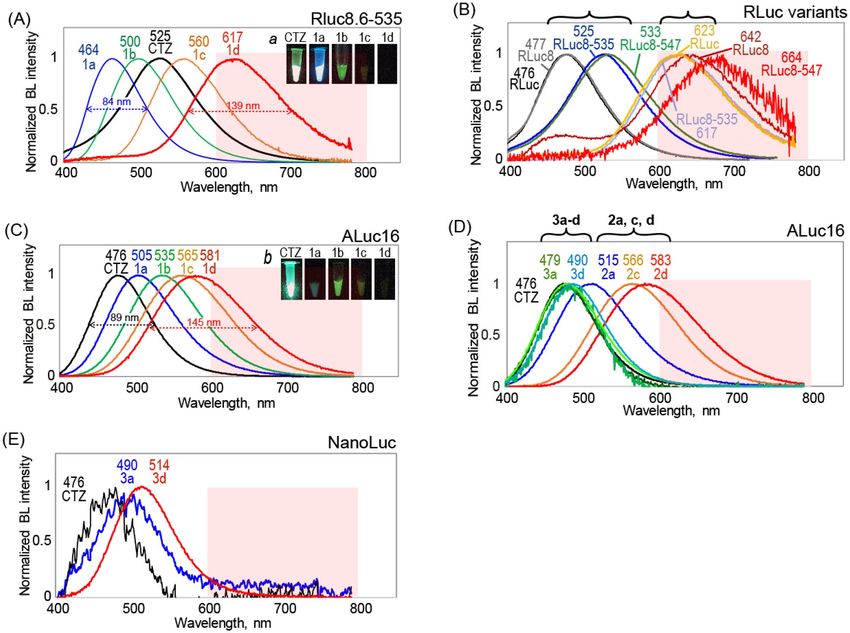
Figure 2. The BL spectra of the CTZ analogues 1a–d, 2a–d, and 3a–d according to marine luciferases. (A)
The BL spectra of 1-series CTZ analogues with RLuc8.6–535. Inset a shows the optical image of BL. (B) The BL
spectra of 1d according to various RLuc derivatives. (C) The BL spectra of 1-series CTZ analogues with ALuc16.
Inset b shows the optical image of BL. (D) The BL spectra of 2- and 3-series CTZ analogues with ALuc16. (E)
The BL spectra of 3a and 3d with NanoLuc. Abbreviations: CTZ, native coelenterazine; FWHM, full width half
maximum; BL, bioluminescence.
Full color spectra of bioluminescence. The BL spectra of the CTZ analogues according to marine lucif-
erases were obtained with a highly sensitive spectrometer that simultaneously captures photons with the entire
wavelength range in one shot (AB-1850, ATTO) (Fig. 2, Figures S1–S3).
The λBL of RLuc variants and ALuc16 are found to be red-shifted in the descending order of 1a, 1b, 1c, and
1d (Fig. 2A,C). The similar tendency is observed with 2-series CTZ analogues. Interestingly, the full width half
maximum (FWHM) is broadened in the same order (Table 1): i.e., 89 nm for nCTZ; 113 nm for 1b; 145 nm for
1d. The results indicate that the expansion of the π conjugation by increase of the number of double bonds at
the C6 position of the CTZ skeleton is the critical determinant for the red- shifts of the BL spectra with marine
luciferases. Thus, 1d and 2d exert the most red-shifted BL spectra in the groups.
Figure 2B highlights the red-shifted spectra of RLuc variants with 1d, compared to CTZ. We found that all
the λBL values of the RLuc variants with 1d exceed 600 nm. The λBL values were found at 642, 617, and 664 with
RLuc8, RLuc8.6–535, and RLuc8.6-547, respectively (Figs. 2, S1–S3). The most dramatic red-shifts were observed
with RLuc8, whose λBL value shifted from 477 to 642 nm (165 nm gap) through simply replacing CTZ with 1d.
Likewise, the λBL value of ALuc16 was observed from 476 to 581 nm according to the substrates, whose gap was
found to be ca. 105 nm between CTZ and 1d.
The overall results may be summarized as: (i) the BL colors of marine luciferases are freely tunable from
blue to far red (all the visible region) simply replacing the CTZ analogues; and (ii) the extended π conjugation
is the principle ingredient for the red-shifted λBL values with marine luciferases. The notable structural variance
between the 1- and 2-series CTZ analogues is whether a hydroxy (OH) group is possessed in the benzyl moiety
at the C2 position, and whether the substituent at the C8 position is a benzyl or a phenyl group. Although this
is a small structural variance, the 2-series analogues only showed negligible luminesce with all the RLuc deriva-
tives. In contrast, the same 2-series analogues significantly emit BL with ALuc16 and preserved the red-shifted
tendency according to the extended π conjugation (Fig. 2D).
Scientific Reports | (2021) 11:2219 | https://doi.org/10.1038/s41598-021-81430-1 3
Vol.:(0123456789)www.nature.com/scientificreports/
λBLa (nm) RLuc8.6-535 ALuc16
RLuc8.6 RLuc8.6 Total Int. b Int > 600 c Km FWHM Total Int Int > 600 Km FWHM
Comp RLuc RLuc8 -535 -547 ALuc16 NanoLuc (%) (%) (μM) d (nm) (%) (fold) (μM) (nm)
CTZ 476 477 525 533 476 472 100 100 26.5 116 100 100 38.5 89
1a 478 469 464 484 505 – 297 38 77.2 84 111 393 – 105
1b 504 518 500 543 535 – 81 32 15.1 97 187 1,297 7.9 113
1c 555 567 560 599 565 – 10 21 14.3 113 53 741 26.1 132
1d 623 642 (451) 617 664 581 – 12 59 20.9 139 31 619 70.6 145
2a – 563 – – 515 – 0 1 – 39 192 – 116
2b – 513 – – – – 0 1 – 1 17 – –
2c – 498 – – 566 – 0 1 – 91 1,299 157.3 129
2d – – – – 583 – 0 1 – 45 917 86.5 144
3a 501 520 500 512 479 490 0 0 – 6 21 – 96
3b – – – – 484 490 0 0 – 3 19 – 97
3c 490 520 487 496 480 449 0 0 – 46 64 68.3 96
3d – 515 – – 490 514 0 0 – 28 50 120.1 96
Table 1. BL properties of CTZ analogues with various marine luciferases. The table summarizes BL maximum
wavelengths (λBL), the total BL intensities (Total Int.), the intensity ratios exceeding 600 nm over the total
intensities (Int > 600), Michaelis constants (Km), and full width half maximum (FWHM). Abbreviations: CTZ,
native coelenterazine; RLuc, Renilla luciferase; RLuc8, Renilla luciferase 8; RLuc8.6–535, Renilla luciferase 8.6–
535; ALuc16, Artificial luciferase 16. a BL maximum wavelength. bThe whole BL intensities of CTZ analogues,
compared to that of CTZ. cThe ratios of the BL intensities that is longer than 600 nm in the wavelength. dThe
Michaelis–Menten constant.
This result is consistent with our previous conclusion that specifies the importance of the C2 position of the
CTZ backbone in the luciferase specificity18,21. We previously showed that CTZh which has no OH group in the
C2 position still keeps its RLuc activities21. However, the same OH group-deficient 2-series substrates in this
study did not show considerable BL intensities with the RLuc derivatives, together with the phenyl group at the
C8 position. These results suggest that the CTZ analogues are active with RLuc derivatives, together with the
OH group in the benzyl moiety at the C2 position and the phenyl group at the C8 position.
In contrast to the 1- and 2-series analogues, the 3-series analogues failed to develop notably red-shifted BL
with conventional marine luciferases. The overall absolute BL intensity is weak excepting the case that 3d selec-
tively emits significant BL with NanoLuc (Fig. 2E).
Analysis of the red‑shifts based on density functional theory. To investigate a determinant of the
λBL shifts by the extended π conjugation at C6 of the CTZ backbone in the 1- and 2-series analogues, we carried
out Density Functional Theory (DFT) and Time-Dependent Density Functional Theory (TD-DFT) calculations
of the acetamidopyrazine cores [oxy-1a′–d′ and oxy-2a′–d′ (Scheme 1)] of the amide products for 1a-d and 2a-d
with the B3LYP/6–31 + G(d) method22–24 (Table 2). As the possible structures of the excited products generated
by the BL reactions25,26, both the neutral and amide anion forms were investigated (Scheme 1). For calculations,
the integral-equation formulation polarizable continuum model (IEF-PCM) a pproximation27 was also adopted
with DMSO as a solvent widely employed for imidazopyrazinone chemistry28.
The S0 → S1 transitions of all compounds are of π,π* having the main contribution of the HOMO → LUMO
configurations. The wavelengths (λtr) estimated from the calculated transition energies can be used as the values
to evaluate electronic absorption and fluorescence wavelengths of the amide products from 1a–d and 2a–d.
The extension of the π-electronic conjugation by the ethene unit insertion effectively induces a large red-shift
of the λtr value both in the neutral and anion forms for both the 1- and 2-series compounds. An increase in
the number of the inserted ethene unit leads to decrease the HOMO–LUMO gap efficiently, resulting in a large
variation of the λtr values. This result supports the experimental consequences that 1a–d and 2a–d showed the
large red-shifts of the λBL values.
The λtr values of oxy-2a′–d′ and their anions are slightly red-shifted, compared with those of oxy-1a′–d′
and their anions, indicating that the phenyl groups of oxy-2a′–d′ and their anions function a little to expand π
conjugation. In particular, phenyl-conjugation mainly lowers the LUMO levels of oxy-2a′–d′ and their anions
compared with those of oxy-1a′–d′ and their anions, resulting in decreases of the HOMO–LUMO gaps. The
observations of the λBL values of ALuc16 with 1a–d and 2a–d matches the trend of the calculation result.
Interestingly, the λtr values of oxy-1a′–d′ (an) and oxy-2a′–d′ (an) are 10–27 nm blue-shifted compared with
those of the corresponding neutral forms, but the calculation data indicate that it is not easy to discriminate the
neutral and amide anion forms of the excited products generated by the BL reactions based on the observed λBL
values. Only oxy-1a′ has already been investigated its fluorescence property, to indicate that the excited oxy-1a′
has polarized character to show a large fluorescence s olvatochromism29. To confirm the structures of the excited
products of the BL reactions, we need to investigate the fluorescence property of the amide products further.
Scientific Reports | (2021) 11:2219 | https://doi.org/10.1038/s41598-021-81430-1 4
Vol:.(1234567890)www.nature.com/scientificreports/
Scheme 1. Molecular structures of acetamidopyrazine cores of the amide products for 1a–d and 2a–d and their
amide anions.
λtr/nm (f)a
Comp HOMO/eV LUMO/eV for S0 → S1 Configurationb
H → L 0.69
oxy-1a′ − 5.37 − 1.79 395 (0.43)
H → L + 1 − 0.14
oxy-1b′ − 5.19 − 2.10 450 (0.96) H → L 0.70
oxy-1c′ − 5.07 − 2.25 485 (1.42) H → L 0.70
oxy-1d′ − 4.98 − 2.38 524 (1.85) H → L 0.70
H → L 0.69
oxy-2a′ − 5.37 − 1.86 413 (0.22)
H → L + 1 0.12
H → L 0.69
oxy-2b′ − 5.20 − 2.13 459 (0.86)
H → L + 1 − 0.12
oxy-2c′ − 5.08 − 2.27 492 (1.37) H → L 0.70
oxy-2d′ − 4.98 − 2.40 530 (1.84) H → L 0.70
H → L 0.68
oxy-1a′(an) − 4.94 − 1.09 372 (0.51)
H → L + 1 0.12
oxy-1b′(an) − 4.80 − 1.50 427 (1.21) H → L 0.70
oxy-1c′(an) − 4.73 − 1.73 459 (1.84) H → L 0.70
oxy-1d′(an) − 4.69 − 1.94 497 (2.39) H → L 0.70
H − 1 → L − 0.10
oxy-2a′(an) − 4.99 − 1.36 403 (0.19)
H → L 0.70
H → L 0.69
oxy-2b′(an) − 4.83 − 1.61 447 (0.84)
H → L + 1 0.12
H → L 0.69
oxy-2c′(an) − 4.76 − 1.80 473 (1.54)
H → L + 1 0.13
oxy-2d′(an) − 4.72 − 1.99 505 (2.21) H → L 0.70
Table 2. Calculation data of acetamide cores oxy-1a′–d′ and oxy-2a′–d′ of the amide products from 1a–d
and 2a–d and the corresponding amide anions with DFT and TD-DFT using B3LYP/6–31 + G(d) (IEF-PCM,
DMSO). a Wavelengths (λtr) estimated from the energies for S0 → S1 transitions. Oscillator strengths (f) are in
parentheses. b H − 1, H, L and L + 1 denote the HOMO − 1, HOMO, LUMO and LUMO + 1, respectively. “an”
means an anionic form.
Optical intensity and specificity. We further compared the absolute BL intensities of the CTZ analogues
with RLuc variants (Fig. S3). The absolute BL intensities have a strong tendency to decrease as they proceed from
1a to 1d in the 1-series: e.g., the highest is with 1a, whereas the lowest is with 1c or 1d. Upon comparison of the
fold intensities, 1a and 1b showed 2.2- and 1.6-fold brighter than CTZ, respectively (Fig. S3), while 1c and 1d
luminesce 0.4- and 0.6-fold levels, respectively, compared to CTZ. On the other hand, ALuc16 showed the high-
est BL intensity with 1b (ca. 1.5-fold brighter than with CTZ) and then with 1a.
One of the most unique features of the present CTZ analogues is the luciferase specificity (Fig. 3). RLuc8.6-
535SG specifically luminesces only with the 1-series CTZ analogues in both live cells and lysates, whereas ALucs
Scientific Reports | (2021) 11:2219 | https://doi.org/10.1038/s41598-021-81430-1 5
Vol.:(0123456789)www.nature.com/scientificreports/
Figure 3. Luciferase-specific BLI of the selected CTZ analogues. (A) The BL image of selected CTZ analogues
in live COS-7 cells. Inset a compares the BL intensities of the BL image. (B) The BL image of selected CTZ
analogues in cell lysates. Inset b specifies the BL intensities of the BL image.
are significantly bright with both 1- and 2-series CTZ analogues. Meanwhile, 3d is highly specific only to Nano-
Luc. Upon comparison of the lysate with the live cell imaging, the lysates allowed better signal-to-background
ratios with 1a and CTZ.
It is interesting to compare the optical intensities of ALuc16 and ALuc23 in live cells and lysates. In live cells,
ALuc23 is brighter than ALuc16. However, the BLI is reversed in the lysates. This optical discrepancy in live cells
and lysates between ALuc16 and ALuc23 may be the results affected by their distinctive sensitivities to the pH
and ingredients like a detergent in the lysis buffer, besides their distinctive optical kinetics.
Altogether, the results show that strong BL in blue is generated with the combinations of RLuc8.6-535—la
(λmax: 464 nm) and RLuc—1a (λmax: 478 nm). This RLuc8.6–535—la combination is surprisingly 4.3-fold brighter
than conventional RLuc8.6–535—CTZ combination. Bluish green BL is observed with RLuc8.6–535—1b com-
bination (λmax: 500 nm), intensity of which is almost equivalent to RLuc8.6–535—CTZ combination.
Green BL is made with ALuc16—1a (λmax: 505 nm) and ALuc16—1b combinations (λmax: 535 nm). The
ALuc16—1b combination is almost 1.5-fold brighter than ALuc16—CTZ combination. Yellowish green BL is
generated with RLuc—1c (λmax: 555 nm) and ALuc16—1c combinations (λmax: 565 nm). The spectrum portion
longer than 600 nm of ALuc16—1c combination occupies 32% over the total spectrum area. Yellow color BL is
observed with ALuc16—1d combination (λmax: 581 nm). The 46.5% of the spectrum area is located at the region
longer than 600 nm. Red BL is generated with RLuc—1d combination (λmax: 623 nm), where 77% of the total
spectrum area is placed in the wavelength longer than 600 nm.
The results also recommend using NanoLuc—3d combination for exclusive specificity against the other
combinations. RLuc8.6-535SG—1a combination is also found to show exclusive specificity each other in lysates.
Kinetics and dose dependency. The kinetic parameters are an important determinant to evaluate the
optical performance of the CTZ variants with the marine luciferases. We investigated Michaelis constant (Km) of
the selected substrates based on Lineweaver–Burk equation and summarized it in Table 1. The Km values of the
1-series substrates with RLuc8.6–535 and ALuc16 range from 7.9 to 77.2 µM. The lowest Km value was observed
with the combination of 1b plus ALuc16. It is interpreted that 1b has the highest binding property with ALuc16,
among tested. Naturally, the 1b—ALuc16 reaction exerted the highest BL intensity among tested. The most red-
shifted substrates in each series, i.e., 1d, 2d, and 3d, commonly showed relatively weak binding property with
ALuc16 in the respective categories.
The substrate concentration-driven BL intensities are also determined with RLuc8.6-535 and ALuc16 (Figs. S4
and S5). It has a tendency that the higher substrate concentrations exert stronger BL intensities. The BL intensities
of CTZ and 3d start enhancing at 2.5 µM and reach to a plateau at ca. 100 µM with ALuc16. The BL intensities
of 1a start enhancing at 10 µM and keep raising even at ca. 100 µM with both RLuc8.6-535 and ALuc16. The
overall results suggest that the optimal substrate concentration is ca. 100 µM with both RLuc8.6-535 and ALuc16.
Scientific Reports | (2021) 11:2219 | https://doi.org/10.1038/s41598-021-81430-1 6
Vol:.(1234567890)www.nature.com/scientificreports/
Summary
Taken together, we developed a color-tunable BL imaging portfolio creating diverse hues of visible colors ranging
from 464 nm blue to 664 nm far red colors with marine luciferases, where any visible colors may be generated by
mixing a marine luciferase with one of the CTZ analogues. One may specifically image diverse molecular events
involving multiple marine luciferases with various colors. As some of the versatile CTZ analogues surprisingly
have significant luciferase specificity, e.g., 2-series and 3d, such CTZ analogues convince simultaneous imaging
of molecular events in a single system. The present color-tunable BL imaging system is an important addition to
the molecular imaging studies in vitro and in vivo as this system can easily create diverse hues of visible colors
with marine luciferases, together with significant specificity.
Experimental procedures
Preparation of the plasmids encoding a marine luciferase. The pcDNA 3.1( +) plasmids (Invitro-
gen) encoding various marine luciferases were obtained from our previous studies4,8,30,31: The luciferases include
Renilla luciferase (RLuc), Renilla luciferase 8 (RLuc8), Renilla luciferase 8.6-535 (RLuc8.6-535), Renilla lucif-
erase 8.6-535SG (RLuc8.6-535SG), Renilla luciferase 8.6-547 (RLuc8.6-547), Gaussia luciferase (GLuc, Gen-
Bank AAG54095.1), Metridia longa luciferase (MLuc), NanoLuc, Artificial Luciferase 16 (ALuc16, GenBank
MF817967), and Artificial Luciferase 23 (ALuc23, MF817968).
Briefly, A pMetluc2 vector encoding Metridia longa luciferase (MLuc) was purchased from Clontech (Moun-
tain View, CA). The RLuc variants (RLuc8, RLuc8.6–535, and RLuc8.6-535SG) were generously gifted by Dr.
Sanjiv S. Gambhir (Stanford University) or Dr. Moritoshi Sato (Tokyo University). The cDNAs encoding the
other marine luciferases were custom-synthesized by Eurofins Genomics, based on the open information of the
cDNA sequences in the National Center for Biotechnology Information (NCBI) database.
The cDNA fragments were ligated and subcloned in pcDNA3.1(+) vectors for mammalian cell expression.
The overall sequence fidelity was confirmed with a sequencing service provided by Eurofins Genomics (Tokyo).
Determination of bioluminescence spectra of the CTZ analogues. The BL spectra of the CTZ ana-
logues were determined according to various luciferases (Figs. 2 and S2, S3, and S4).
The MDA-MB-231 cells derived from epithelial, human breast cancer cell line were originally cultured in
6-well microplates (Nunc) using a Dulbecco’s Modified Eagle Medium (DMEM) supplemented with 10% fetal
bovine serum (FBS) and 1% penicillin–streptomycin (final concentration: 100 U/mL). The cells were tran-
siently transfected with pcDNA 3.1(+) vector (Invitrogen) encoding RLuc, RLuc8, RLuc8.6–535, RLuc8.6-535SG,
RLuc8.6-547, ALuc16, ALuc23, or NanoLuc, using a lipofection reagent (TransIT-LT1, Mirus). The cells were
incubated two days in a C O2 incubator (Sanyo). The cells were trypsinized and subcultured into a 96-well
black-frame optical-bottom microplate (Thermo Fisher Scientific). The cells were further incubated in the CO2
incubator until reach 90% of confluence. The cells were then lysed with a lysis buffer (Promega) for 20 min and
an aliquot of the lysates (40 µL) were transferred into a PCR tube (200 µL volume). The consequent BL spectra
were determined after injection of each luciferin dissolved in 40 µL HEPES buffer (50 mM, pH 7.2, Thermo
Fisher) using a precision spectrophotometer (AB-1850, ATTO) simultaneously acquiring entire wavelengths of
BL. The light integration time was 1, 2, or 5 min.
The cellular concentrations of the luciferases are unclear because the expression levels are not controllable.
Instead, we conducted all the studies hereafter with equal amounts of the substrates and the fixed number of the
cells (10,000 per well on a 96well microplate).
Determination of the luciferase specificity of the CTZ variants. The MDA-MB-231 cells were
raised in a 6-well microplate (Nunc) until reach 70% of confluence. The cells were transiently transfected with
pcDNA3.1(+) vector encoding GLuc, MLuc, NanoLuc, RLuc8.6-535, RLuc8.6-535SG, ALuc16, or ALuc23. The
cells were further incubated in a CO2 incubator for 2 days. The cells were then subcultured into a 96-well black-
frame optical-bottom microplate and incubated one more day in the CO2 incubator.
The culture media of the microplates are decanted and washed once with a phosphate-buffered saline (PBS).
The wells in the microplate were randomly separated into two sections. The following live cell imaging was
conducted through simultaneously injecting a series of CTZ analogues dissolved in 40 µL HEPES buffer into
the wells in a section using a 12-channel micropipette. The consequent BL intensities were determined with an
IVIS imaging system (PerkinElmer). On the other hand, the wells in the other section were lysed with a lysis
buffer (Promega) for 20 min. 20 µL of the lysates were moved to a fresh 96-well black-frame optical-bottom
microplate. The lysates in the microplate was simultaneously mixed with 40 µL of CTZ analogues dissolved in
HEPES buffer using a 12-channel micropipette. The optical intensities were immediately determined with the
IVIS imaging system (PerkinElmer).
Determination of the kinetic parameters of the BL according to the colenterazine (CTZ) ana‑
logues Lineweaver–Burk. The kinetic parameters of the BL according to the coelenterazine (CTZ) ana-
logues were determined with Lineweaver–Burk equation (Table 1).
A series of reaction solutions were prepared beforehand. Firstly, the CTZ variants were dissolved in HEPES
buffer (50 mM, pH 7.2) to be 0.02–100 µM, and deployed in a 96-well black-frame optical-bottom microplate.
Secondly, the recombinant marine luciferases (RLuc8.6-535 and ALuc16) were also dissolved in the same HEPES
buffer to be 0.2 µM, and primed in the automatic injectors of a microplate reader (TriStar2 S LB942, Berthold),
respectively. The substrates were placed in the microplate (final concentrations: 0.01–50 µM) beforehand and the
microplate was then set on the sample stage of the microplate reader. The marine luciferase (final concentration:
0.1 µM) primed in the reader injector were injected into each well of the microplate and the corresponding BL
Scientific Reports | (2021) 11:2219 | https://doi.org/10.1038/s41598-021-81430-1 7
Vol.:(0123456789)www.nature.com/scientificreports/
intensities were recorded every 0.1 s during the initial five seconds. The final concentrations of the substrates
were at 0.1, 0.25, 0.5, 1, 2.5, 5, 10, 25, 50, and 100 µM. The measurements were quadruplicated for the follow-
ing statistical analyses (n = 4). The Km and Vmax values were calculated from Lineweaver–Burk plots using the
Enzyme Kinetics Wizard in the commercially available SigmaPlot 13.0 software package (Systat Software Inc.,
San Jose, CA).
Synthesis of CTZ analogues 1a–d and 2a–d. The CTZ analogues 1a–d and 2a–d were synthesized
according to the following scheme (Figs. S7 and S8): the starting chemicals, aldehyde 5a–c, were boron-Wittig
reacted with [(pinacolato) boryl] methane to produce pinacol borane esters 6a–c. Separately, 2-amino-3-benzyl-
5-Bromoaminopyrazine 4a was synthesized by a coupling reaction of commercially available 2-amino-3,5-di-
bromoaminopyrazine 3 with benzylmagnesium chloride and bis (triphenylphosphine) palladium (II) dichlo-
ride. We further conducted a Suzuki–Miyaura coupling reaction using 3 and a phenylboronic acid to produce
2-amino-3-phenyl-5-bromoaminopyrazine (4b). The made 4a and 4b were additionally reacted with 4-(dimeth-
ylamino) phenylboronic acid or 6a-c through Suzuki–Miyaura coupling to create the aminopyrazine deriva-
tives 7a–d and 8a–d. Finally, the synthesized aminopyrazine derivatives 7a–d and 8a–d were reacted with the
ketoacetal derivatives 9 and 10, respectively, and condensed and cyclized under hydrochloric acid conditions.
The synthesized CTZ analogues were named 1a–d and 2a–d, respectively.
Synthesis of CTZ analogues 3a–d. The CTZ analogues 3a–d were synthesized according to the fol-
lowing scheme (Fig. S9): An aminopyrazine derivative 12a was firstly synthesized by a Stille coupling reaction
between 4b and 2-(tributyltin)pyridine (11a). The aminopyrazine derivatives 12b–d were separately synthesized
by Suzuki–Miyaura coupling with 4b and boronic acids 11b–d. Finally, the obtained aminopyrazine derivatives
12a-d were reacted with a ketoacetal derivative 10, and further condensed and cyclized under hydrochloric acid
conditions. The consequent CTZ analogues were named 3a–d.
Synthetic procedures of the CTZ analogues general. The starting materials, reagents, and solvents
were purchased and used without further purification. We used Silica gel 70 F254 TLC plates (Wako) for ana-
lytical Thin-layer chromatography (TLC), while Silica gel 60 N (spherical, neutral, Kanto Chemical) were for
column chromatography. For preparative flash chromatography, used were an automated system (Smart Flash
EPCLC AI-580S, Yamazen Corp., Japan) equipped with universal columns of silica gel. Melting points and IR
spectra were determined with a MP-500P (Yanaco) and a Nicolet 6700 spectrometer with anATR attachment,
respectively. 1H and 13C NMR spectra were determined on a JEOL ECA-500 instrument (500 MHz for 1H and
126 MHz for 13C). Mass spectra were obtained with a high-resolution electro-spray ionization mass spectrom-
eter, JMS-T100LC (JEOL). UV/visible absorption spectra were determined with a spectrophotometer, Cary 60
(Agilent Technologies) (scan speed 600 nm/min; data interval 1 nm). BL and chemiluminescence spectra were
measured with a precision spectrophotometer, AB-1850 (ATTO) (data interval: 1 nm). BL intensities were mon-
itored using luminometers, AB-2270 (ATTO) and GL-201A (Microtec Co.). BL imaging was performed with a
multifunctional in vivo imaging system (IVIS Spectrum, PerkinElmer).
DFT and TD DFT calculations of oxy‑1a′–d′, oxy‑2a′–d′, oxy‑1a′–d′ (an), and oxy‑2a′–d′
(an). Density functional theory (DFT) calculations were performed with the Gaussian 09 program (Rev.
D.01)32. DFT includes the B3LYP function with the 6-31 + G(d) basis set22–24 and IEF-PCM approximation in
DMSO27. The molecular structures of oxy-1a′–d′, oxy-2a′–d′, oxy-1a′–d′ (an), and oxy-2a′–d′ (an) were opti-
mized by DFT calculations as shown in Fig. S10. Based on their optimized structures, time-dependent (TD)
DFT calculations were carried out to give the properties of the electronic transitions including the S 0 → S1 transi-
tions. Molecular graphics were made with GaussView, Version 533.
Received: 12 September 2020; Accepted: 7 January 2021
References
1. Alberts, B. Molecular Biology of the Cell 3rd edn. (Garland Pub., Spokane, 1994).
2. Ozawa, T., Yoshimura, H. & Kim, S. B. Advances in fluorescence and bioluminescence imaging. Anal. Chem. 85, 590–609. https
://doi.org/10.1021/Ac3031724 (2013).
3. Heffern, M. C. Diversifying the glowing bioluminescent toolbox. ACS Cent. Sci. 3, 1234–1236. https://doi.org/10.1021/acscentsci
.7b00594 (2017).
4. Nishihara, R. et al. Highly bright and stable NIR-BRET with blue-shifted coelenterazine derivatives for deep-tissue imaging of
molecular events in vivo. Theranostics 9, 2646–2661. https://doi.org/10.7150/thno.32219 (2019).
5. Yao, Z., Zhang, B. S., Steinhardt, R. C., Mills, J. H. & Prescher, J. A. Multicomponent bioluminescence imaging with a pi-extended
luciferin. J. Am. Chem. Soc. 142, 14080–14089. https://doi.org/10.1021/jacs.0c01064 (2020).
6. Iwano, S. et al. Single-cell bioluminescence imaging of deep tissue in freely moving animals. Science 359, 935–939. https://doi.
org/10.1126/science.aaq1067 (2018).
7. Kuchimaru, T. et al. A luciferin analogue generating near-infrared bioluminescence achieves highly sensitive deep-tissue imaging.
Nat. Commun. 7, 11856. https://doi.org/10.1038/ncomms11856 (2016).
8. Nishihara, R. et al. Azide- and dye-conjugated coelenterazine analogues for a multiplex molecular imaging platform. Bioconjugate
Chem. 29, 1922–1931. https://doi.org/10.1021/acs.bioconjchem.8b00188 (2018).
9. Abe, M. et al. Near-infrared bioluminescence imaging with a through-bond energy transfer cassette. ChemBioChem 20, 1919–1923.
https://doi.org/10.1002/cbic.201900149 (2019).
Scientific Reports | (2021) 11:2219 | https://doi.org/10.1038/s41598-021-81430-1 8
Vol:.(1234567890)www.nature.com/scientificreports/
10. Loening, A. M., Wu, A. M. & Gambhir, S. S. Red-shifted Renilla reniformis luciferase variants for imaging in living subjects. Nat.
Methods 4, 641–643. https://doi.org/10.1038/nmeth1070 (2007).
11. Yeh, H. W. et al. Red-shifted luciferase-luciferin pairs for enhanced bioluminescence imaging. Nat. Methods 14, 971–974. https://
doi.org/10.1038/Nmeth.4400 (2017).
12. Shakhmin, A. et al. Coelenterazine analogues emit red-shifted bioluminescence with NanoLuc. Org. Biomol. Chem. 15, 8559–8567.
https://doi.org/10.1039/C7OB01985H (2017).
13. Hiblot, J. et al. Luciferases with tunable emission wavelengths. Angew. Chem. Int. Ed. 56, 14556–14560. https://doi.org/10.1002/
anie.201708277 (2017).
14. Teranishi, K. & Goto, T. Effects of conformational rigidity and hydrogen-bonding in the emitter on the chemi-luminescence
efficiency of coelenterazine (oplophorus luciferin). Chem. Lett. 18, 1423–1426. https://doi.org/10.1246/cl.1989.1423 (1989).
15. Yeh, H. W. et al. ATP-independent bioluminescent reporter variants to improve in vivo imaging. ACS Chem. Biol. 14, 959–965.
https://doi.org/10.1021/acschembio.9b00150 (2019).
16. Hart, R. C., Matthews, J. C., Hori, K. & Cormier, M. J. Renilla-reniformis bioluminescence—luciferase-catalyzed production of
non-radiating excited-states from luciferin analogs and elucidation of the excited-state species involved in energy-transfer to renilla
green fluorescent protein. Biochemistry 18, 2204–2210. https://doi.org/10.1021/bi00578a011 (1979).
17. Iwano, S. et al. Development of simple firefly luciferin analogs emitting blue, green, red, and near-infrared biological window light.
Tetrahedron 69, 3847–3856. https://doi.org/10.1016/j.tet.2013.03.050 (2013).
18. Nishihara, R. et al. Luciferase-specific coelenterazine analogues for optical contamination-free bioassays. Sci. Rep. 7, 908. https://
doi.org/10.1038/s41598-017-00955-6 (2017).
19. Hirano, T. et al. The reaction mechanism for the high quantum yield of Cypridina (Vargula) bioluminescence supported by the
chemiluminescence of 6-aryl-2-methylimidazo[1,2-a]pyrazin-3(7H)-ones (Cypridina luciferin analogues). Photochem. Photobiol.
Sci. 7, 197–207. https://doi.org/10.1039/b713374j (2008).
20. Hall, M. P. et al. Engineered luciferase reporter from a deep sea shrimp utilizing a novel imidazopyrazinone substrate. ACS Chem.
Biol. 7, 1848–1857. https://doi.org/10.1021/cb3002478 (2012).
21. Kim, S. B. & Izumi, H. Functional artificial luciferases as an optical readout for bioassays. Biochem. Biophy. Res. Commun. 448,
418–423. https://doi.org/10.1016/j.bbrc.2014.04.128 (2014).
22. Lee, C. T., Yang, W. T. & Parr, R. G. Development of the colle-salvetti correlation-energy formula into a functional of the electron-
density. Phys. Rev. B 37, 785–789. https://doi.org/10.1103/PhysRevB.37.785 (1988).
23. Becke, A. D. Density-functional thermochemistry. 3. The role of exact exchange. J. Chem. Phys. 98, 5648–5652. https://doi.
org/10.1063/1.464913 (1993).
24. Stephens, P. J., Devlin, F. J., Chabalowski, C. F. & Frisch, M. J. Ab-initio calculation of vibrational absorption and circular-dichroism
spectra using density-functional force-fields. J. Phys. Chem. 98, 11623–11627. https://doi.org/10.1021/j100096a001 (1994).
25. Hirano, T. et al. Revision of the structure of the light-emitter in aequorin bioluminescence. J. Chem. Soc. Chem. Commun. https
://doi.org/10.1039/C39940000165 (1994).
26. Mori, K., Maki, S., Niwa, H., Ikeda, H. & Hirano, T. Real light emitter in the bioluminescence of the calcium-activated photopro-
teins aequorin and obelin: light emission from the singlet-excited state of coelenteramide phenolate anion in a contact ion pair.
Tetrahedron 62, 6272–6288. https://doi.org/10.1016/j.tet.2006.04.044 (2006).
27. Tomasi, J., Mennucci, B. & Cammi, R. Quantum mechanical continuum solvation models. Chem. Rev. 105, 2999–3093. https://
doi.org/10.1021/cr9904009 (2005).
28. Johnson, F. H. & Haneda, Y. Bioluminescence in Progress; Proceedings (Princeton University Press, Princeton, 1966).
29. Saito, R., Hirano, T., Niwa, H. & Ohashi, M. Solvent and substituent effects on the fluorescent properties of coelenteramide ana-
logues. J. Chem. Soc. Perkin Trans. 2, 1711–1716. https://doi.org/10.1039/A701156C (1997).
30. Kim, S. B. et al. Cation-driven optical properties of artificial luciferases. Anal. Sci. 31, 955–960. https://doi.org/10.2116/anals
ci.31.955 (2015).
31. Kim, S. B., Torimura, M. & Tao, H. Creation of artificial luciferases for bioassays. Bioconjugate Chem. 24, 2067–2075. https://doi.
org/10.1021/bc400411h (2013).
32. M. J. Frisch et al. Gaussian 9 Rev. D.01. Gaussian 9 Rev. D.01 (2009).
33. 33R. Dennington, T. Keith & Millam, J. GaussView. GaussView Version 5 (2009).
Acknowledgements
This work was supported in part by JSPS KAKENHI Grants: Numbers 15KK0029, 17H01215, 17H06371,
18K05075, 20K21851, and 24225001.
Author contributions
S.B.K. and T.H. wrote the main manuscript text. S.B.K, S.T., M.K. and R.F. conducted experiments. All authors
reviewed the manuscript.
Competing interests
The authors declare no competing interests.
Additional information
Supplementary Information The online version contains supplementary material available at https://doi.
org/10.1038/s41598-021-81430-1.
Correspondence and requests for materials should be addressed to S.B.K. or S.M.
Reprints and permissions information is available at www.nature.com/reprints.
Publisher’s note Springer Nature remains neutral with regard to jurisdictional claims in published maps and
institutional affiliations.
Scientific Reports | (2021) 11:2219 | https://doi.org/10.1038/s41598-021-81430-1 9
Vol.:(0123456789)www.nature.com/scientificreports/
Open Access This article is licensed under a Creative Commons Attribution 4.0 International
License, which permits use, sharing, adaptation, distribution and reproduction in any medium or
format, as long as you give appropriate credit to the original author(s) and the source, provide a link to the
Creative Commons licence, and indicate if changes were made. The images or other third party material in this
article are included in the article’s Creative Commons licence, unless indicated otherwise in a credit line to the
material. If material is not included in the article’s Creative Commons licence and your intended use is not
permitted by statutory regulation or exceeds the permitted use, you will need to obtain permission directly from
the copyright holder. To view a copy of this licence, visit http://creativecommons.org/licenses/by/4.0/.
© The Author(s) 2021
Scientific Reports | (2021) 11:2219 | https://doi.org/10.1038/s41598-021-81430-1 10
Vol:.(1234567890)You can also read