Point of care testing of plasma free hemoglobin and hematocrit for mechanical circulatory support - Nature
←
→
Page content transcription
If your browser does not render page correctly, please read the page content below
www.nature.com/scientificreports
OPEN Point‑of‑care testing of plasma
free hemoglobin and hematocrit
for mechanical circulatory support
Dong Ah Shin1, Jung Chan Lee2,3*, Heean Shin1, Young‑Jae Cho4 & Hee Chan Kim2
Hematological analysis is essential for patients who are supported by a mechanical circulatory support
(MCS). The laboratory methods used to analyze blood components are conventional and accurate, but
they require a mandatory turn-around-time for laboratory results, and because of toxic substances,
can also be hazardous to analysis workers. Here, a simple and rapid point-of-care device is developed
for the measurement of plasma free hemoglobin (PFHb) and hematocrit (Hct), based on colorimetry.
The device consists of camera module, minimized centrifuge system, and the custom software that
includes the motor control algorithm for the centrifuge system, and the image processing algorithm
for measuring the color components of blood from the images. We show that our device measured
PFHb with a detection limit of 0.75 mg/dL in the range of (0–100) mg/dL, and Hct with a detection
limit of 2.14% in the range of (20–50)%. Our device had a high correlation with the measurement
method generally used in clinical laboratories (PFHb R = 0.999, Hct R = 0.739), and the quantitative
analysis resulted in precision of 1.44 mg/dL for PFHb value of 14.5 mg/dL, 1.36 mg/dL for PFHb value
of 53 mg/dL, and 1.24% for Hct 30%. Also, the device can be measured without any pre-processing
when compared to the clinical laboratory method, so results can be obtained within 5 min (about an
1 h for the clinical laboratory method). Therefore, we conclude that the device can be used for point-
of-care measurement of PFHb and Hct for MCS.
Mechanical circulatory support (MCS) systems refer to the system for artificially circulating a patient’s blood
using mechanical devices, such as a blood pump, and typically includes an extracorporeal membrane oxygenator
(ECMO), a cardiopulmonary bypass (CPB) device, and a ventricular assist device (VAD)1,2. The system consists
of a pump, a blood circuit, and a control system for regulating the flow of the b lood2. However, this MCS system
can cause various hemodynamic problems, such as thrombus generation or hemolysis when a large local pressure
gradient occurs inside the pump, or when the proper rate is not supplied3,4. Hemolysis is a phenomenon in which
red blood cells are damaged and hemoglobin is released into plasma, and it can be diagnosed by measuring the
hemoglobin dissolved in p lasma3,5,6. It may occur in patients supported by the MCS system, and result in death
of the patient by reducing oxygen carrying c apacity7,8. Therefore, in order to prevent such problems, hemoglobin
levels in the plasma (Plasma free hemoglobin, PFHb) should be periodically monitored; and if hemolysis occurs,
the blood circuit should be replaced, or blood transfusion should be quickly p erformed9. Also, commonly used
parameters include hematocrit (Hct) and hemoglobin (Hb) levels8,10. Hct is an important parameter of disease
and dehydration related to total plasma, such as diabetes, venous thrombosis, and peritonitis, which may appear
in patients undergoing mechanical c irculation11. Hb is also an important parameter that can affect the oxygen
transport capacity of the p atient8,12,13. Therefore, periodic monitoring is also essential for these parameters as
much as PFHb levels, since abnormal range of Hct and Hb levels can cause fatal effects on patients, such as
cardiovascular and endocrine d isorders14,15.
To measure these parameters of patients supported with mechanical circulation, the blood samples from
the patient are sent to the laboratory in the hospital, but a turnaround time to obtain the results can takes
approximately 30–90 min. This is because the turnaround time depends on the number of samples, the time
the samples arrive in the laboratory, the sample analysis time, and the relative u rgency16,17. Therefore, it is very
difficult to monitor these parameters of the emergency patient who needs the result in a short period of time.
1
Interdisciplinary Program in Bioengineering, Graduate School, Seoul National University, Seoul 08826, Republic
of Korea. 2Department of Biomedical Engineering, College of Medicine and Institute of Medical and Biological
Engineering, Medical Research Center, Seoul National University, Seoul 03080, Republic of Korea. 3Institute of
BioEngineering, Seoul National University, Seoul 08826, Republic of Korea. 4Division of Pulmonary and Critical
Care Medicine, Department of Internal Medicine, Seoul National University College of Medicine, Seoul National
University Bundang Hospital, Seongnam 13620, Republic of Korea. *email: ljch@snu.ac.kr
Scientific Reports | (2021) 11:3788 | https://doi.org/10.1038/s41598-021-83327-5 1
Vol.:(0123456789)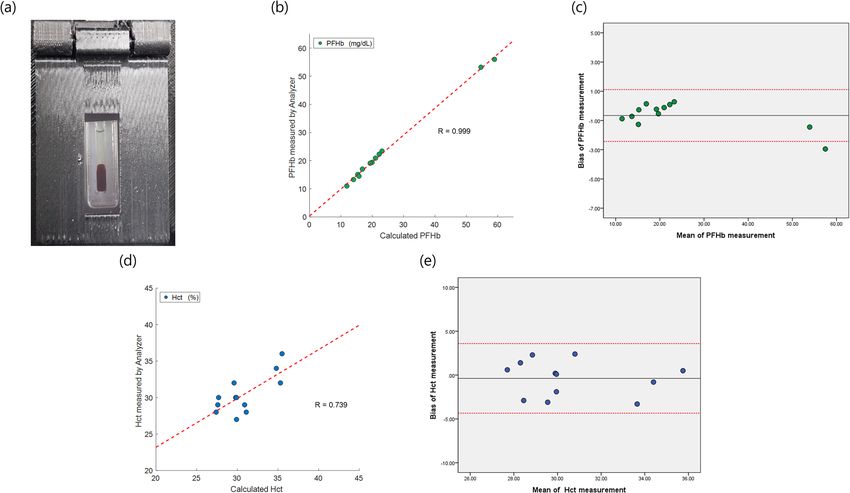
www.nature.com/scientificreports/
Figure 1. Point-of-care device for hematological analysis. (a) Schematic of the device, which is separated into
two parts (main control system and centrifuge system). (b) The prototype of the device. (c) Top view of the
device. The left side shows the touch screen of the main control system. The centrifuge system is on the right
side, and the camera module is placed on a cover above the centrifuge system to obtain a channel image of the
cartridge. (d) The centrifuge system consists of motor, motor holder, rotor, and cartridge holder. A customized
channel cartridge is fitted to the cartridge holder.
Also, the measurement of PFHb and Hb in clinical laboratories requires a pre-analytical process for each assay.
PFHb requires centrifugation because it requires the separation of blood cells and plasma before measurement,
which takes about 10 min18. A common method for Hb measurements is spectroscopy using the cyanide meth-
emoglobin method. This method can be measured at high sensitivity, even in small quantities, but to produce
cyanide hemoglobin, chemical substances such as potassium cyanide (KCN) must be used to lysis red blood
cells for hemoglobin release and induce cyanide. Since KCN is a toxic chemical that can lead to death even in
small quantities, it has the potential to be harmful to the health of the user (the analyst in the laboratory)18,19.
Since the parameters PFHb, Hct, and Hb are the most common and necessary for the diagnosis of blood-
related diseases, various studies have been carried out on how to measure these p arameters20. Recently, there has
been a study on developing a hemolysis diagnosis device using a mobile phone that measures PFHb level using
color difference values18. It has the advantage of being able to diagnose on-site and show the results quickly with
a mobile phone, but it takes more than 10 min to separate plasma and blood cells. In addition, the measure-
ment results may vary depending on the camera performance of the mobile phone and ambient light. Detec-
tion methods for Hb have been developed based on the photothermal response of iron oxide in the H b21. This
method can measure Hb using very small amounts of blood without the specific reagents with high accuracy,
but it requires the use of an expensive laser module that produces a photothermal effect. In addition, it can be
difficult to measure PFHb, because generally the level of the PFHb is lower than the measurement limit (0.12 g/
dL) of this method. Since the mentioned studies can only measure a single parameter, they are not suitable for
patients supported by the MCS systems.
Therefore in this study, we present a device design and method for analyzing the level of hematological
parameters of PFHb, Hct, and Hb that can be applied to the MCS. The device is developed using colorimetric
analysis, based on the fact that as the level of PFHb increases, the color of the plasma becomes r edder22,23. Also,
a customized channel cartridge was used to measure all three parameters with a small amount of blood (35 µL),
and the centrifuge system was integrated into the device, so that centrifugation and analysis could be performed
simultaneously. To verify the performance of the device and its suitability for use in the MCS environment, we
performed the device validation with blood samples obtained during ECMO animal experiments.
Results
Device for point‑of‑care measurement. To develop a portable and stand-alone device for use in MCS
environments, we designed a device that integrates the centrifuge and the main control part (Fig. 1a and Sup-
plementary Fig S1). The centrifuge part consists of: (1) a BLDC motor, which is the main part of the centrifuge
system; (2) a holder to help fix the customized channel cartridge, and to facilitate the acquisition of microchan-
nel images; (3) a light source that provides a constant light intensity inside the device; and (4) a camera module
Scientific Reports | (2021) 11:3788 | https://doi.org/10.1038/s41598-021-83327-5 2
Vol:.(1234567890)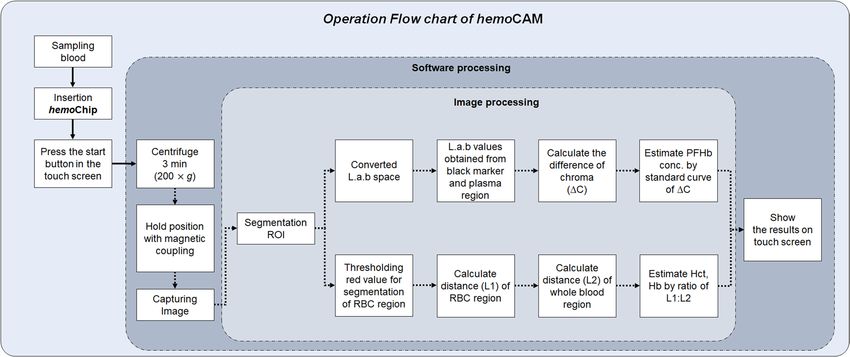
www.nature.com/scientificreports/
Figure 2. Operation flow chart. After inserting the cartridge, the custom software program starts the
centrifugation. At the end of centrifugation, the cartridge holder is stopped by magnetic coupling with the
housing at the specified location for image capture. Image analysis is performed simultaneously with the color
space analysis of PFHb, Hct, and Hb. The analyzed result is printed on the touchscreen, and all of this process is
completed within only 4 min.
(Pi camera ver.2.1) that is compatible with the Raspberry Pi 3. The main control part of the device consists of (1)
a user-friendly touch screen to operate the device, and (2) a Raspberry Pi3 to control the motor, camera module,
and image processing24. The overall dimensions of the device are 290 mm (L) × 115 mm (W) × 130 mm (H),
and 1.1 kg in weight, and the entire housing was fabricated using a 3D printer (Stratasys F123 Series, Stratasys,
Israel) (Fig. 1b,c). The channel cartridge is designed for centrifugation and imaging for a small amount of blood
(Fig. 1d). To operate the device, first the chip is mounted on the holder, and the user presses the start button on
the touch screen, whereupon the centrifugation, acquisition of the image, and the image processing from the
camera are sequentially performed by custom software. The software includes a motor control algorithm for
centrifugation, and an image processing algorithm for analysis. This integrated system allows the analysis to be
performed in a short time, without complicated procedures.
Image processing algorithm for blood analysis. Figure 2 shows the operating flowchart of the entire
system. The image analysis process begins with the segmentation of the region of interest (ROI) in the acquired
image after the centrifugation. Afterwards, the PFHb measurement process and the Hct measurement process
are performed simultaneously in the program.
The ROI at the initial step of image processing is segmented to cover the entire channel of the cartridge. Red,
green, and blue (RGB) values are extracted for each pixel, and the channel is divided into the region of red blood
cells (RBCs) and plasma based on the specific threshold of red color. In order to measure the PFHb level, the
second ROI (2nd ROI) with the size of (20 × 100) pixels is segmented from the previously distinguished plasma
region. RGB values are extracted from this 2nd ROI, and then converted to CIELab values. The CIELab is a
color space defined by the International Commission of Illumination, which makes it possible to closely match
the color difference that the human eye can detect, and the color difference expressed in numerical values in the
color space25. The color components are represented by L *, a *, b *, where, L * is the brightness, a * is the degree
of red and green, and b * is the degree of yellow and blue. L.a.b. values were extracted from the region of black
marker and the plasma in the 2nd ROI, r espectively18,26. The chroma difference (△C) was calculated using the a
* and b * values of the 2nd ROI, and converted to the PFHb levels by the calibration curve (Eq. 1):
�C = (am − as )2 + (bm − bs )2 (1)
where, am and bm are the CIELab components of the region of black markers, and as and bs are the CIELab com-
ponents of the region of the plasma in the 2nd ROI. To exclude the change of the color components caused by
the brightness, the difference between the average brightness value (L) of the black marker obtained from the
calibration images and the brightness value of the black marker obtained from each sample image was added as
an offset value to the chroma difference.
To measure the Hct, the coordinate values of the lowest and the highest row in the pixels of the RBCs region
are obtained, and the distance between the rows (L1) represents the volume of the RBCs. The distance between
the highest row of the plasma region and the lowest row of the red blood cell region is expressed as the length
(L2), which represents the total blood volume in the channel of the cartridge. The Hct level is calculated as the
ratio of L1 and L2 as in Eq. (2):
Scientific Reports | (2021) 11:3788 | https://doi.org/10.1038/s41598-021-83327-5 3
Vol.:(0123456789)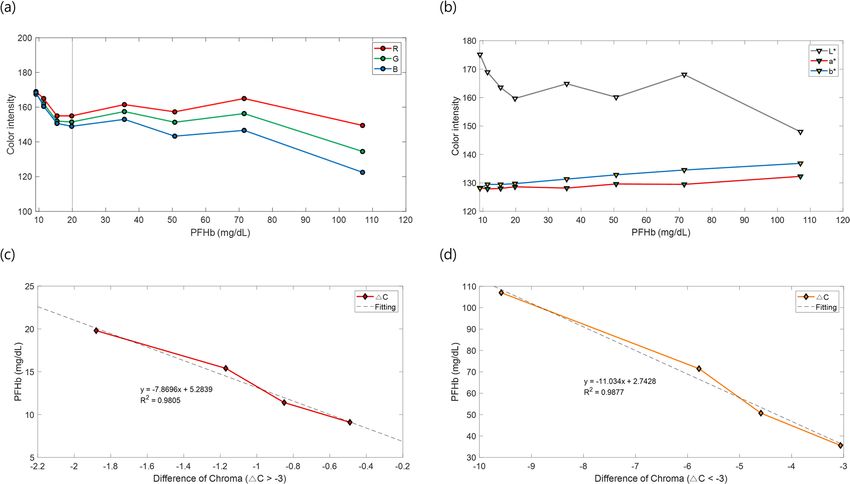
www.nature.com/scientificreports/

                                            Figure 3.  Standard curves of the PFHb levels. (a) Intensities of the RGB color channels according to PFHb
                                            levels. (b) Intensities of the L.a.b. color spaces converted from RGB. (c,d) Standard curves as measured by the
                                            proposed device. (c) Calibration curve in a region where the saturation difference (∆C) is greater than − 3, and
                                            (d) calibration curve in a region where the ∆C is less than − 3.


                                                                                                         L1
                                                                                         Hct(%) =                 ∗ 100                                     (2)
                                                                                                         L2
                                            where, Hct is the percentage of the RBCs volume in the whole blood volume, which is generally the same as
                                            three times the levels of the hemoglobin level. Therefore, we used the Hct method to calculate the hemoglobin
                                            level (Eq. 3):27
                                                                                            Hct(%) = 3 ∗ Hb                                                 (3)

                                            Standard curve for the quantification of plasma color. The method to measure the level of PFHb
                                            is based on the phenomenon that as the hemolysis becomes more severe, the redness of the color of plasma
                                            increases. To obtain a change of the color intensity according to the degree of hemolysis, we induced a severe
                                            hemolysis to the blood sample of swine. The stressed blood was centrifuged to collect only the plasma, and we
                                            adjusted different levels of the PFHb by diluting the collected plasma to obtain the required range in the clinical
                                            setting. Images of each diluted plasma sample were obtained using our device, and a relationship was obtained
                                            by comparing the color intensity of the plasma extracted from the image with the PFHb level measured by the
                                            actual lab test. Figure 3a shows the change of intensities in RGB channels according to PFHb levels. It shows that
                                            the intensity of the red channel is higher than that of the green and blue. Also, Fig. 3b shows the change of inten-
                                            sities in L,a,b color space according to the PFHb levels. The intensity of light is similar to that of the RGB chan-
                                            nel, but a * and b * spaces show a different graph of change, compared to the RGB channel. Therefore, because
                                            the intensity of the light can be interpreted to have a significant effect on the RGB channel, the chroma difference
                                            that reflects only the changes in a* and b* spaces is adopted as a standard curve, to exclude the change of light.
                                            As shown in the results, since the gradient change of the color channel does not have linearity, and varies based
                                            on the specific level of PHFb (20 mg/dL), different calibration curves were obtained based on this. Figure 3c,d
                                            show the results of the PFHb levels according to the chroma differences calculated in the developed device, show
                                            two different calibration curves based on the chroma difference value of − 3, and both have R-squared values
                                            that are greater than 0.98.

                                            Validation of the PFHb, Hct, and Hb values. To validate the performance of the device in the MCS
                                            environment, we performed the evaluation of the device during ECMO animal experiments with the swine
                                            model. Blood samples of about 10 mL were obtained through an artery line, and from the sample, the amount
                                            35 µL required for the developed device was extracted, and the rest of the blood was used to get the gold stand-

          Scientific Reports |   (2021) 11:3788 |                https://doi.org/10.1038/s41598-021-83327-5                                                    4

Vol:.(1234567890)
www.nature.com/scientificreports/
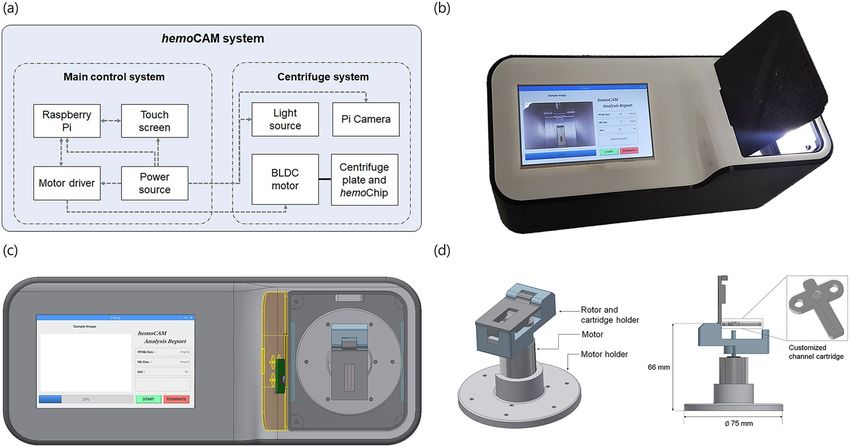
Figure 4. In vitro validation of the hematological analysis during in vivo study of the Venous-arterial
extracorporeal membrane oxygenation (VA-ECMO) system using swine model. (a) Obtained image from the
camera module after centrifugation. (b–e) Comparison results between our device and lab test results. (b)
Linear regression analysis of PFHb levels with slope of 0.958, intercept of 0.366, and R of 0.999. (c) Bland–
Altman analysis of PFHb levels, showing a mean bias of − 0.38 mg/dL and a 95% confidence interval of (− 2.44
to 1.12) mg/dL. (d) Linear regression analysis of Hct levels with slope of 0.669, intercept of 9.812, and R of
0.739. (e) Bland–Altman analysis of Hct levels, showing a mean bias of − 0.38% and a 95% confidence interval of
(− 4.35 to 3.60) %.
Hemoglobin [g/dL]
Sample number 1 2 3 4 5 6 7 8 9 10 11 12
Lab test 9.6 10.1 12 11.2 10.7 10.1 10.8 8 9.5 9.1 9.2 9.6
Proposed POCT device 9.2 9.2 11.8 11.6 11.8 9.9 9.9 9.2 10.4 10 9.1 10.3
Table 1. Comparison results of Hb levels between lab test and the proposed device. The Hb levels of our
device are derived from the Hct results.
ard level of CBC, PFHb, etc. Figure 4a is an image of the channel cartridge obtained after centrifugation and the
analysis algorithm started using this image according to the procedure in Fig. 2.
Blood samples were obtained at one hour intervals during ECMO experiments, and collected blood samples
(n = 12) were compared with the developed device and the lab test results. Our device took about 5 min to get
the results of the analysis. Also, we found that the results measured by our device were very similar to those
of the lab test. Regression analysis and Bland–Altman analysis were performed on the PFHb and Hct to verify
the reliability of our device28. The results of PFHb measured by our device and lab test correlated well (R value
of 0.999, n = 12) (Fig. 4b). In addition, Bland–Altman analysis of the PFHb (Fig. 4c) showed the mean bias is
-0.66, a 95% confidence interval of (− 2.44 to 1.12) %. The correlation coefficient for Hct is 0.739 (Fig. 4d), and
the result is also shown in the 95% confidence interval of all data in the Bland–Altman analysis (Fig. 4e). These
results show that more than 95% of the difference between the results of the device and the lab test is within this
performance criterion. Table 1 also showed the comparison result of Hb levels in our device with those of the
lab tests. Also, the detection limit (LOD) of the developed device was obtained from the regression curve, and
the LODs were 0.75 mg/dL for PFHb, 2.14% for Hct.
The precision was quantified by measuring each blood sample three times repeated, and each blood sample
corresponding to the value of PFHb (14.5 mg/dL, 53 mg/dL) and Hct (30%) was measured separately by our
device and the reference methods. Table 2 shows the precision results, our device measured 15.13 mg/dL (for
PFHb value of 14.5 mg/dL), and the standard deviation (SD) and the coefficient of variation (CV) were 1.44 mg/
dL and 9.49%, respectively. For PFHb value of 53 mg/dL, the device measured 53.08 mg/dL, and SD and CV
Scientific Reports | (2021) 11:3788 | https://doi.org/10.1038/s41598-021-83327-5 5
Vol.:(0123456789)www.nature.com/scientificreports/
Proposed POCT device
Mean SD CV (%)
14.5 15.13 1.44 9.49
PFHb [mg/dL]
53 53.08 1.36 2.56
Hct [%] 30 29.13 1.24 4.26
Table 2. Precision results of the proposed POCT device. Each blood sample was measured repeatedly three
times, and the SD and CV were computed.
were 1.36 and 2.56, respectively. In addition, for Hct 30%, an average 29.13% were measured, and SD and CV
were 1.24% and 4.26%, respectively. Therefore, from these results, the proposed device showed that it is possible
to measure various blood parameters with in precision in the MCS environment.
Discussion
We have described the device that automatically analyzes blood based on colorimetric methods, and found
that the advantage is a portable blood analysis device that can be used to immediately measure in the MCS
environment.
Patients supported with the MCS system are at great risk of developing hematological problems, such as
hemolysis, bleeding, and thrombosis. Due to the importance of blood transfusion, there is device that continu-
ously measure total hemoglobin in the clinical s etting29,30. However, there is no device can simultaneously meas-
ure these diverse hematological parameters, including PFHb, which is necessary for the diagnosis of hemolysis.
In addition, the method performed in the clinical setting takes a long time to obtain the results of the analysis,
and a specialist has to be present who can use the analytical device. Therefore, in this study, we aimed to develop
a device that could rapidly analyze the hematological parameters of patients with the MCS system by considering
user convenience and the time consumed for analysis.
To measure hematological parameters in the clinical, the blood sample must be treated by chemical methods
or centrifugation, and more than (50–200) µL of blood is required to analyze each lab test. We therefore embed-
ded a small centrifuge system into the device to simplify the complicated procedure, and enable immediate
analysis on site. Our device also has the advantage that it can be used without any preprocessing procedures,
because it simply uses the color values of the image with separated blood. In addition, the device can measure
and estimate all three hematological parameters presented in this study with only 35 µL of blood. The measure-
ment range of PFHb is (0–100) mg/dL with a LOD of 0.75 mg/dL; Hct can be measured in the range (20–50)
% with a LOD of 2.14%; and Hb can be estimated by Hct measurement. For each measured parameter (PFHb,
Hct), the Bland–Altman analysis showed that they were within 95% confidence intervals, demonstrating the
high accuracy of our device compared with lab tests. In addition, the quantitative analysis was performed by
comparing the clinical lab tests with the developed device. The spectrophotometric method of measuring PFHb
has a precision of SD 5.2 mg/dL and CV of 9.4% for PFHb value of 5.2 mg/dL in the range of (0.3–62.5) mg/dL.
This method cannot be automated because the technician has to estimate the PFHb by measuring the absorbance
at three wavelengths (380 nm, 415 nm, 450 nm)31. The Hb measuring device ADVIA 120 Hematology analyzer
(Siemens AG, Germany) has an accuracy of SD 0.14 g/dL and CV 0.93% for Hb value of 15 g/dL in the range
of (0.0–22.5) g/dL. This device has very high precision, but requires toxic chemicals and pre-processing of the
sample. However, since our device separates blood cells and plasma with its own centrifuge system, and simply
uses color values to measure blood parameters, it does not require toxic chemicals and pre-processing, and can
measure in a short time (about 5 min). The precision analysis results of the developed device have SD 1.44 mg/
dL and CV 9.49% for PFHb value of 14.5 mg/dL, and SD 1.36 mg/dL and CV 2.56% for PFHb value of 53 mg/
dL. In addition, for Hb value of 10 g/dL derived from Hct 30%, the precision of SD 0.40 g/dL and CV 4.18%.
Therefore, our device has the potential to replace the existing analysis method in MCS environment.
A limitation of this study is that validation was performed for a limited range of PFHb, Hct, and Hb levels.
Since the condition of the animal should be kept stable during the experiment, the blood sample used for the
verification of the proposed device did not deviate significantly from the normal blood range. It is reported that
if PFHb levels rise above a certain hemolysis range (Mild), the risk of acute renal failure and thrombus forma-
tion increases. Therefore, we have shown high accuracy results in this mild hemolysis range of (15–60) mg/dL,
which requires additional attention when monitoring p atients32. Also, it is considered that the accuracy is more
promising at the higher hemolysis range above the mild hemolysis range (~ > 60 mg/dL), because the higher the
concentration of PFHb, the stronger the intensity of the color. In addition, the R value of Hct is relatively lower
than the R value of PFHb. These results can be presumed to be due to the limited range of measurements, since
during animal experiments, the Hct range of blood did not significantly change. However, the normal Hct level
in swine is usually (35–40)%, the results meet the range of Hct < 30% and Hb < 12 g/dL as considered a nemia33,34,
and the results also show that the device has accuracy in this range. Therefore, the performance of our device
could be sufficient to analyze Hct and Hb levels. In addition, in quantitative analysis, the three replicates could be
slightly insufficient, but, in the MCS environment, blood cells are constantly stressed by pumps, making it difficult
to obtain exactly the same value even if several samples are taken within a short time in the same animal. There-
fore, we performed quantitative analysis on only three samples obtained from the same animal that completely
consistent with the laboratory test results. However, since CV has less than 10% even in three replicates, it is
expected that higher precision can be obtained through further studies to improve the performance of the device.
Scientific Reports | (2021) 11:3788 | https://doi.org/10.1038/s41598-021-83327-5 6
Vol:.(1234567890)www.nature.com/scientificreports/
In conclusion, we propose a PFHb and Hct measuring device that can be used rapidly and intuitively in the
MCS environment. The device integrates a centrifuge with a control and analysis system to reduce the time from
sample collection to analysis results. In addition, since PFHb and Hct are measured based on the color informa-
tion of the centrifuged blood image, the technique does not require complicated preprocessing or reagents, and
the device can be easily used without professional training. Therefore, we anticipate that our device will increase
the convenience of diagnosing blood parameters in patients, and also has the potential as an analytical device
that is rapid, easy-to-use, and portable, which meets the needs of the MCS environment. Finally, we intend to
further improve the performance for on-site diagnostic hematological analysis equipment. A possible plan is to
apply colorimetric and spectrophotometry simultaneously to improve measurement resolution, and to measure
more hematological parameters. We also intend to develop a network system using mobile software that enables
measured results and records to be checked, even when users are not in the field.
Methods
Centrifuge system. The centrifuge system consists of a 12 W brushless DC motor (EC-max22, Maxon
Motor, Switzerland) and a motor driver unit (ESCON 50/5 Servo Controller, Maxon Motor, Switzerland) for
stable operation at high s peed35. Chip-on-board LEDs (SY-LD1003, SMG, China) were used to give strong light
intensity at low power (12 V, 100 mA), and resistors (120Ω) were used to deliver a constant current to both LEDs
so that they could maintain a constant light intensity. The two LEDs were placed on both sides of the cartridge
holder, so that the light intensity did not vary depending on the position of the channel cartridge. In addition,
the optical diffusers suitable for the size of the LED were fabricated using acrylic plate (3 mm), so that the light
was not directly transmitted to the channel cartridge and could spread uniformly in the centrifuge chamber. The
camera module (Pi camera ver.2.1) is placed in the lid of the centrifuge chamber, to obtain a front view of the
cartridge (Supplementary Fig. S1 and Fig. S2).
Software process. To carry out the analysis, the user puts the customized channel cartridge into the holder,
and presses the start button on the user interface to activate the entire system. To centrifuge blood, the motor
rotates at about 200 × g (8,000 RPM) for 3 min35. When it slowly decelerates to 100 RPM, the stop signal is trans-
mitted. The holder is then magnetically coupled with the housing, and held in a certain position to capture the
image. When the position of the holder is fixed at the same time as the stop signal, the image of the channel cap-
tured with the camera module is transferred to the image processing algorithm. The image processing process
is described in detail in Sect. 2.2, and when the analysis result is obtained, it is shown on the user interface. The
user interface uses a 5-inch touch screen for easy operation. The custom software was created using Qt creator to
construct a graphical user interface (GUI), and all code, including motor control and image analysis, was written
using Python 3.6.1.
Customized channel cartridge and holder design. The dimensions of the channel cartridge
are 29.5 mm (L) × 24 mm (W) × 6 mm (H), and the dimensions of the channel in the cartridge are 15 mm
(L) × 1.5 mm (W) × 2 mm (H). The channel cartridge was developed specifically for this system, and made of
acrylic material using a laser cutting machine (MYM-1409, MYCNC, Korea). The cartridge consists of three
parts, the lower, middle, and upper parts, and all parts have the same thickness of 2 mm. The hole in the upper
part is the blood chamber, and after the blood is dropped into the chamber, it is covered with a black cap to
prevent the blood from flowing outside (Supplementary Fig. S3). The color of the cap serves as a marker for
chroma difference (△C) when analyzing images. The holes on both sides of the blood chamber are used to fix
the cartridge at a given position in the holder.
The cartridge holder consists of two parts, the lower and the upper part, which parts were manufactured
using a 3D printer (Stratasys F123 Series, Stratasys, Israel). The lower part of the chip holder has a magnet on the
opposite side of the channel, so that the induced magnetic coupling between the housing and the holder can align
the cartridge in the specified location at all times. At the bottom of the channel, the white acrylic plate (25 mm
(L) × 8 mm (W) × 3 mm (H)) is inserted to emphasize the color of the centrifuged plasma. The upper part of the
holder is designed so that the camera can easily acquire the channel image and the ROI (Supplementary Fig. S4).
In addition, the axis of rotation of the motor is aligned with the central axis of the blood chamber in the cartridge,
so that when centrifugal force is applied, all the blood can move to the connected channel.
Calibration method for PFHb levels. Supplementary Figure S5 shows the procedure for the calibration
of PFHb. First, about 50 mL of blood was collected in a conical tube, and stressed for about 1 min using a vortex
stirrer to cause severe hemolysis. We used the centrifuge to obtain only the plasma of the stressed blood, and
this plasma was defined as the reference solution (Original). The original solution was diluted with phosphate
buffer saline (PBS pH 7.4, Gibco BRL, USA) at ratios of (1:10, 1:15, 1:20, 1:30, 1:50, 1:65, 1:85, and 1:100), to
obtain samples within the appropriate range of PFHb level. The samples with more than 1,000 mg/dL of PFHb
were visually very red, and the red color of the solution decreased, depending on the degree of dilution. Diluted
solutions in each ratio were sent to the laboratory to obtain gold standard PFHb levels that
were the basis of
the calibration curve. According to the guideline for the ECMO patients, the hemolysis stages are divided into
four stages based on ECMO patients: Normal (< 30 mg/dL), Mild elevated ((30–50) mg/dL), Moderate elevated
((50–70) mg/dL), and Critical (> 70 mg/dL)32,36.
Animal preparation and blood sample acquisition during MCS. All animal protocols were reviewed
and approved by the Seoul National University Bundang Hospital Institutional Animal Care and Use Commit-
tee (IACUC No. BA1705-223/040-07), and all animal experiments were performed in accordance with relevant
Scientific Reports | (2021) 11:3788 | https://doi.org/10.1038/s41598-021-83327-5 7
Vol.:(0123456789)www.nature.com/scientificreports/
guidelines and regulations. The study is in compliance with ARRIVE guidelines for the in-vivo studies carried
out on animals. Two female swine of 80–100 kg were fasted overnight with free access to water preoperatively.
Premedication consisted of subcutaneous injection of atropine 0.05 mg/kg and intramuscular injection of xyla-
zine 3 mg/kg and zoletil 5 mg/kg. After induction of anesthesia, swine were intubated via mouth with 7.5 mm
endotracheal tube and connected to mechanical ventilator. Anesthesia was maintained with sevoflurane 1% and
supplemented by oxygen 2 L/min with inspired oxygen fraction of 40% and by vecuronium bromide 0.1 mg/kg
for muscle paralysis. Using the Seldinger technique, two 17-Fr cannulae were catheterized into femoral artery and
opposite side femoral vein. After administration of heparin 400 unit/kg, two kinds of ECMO devices, SACCS-01
(CEBIKA, Korea) and Bioconsole-550 (Medtronic, Watford, UK), were connected to the cannulae for the MCS.
Blood samples of 10 ml were obtained via arterial line at every hour after the ECMO devices started. A 35 µL
of each blood sample was used for test of the device, and the remaining blood was used for laboratory tests
covering PFHb, activated clotting time (ACT), arterial blood gas analysis (ABGA), and complete blood count
(CBC), including Hct and Hb. We finally sacrificed the animal with high dose potassium chloride injection by
animal experiment guideline.
Received: 26 February 2020; Accepted: 1 February 2021
References
1. Milano, C. A. & Simeone, A. A. Mechanical circulatory support: Devices, outcomes and complications. Heart Fail. Rev. 18, 35–53.
https://doi.org/10.1007/s10741-012-9303-5 (2013).
2. Shekar, K., Gregory, S. D. & Fraser, J. F. Mechanical circulatory support in the new era: An overview. Crit. Care 20, 66. https://doi.
org/10.1186/s13054-016-1235-3 (2016).
3. Lehle, K. et al. Technical-induced hemolysis in patients with respiratory failure supported with veno-venous ECMO–prevalence
and risk factors. PLoS ONE 10, e0143527. https://doi.org/10.1371/journal.pone.0143527 (2015).
4. Sharma, R. & Khilnani, P. Common problems and troubleshooting on ECMO run. J. Pediatr. Crit. Care 4, 76–81 (2017).
5. Pan, K. C. et al. The meaning of a high plasma free haemoglobin: retrospective review of the prevalence of haemolysis and circuit
thrombosis in an adult ECMO centre over 5 years. Perfusion 31, 223–231. https://doi.org/10.1177/0267659115595282 (2016).
6. Neal, J. R. et al. Using daily plasma-free hemoglobin levels for diagnosis of critical pump thrombus in patients undergoing ECMO
or VAD support. J. Extra Corpor. Technol. 47, 103 (2015).
7. Omar, H. R. et al. Plasma free hemoglobin is an independent predictor of mortality among patients on extracorporeal membrane
oxygenation support. PLoS ONE 10, e0124034. https://doi.org/10.1371/journal.pone.0124034 (2015).
8. Jenks, C. L., Zia, A., Venkataraman, R. & Raman, L. High hemoglobin is an independent risk factor for the development of
hemolysis during pediatric extracorporeal life support. J. Intensiuve Care Med. 34, 259–264. https://doi.org/10.1177/0885066617
708992 (2019).
9. Sidebotham, D. Troubleshooting adult ECMO. J. Extra Corpor. Technol. 43, P27–P32 (2011).
10. Agerstrand, C. L., Burkart, K. M., Abrams, D. C., Bacchetta, M. D. & Brodie, D. Blood conservation in extracorporeal mem-
brane oxygenation for acute respiratory distress syndrome. Ann. Thorac. Surg. 99, 590–595. https://doi.org/10.1016/j.athoracsur
.2014.08.039 (2015).
11. Kim, H. S. & Park, S. Blood transfusion strategies in patients undergoing extracorporeal membrane oxygenation. Korean J. Crit.
Care Med. 32, 22–28. https://doi.org/10.4266/kjccm.2016.00983 (2017).
12. Jenq, C. C. et al. Effect of anemia on prognosis in patients on extracorporeal membrane oxygenation. Artif. Organs 42, 705–713.
https://doi.org/10.1111/aor.13123 (2018).
13. Beutler, E. & Waalen, J. The definition of anemia: what is the lower limit of normal of the blood hemoglobin concentration?. Blood
107, 1747–1750. https://doi.org/10.1182/blood-2005-07-3046 (2006).
14. Smith, A., Hardison, D., Bridges, B. & Pietsch, J. Red blood cell transfusion volume and mortality among patients receiving extra-
corporeal membrane oxygenation. Perfusion 28, 54–60. https://doi.org/10.1177/0267659112457969 (2013).
15. Muszynski, J. A. et al. Red blood cell transfusion practice in pediatric extracorporeal membrane oxygenation support. Crit. Care
Med. 46, e552–e559. https://doi.org/10.1097/CCM.0000000000003086 (2018).
16. Hawkins, R. C. Laboratory turnaround time. Clin. Biochem. Rev. 28, 179–194 (2007).
17. Ko, D. H. et al. Comparison of red blood cell hemolysis using plasma and serum separation tubes for outpatient specimens. Ann.
Lab. Med. 35, 194–197. https://doi.org/10.3343/alm.2015.35.2.194 (2015).
18. Archibong, E., Konnaiyan, K. R., Kaplan, H. & Pyayt, A. A mobile phone-based approach to detection of hemolysis. Biosens.
Bioelectron. 88, 204–209. https://doi.org/10.1016/j.bios.2016.08.030 (2017).
19. Van Kampen, E. & Zijlstra, W. Standardization of hemoglobinometry II. The hemiglobincyanide method. Clin. Chim. Acta. 6,
538–544. https://doi.org/10.1016/0009-8981(61)90145-0 (1961).
20. Bond, M. et al. Chromatography paper as a low-cost medium for accurate spectrophotometric assessment of blood hemoglobin
concentration. Lab. Chip. 13, 2381–2388. https://doi.org/10.1039/c3lc40908b (2013).
21. Kim, U. et al. Capillary-scale direct measurement of hemoglobin concentration of erythrocytes using photothermal angular light
scattering. Biosens. Bioelectron. 74, 469–475. https://doi.org/10.1016/j.bios.2015.06.066 (2015).
22. Yang, X. et al. Simple paper-based test for measuring blood hemoglobin concentration in resource-limited settings. Clin. Chem.
59, 1506–1513. https://doi.org/10.1373/clinchem.2013.204701 (2013).
23. Kim, S. C. et al. A smartphone-based optical platform for colorimetric analysis of microfluidic device. Sensors Actuators B 239,
52–59. https://doi.org/10.1016/j.snb.2016.07.159 (2017).
24. Kim, D. S. et al. LED and CMOS image sensor based hemoglobin concentration measurement technique. Sensors Actuators B 157,
103–109. https://doi.org/10.1016/j.snb.2011.03.032 (2011).
25. Schanda, J. Colorimetry: Understanding the CIE System 25–98 (John Wiley & Sons, New York, 2007).
26. Tyburski, E. A. et al. Disposable platform provides visual and color-based point-of-care anemia self-testing. J. Clin. Invest. 124,
4387–4394. https://doi.org/10.1172/JCI76666 (2014).
27. Kiya, G. T. & Zewudie, F. M. Comparison of three-fold converted hematocrit and micro-hematocrit in pregnant women. PLoS
ONE 14, e0220740. https://doi.org/10.1371/journal.pone.0220740 (2019).
28. Bland, J. M. & Altman, D. Statistical methods for assessing agreement between two methods of clinical measurement. Lancet 327,
307–310. https://doi.org/10.1016/S0140-6736(86)90837-8 (1986).
29. Shah, N., Osea, E. A. & Martines, G. J. Accuracy of noninvasive hemoglobin and invasive point-of-care hemoglobin testing com-
pared with a laboratory analyzer. Int. J. Lab. Hematol. 36, 56–61. https://doi.org/10.1111/ijlh.12118 (2014).
Scientific Reports | (2021) 11:3788 | https://doi.org/10.1038/s41598-021-83327-5 8
Vol:.(1234567890)www.nature.com/scientificreports/
30. Hiscock, R., Kumar, D. & Simmons, S. W. Systematic review and meta-analysis of method comparison studies of Masimo pulse
co-oximeters (Radical-7TM or Pronto-7TM) and HemoCue® absorption spectrometers (B-Hemoglobin or 201+) with laboratory
haemoglobin estimation. Anaesth. Intensive Care. 43, 341–350. https://doi.org/10.1177/0310057X1504300310 (2015).
31. Chung, H. J. et al. Automation of Harboe method for the measurement of plasma free hemoglobin. J. Clin. Lab. Anal. 34(6), e23242.
https://doi.org/10.1002/jcla.23242 (2020).
32. Brogan, T. V. et al. Extracorporeal Life Support: The ELSO Red BOOK (Extracorporeal Life Support Organization, Ann Arbor, 2017).
33. Swindle, M. M. & Smith, A. C. Swine in the Laboratory: Surgery, Anesthesia, Imaging, and Experimental Techniques 1–38 (CRC
Press, Boca Raton, 2015).
34. Hannon, J. P. Hemorrhage and Hemorrhagic Shock in Swine: A Review (Letterman Army Institute of Research, San Francisco, 1989).
35. Yang, X., Forouzan, O., Brown, T. P. & Shevkoplyas, S. S. Integrated separation of blood plasma from whole blood for microfluidic
paper-based analytical devices. Lab. Chip. 12, 274–280. https://doi.org/10.1039/c1lc20803a (2012).
36. Dolci, A. & Panteghini, M. Harmonization of automated hemolysis index assessment and use: is it possible?. Clin. Chim. Acta.
432, 38–43. https://doi.org/10.1016/j.cca.2013.10.012 (2014).
Acknowledgements
This study was supported by The Korean Health Technology R&D Project of the Ministry of Health & Welfare,
Republic of Korea (HW20C2066, HI14C0746, HI14C0559, and HI13C1468).
Author contributions
Conception and design of study: D.A.S., H.C.K., J.C.L., Acquisition of data: D.A.S., H.S., Data processing and
interpretations: D.A.S., H.S., J.C.L., Drafting of manuscript: D.A.S., Critical revision: Y.J.C., H.C.K., J.C.L. All
authors read and approved the final manuscript.
Competing interests
The authors declare no competing interests.
Additional information
Supplementary Information The online version contains supplementary material available at https://doi.
org/10.1038/s41598-021-83327-5.
Correspondence and requests for materials should be addressed to J.C.L.
Reprints and permissions information is available at www.nature.com/reprints.
Publisher’s note Springer Nature remains neutral with regard to jurisdictional claims in published maps and
institutional affiliations.
Open Access This article is licensed under a Creative Commons Attribution 4.0 International
License, which permits use, sharing, adaptation, distribution and reproduction in any medium or
format, as long as you give appropriate credit to the original author(s) and the source, provide a link to the
Creative Commons licence, and indicate if changes were made. The images or other third party material in this
article are included in the article’s Creative Commons licence, unless indicated otherwise in a credit line to the
material. If material is not included in the article’s Creative Commons licence and your intended use is not
permitted by statutory regulation or exceeds the permitted use, you will need to obtain permission directly from
the copyright holder. To view a copy of this licence, visit http://creativecommons.org/licenses/by/4.0/.
© The Author(s) 2021
Scientific Reports | (2021) 11:3788 | https://doi.org/10.1038/s41598-021-83327-5 9
Vol.:(0123456789)You can also read