For the period ending: December 31, 2017
←
→
Page content transcription
If your browser does not render page correctly, please read the page content below
For the period ending: December 31, 2017

                                           303 Congress Street
                                            Boston, MA 02210
                                                 617.723.6400
                                             www.dalbar.com
CONTENTS
Introduction ........................................................................................ 3
Anatomy of Investor Returns .............................................................. 5
Executive Summary........................................................................... 10
2017 Year in Review.......................................................................... 12
Taking a Closer Look ......................................................................... 16
Short-Term Focus and Market Timing ............................................... 18
Behind the Numbers: Investor Psychology… ..................................... 24
Year-by-Year Investor Returns .......................................................... 26
Glossary ............................................................................................ 28
QAIB Products ................................................................................... 31
Investor Return Calculation: An Example… ....................................... 33
Rights of Usage and Sourcing Information ........................................ 35

© 2018                         Quantitative Analysis of Investor Behavior                              2

Introduction
Since 1994, DALBAR’s Quantitative Analysis of Investor Behavior (QAIB) has
measured the effects of investor decisions to buy, sell and switch into and out of
mutual funds over short and long-term timeframes. These effects are measured
from the perspective of the investor and do not represent the performance of the
investments themselves. The results consistently show that the average investor
earns less – in many cases, much less – than mutual fund performance reports
would suggest.

The goal of QAIB is to improve performance of both independent investors and
financial advisors by managing behaviors that cause investors to act imprudently.
QAIB offers guidance on how and where investor behaviors can be improved.
QAIB 2018 examines real investor returns in nearly 30 different categories of
funds. The analysis covers the 30-year period to December 31, 2017, which
encompasses the aftermath of the crash of 1987, the drop at the turn of the
millennium, the crash of 2008, plus recovery periods leading up to the most
recent bull market. This year’s report examines the results of investor behavior
during a booming 2017.

About DALBAR, Inc.
DALBAR, Inc. is the financial community’s leading independent expert for
evaluating, auditing and rating business practices, customer performance,
product quality and service. Launched in 1976, DALBAR has earned the recognition
for consistent and unbiased evaluations of investment companies, registered
investment advisers, insurance companies, broker/dealers, retirement plan
providers and financial professionals. DALBAR awards are recognized as marks of
excellence in the financial community.

Methodology
QAIB uses data from the Investment Company Institute (ICI), Standard & Poor’s,
Bloomberg Barclays Indices and proprietary sources to compare mutual fund
investor returns to an appropriate set of benchmarks. Covering the period from
January 1, 1988 to December 31, 2017, the study utilizes mutual fund sales,
redemptions and exchanges each month as the measure of investor behavior.
These behaviors reflect the “Average Investor.” Based on this behavior, the

© 2018                   Quantitative Analysis of Investor Behavior                3
analysis calculates the “average investor return” for various periods. These
results are then compared to the returns of respective indices.

A glossary of terms and examples of how the calculations are performed can be
found in the Appendices section of this report.

The QAIB Benchmark and Rights of Usage
Investor returns, retention and other industry data presented in this report can
be used as benchmarks to assess investor performance in specific situations.
Among other scenarios, QAIB has been used to compare investor returns in
individual mutual funds and variable annuities, as well as for client bases and in
retirement plans. Please see the “Rights of Usage” section in the Appendices for
more information and appropriate citation language.

Visit the QAIB Store!

Renowned investor behavior research is now at your fingertips! Visit the QAIB
Store at www.QAIB.com for images, infographics and data feeds from the 2018
study. You can find a menu of additional products on page 31 of this report.

For questions, please contact Cory Clark at cclark@dalbar.com or 617-624-7100 for
additional questions

© 2018                    Quantitative Analysis of Investor Behavior                 4
Anatomy of Investor Returns
                                              …the story of Harry
Investment returns have been simplistically reduced to a single percentage that
disguises the incredibly complex issues that investors experience. This article is
intended to shed some light on these complexities. It shows how deceptive the
most frequently published investment returns are.

These complexities are presented in the form of a narrative of an investor, Harry,
and his adventures with his retirement plan.

What happens to real people: Harry’s Story

 A $500 payroll deduction is automatically put into Harry’s 401(k) each month.
 Unfortunately, this is $500 less to pay bills and for the essentials and pleasures
 of life. But this is worth it because it means a more comfortable retirement for
 Harry and his family when that time comes.

 Harry’s monthly pay stub holds some good news.                  It is often
 The $500 deduction is a lot less painful because his            recommended that one
 employer sweetens the deal with an additional $250,             should aim to replace
 plus there are no taxes withheld! The $500 payroll              75% of their pre-
 deduction instantly becomes a $750 contribution to              retirement income.
 Harry’s retirement, with no taxes taken out.

 There is even more good news at the end of the quarter. Harry gets a statement
 showing his three monthly investments are now worth $2,350, but
 contributions only add up to $2,250! Another $100 appeared as though it was
 by magic.

                                  Harry is also delighted to see on the statement
                                  that the markets had gone up by 10% in the
                                  quarter. Compare that to a CD that earned a
                                  measly 0.1%! That would explain the magical
                                  $100.

                                  But wait a minute Harry thought, 10% of $2,250 is
                                  $250. Why did Harry’s $2,250 only go up by $100?

© 2018                   Quantitative Analysis of Investor Behavior                   5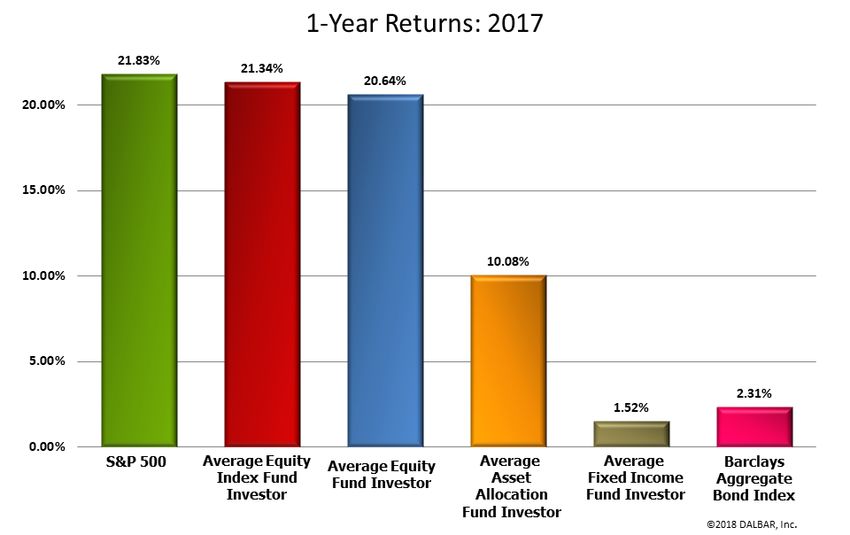
Harry figured that this difference could amount to a great deal of money in 20
 years when he retires so he was not happy and called the number on his
 statement for an explanation. Harry learned the important lesson that while the
 balance of $2,350 was his, other figures had nothing to do with his account.

 The 10% return applied only to investments that were in place from the start of
 the quarter to the end of the quarter and since his came in at different times
 the magical money was not as much. Harry’s total contribution for the quarter
 would have to be made on the first day of the quarter for the entire 10% to
 apply. Even if Harry had the money, this day one investment could not be done
 due to constraints of the 401(k) plan. Harry concluded that the 10% really did
 not apply to his account, even though it was on his statement!

 Additionally, Harry found from the friendly representative at the number on his
 statement that there were a number of other factors that were not shown,
 which also lowered the magical figure. He was totally confused after learning
 that his money was allocated and not fully invested, that there were expenses
 not shown on his statement and that he was paying trading costs and fees that
 were only shown in legal disclosures.

 The 10% return on his statement did not reflect the fact that only 65% of his
 account was invested in comparable stocks. The remaining 35% was held in low
 yielding bonds and in cash. This means that it would be impossible to earn the
 10% on over one third of his money! The representative explained that this is
 done to limit his losses when the markets went down. Harry saw the benefit but
 still felt that the 10% on his statement was misleading. By this time Harry had
 been on the phone for half an hour and the representative was becoming less
 friendly.

 Harry then tried to understand what the expenses were and why they were not
 shown on his statement. Harry was comfortable after learning that the
 expenses covered items like administrative costs, record keeping, managing
 investments, and for the services of an advisor. He remained concerned that
 these expenses were not reflected in the 10% return shown on his statement.
 He asked the representative,

              “Why show the 10% if you know it is wrong?”
 The representative’s frustration was growing.

© 2018                 Quantitative Analysis of Investor Behavior              6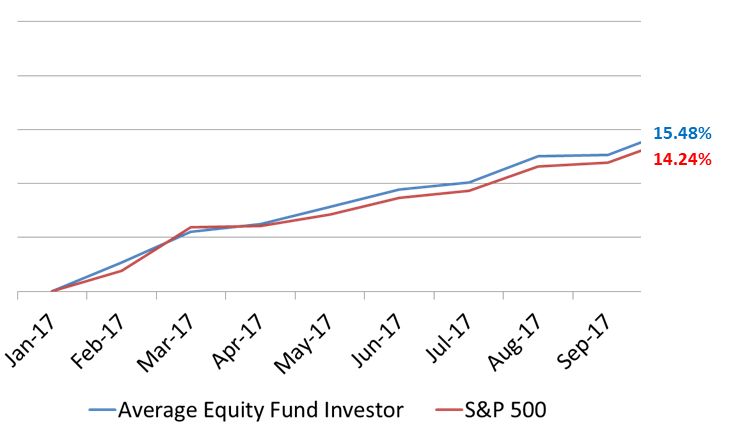
Harry was not giving up because he wanted to get the whole story so he asked
 about the trading costs. He immediately understood that there was buying and
 selling of investments and that commissions had to be paid when transactions
 occurred. Harry was becoming angry when he realized that these commissions
 were not reflected in the 10% on his statement! It is all the representative could
 do to calm Harry down. His concerns had grown to accusations of illegal
 activity!

 Harry had to hear the end of this. What additional fees apply to his account that
 are not included in the elusive 10%? Harry learned that there were fees that
 apply if he were to take out a loan or had a personal hardship and had to
 withdraw some funds. Harry thought this unfair, but it would be his choice to
 take the loan or withdrawal.

 Harry learned about something else that he thought would answer many of his
 concerns but there was yet another cost and burden on him. The
 representative described the self-directed brokerage account. This would mean
 that Harry need not use the low yielding investments if he chose not to. He
 could use very low expense investments like ETFs and Index funds. The trading
 commissions would be lower. Harry was not so happy to find that the self-
 directed brokerage meant he would have to actually enter every investment
 himself and if he made a mistake it would be his loss. Furthermore, the cost of
 this type of account would exceed what Harry was currently paying. By now
 Harry and the representative had been on the phone for an hour and a half and
 both were totally stressed out.

 Harry thanked the representative who had confused him and decided to be
 thankful for the magical $100 and forget about the possibility of earning any
 more.

 Life went on for Harry until one statement showed that his balance was actually
 less than it was on the previous statement. By now Harry’s balance had grown
 to $50,000 on the previous statement and the new statement showed only
 $47,500. How was this possible? Harry had not withdrawn any money. In fact
 $2,250 was added to his account. To make matters worse, the market had gone
 down by 4% but Harry’s balance went down by 5%.

 Harry again called the number on the statement and learned that the expenses,
 trading costs and fees were being incurred, even when Harry’s account was
 losing money.

© 2018                  Quantitative Analysis of Investor Behavior                7
What was Harry to do? By this time he realized that he was not earning as much
 as was possible but the taxes and penalties of withdrawing his money made it
 impractical… He was trapped!

 Harry was now committed to avoiding future surprises. He wanted to
 understand what might be in store for him in the future. What if he changes
 jobs? What happens when he retires?

 By this time Harry had become famous in the phone center. He had won the
 contest multiple times for time spent on the phone! But Harry remained
 undaunted.

 Harry found that changing jobs could cost him money.

 First was the “unvested” portion of his account that he would lose. At the time
 Harry made the inquiry, his unvested balance was $25,000. Yes, that was a
 nasty surprise that changing jobs would cost $25,000. But that’s not all. If Harry
 decided to take the money out of the old employer’s plan, he would owe taxes
 on that money plus a 10% penalty unless it was reinvested in 60 days.

 The taxes and penalties could be avoided if the new employer permitted Harry
 to invest the money in the new employer’s plan. This is a great solution if the
 new employer’s plan is as good and cost no more than the old plan.

 The other option is to shop for a “Rollover IRA”. Harry could transfer his plan
 money into this account, avoid the taxes and penalties and never have to worry
 about future job changes. The problem here, Harry found out, is that these
 “Rollover IRAs” could cost as much as twice as much as the 401(k) plan.

 Harry kept wondering,

          “When does all this end?” Unfortunately, the answer was:
                                 “Not yet.”
   When Harry decides to retire he will face a new set of issues. With some
   careful planning beforehand, Harry can avoid some of these.

   The first problem Harry will face is taxes. As currently configured (the usual
   practice), Harry will owe taxes on every dollar he withdraws from his
   retirement plan. This is treated as ordinary income and is subject to
   withholding, just like his paycheck is. Ouch!

© 2018                   Quantitative Analysis of Investor Behavior                   8
But there is an alternative that Harry can use to avoid this nasty retirement surprise. Instead of using a regular 401(k), Harry could use a Roth 401(k) if his employer offers it. With the Roth, Harry pays the taxes on the contributions and at retirement can withdraw the contributions and all the appreciation tax free. This is an attractive option if Harry is willing to pay the taxes along the way because all the growth (the magical money) is tax free! The next problem is outliving his retirement funds. Surely, if Harry decides to spend like a drunken sailor after he retires, his funds won’t last very long. But even if Harry controls his spending, he could live to use up his entire account. In addition to controlled spending, two other actions can help. Harry can invest wisely so that his retirement funds continue to grow during his retirement years. This usually requires an investment strategy that is connected with the spending controls. Such an arrangement adjusts spending to what investments can sustain. Another action is for Harry to create his personal pension plan that will continue to pay him for as long as he lives. This is called an annuity and is more expensive than the sustainable spending described above. However, it eliminates the risk of running out of funds. © 2018 Quantitative Analysis of Investor Behavior 9
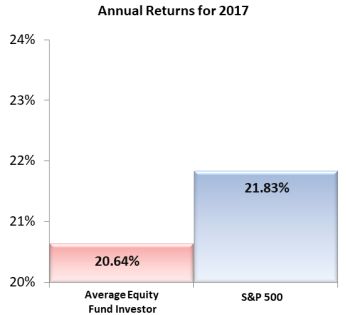
Executive Summary In 2017, the Average Equity Fund Investor underperformed the S&P 500 by 1.19% (20.64% vs. 21.83%). The Average Equity Fund Investor was outperforming the S&P 500 by a slim margin entering the month of October before underperforming the final 3 months of the year. The Average Equity Fund Investor’s underperformance can be entirely attributed to the 4th quarter. Two of the three best performing months for the S&P 500 (October and November) coincided with relatively large net outflows of assets. The Average Equity Index Fund Investor underperformed the S&P 500 by 0.49% (21.34% vs. 21.83%) but outperformed the Average Equity Fund Investor by 0.70% (21.34% vs. 20.64%). In 2017, the Average Fixed Income Fund Investor underperformed the BloombergBarclays Aggregate Bond Index by 0.79 (1.52% vs. 2.31%). The Average Asset Allocation Fund Investor earned a return of 10.08 in 2017. Just about splitting the difference between the Average Equity Fund Investor return (20.64%) and the Average Fixed Income Fund Investor return (1.52%). When examining funds by capitalization and style, the Average Growth Fund Investor emerged as the clear winner. The Average Large Cap Growth Fund Investor earned 29.45%, while the Average Small Cap Growth Fund Investor earned 25.43%, and the Average Mid Cap Growth Investor earned 24.25% for the year. All growth fund investors outperformed all value and blend investors. The Average Small Cap Value Fund Investor was the worst performing capitalization and style fund investor, earning only 10.82% on the year. This performance was only marginally better than the Average Asset Allocation Investor (whose portfolios are comprised of both equity and fixed income). When examining specific sector funds, the Average Technology Fund Investor (35.68%) and the Average Healthcare Fund Investor (23.45%) emerged as the highest performing of all the sector fund investors. Investments traditionally associated with safety were out of favor in 2017 and consequently the Average Natural Resources Fund Investor, Average Utilities Fund Investor and Average Precious Metals Fund Investor were the 3 poorest performing sector fund investors. © 2018 Quantitative Analysis of Investor Behavior 10
The Average Target Date Fund Investor outperformed the Average Asset Allocation
Fund Investor by 6.84% (16.92% vs. 10.08%). This can be explained in part by the
fact that net cash flow for Target Date Funds was decidedly positive throughout the
year while cash flows of asset allocation funds was mostly negative despite the bull
market.
Equity fund Retention Rates rose by almost 3 months, from an average of 3.80 years
in 2016, to an average of 4.03 years in 2017.
Fixed income fund Retention Rates rose over 4 months, from an average of 3.09
years in 2016, to an average of 3.45 years in 2017.
Asset allocation fund Retention Rates rose by over six months in 2017, pushing from
4.09 years to 4.65 years.
Average
Average Average Asset Bloomberg-
Fixed
Equity Fund Allocation Inflation S&P 500 Barclays
Income Fund
Investor Fund Investor Aggregate
Investor
Bond Index
(%) (%) (%) (%) (%)
(%)
20 Year 5.29 0.44 2.58 2.15 7.20 4.60
10 Year 4.88 0.48 2.52 1.64 8.50 3.31
5 Year 10.93 -0.40 5.41 1.48 15.79 1.27
3 Year 8.12 -0.05 3.85 1.71 11.41 1.40
12 Month 20.64 1.52 10.08 2.11 21.83 2.31
© 2018 Quantitative Analysis of Investor Behavior 112017 Year in Review
Q1 – Racing out of the Gate
Investors were greeted to the year 2017 with an S&P return of nearly 2% in January and
then almost 4% in February. As it turned out, the first 2 months of 2017 for investor
returns were a mirror image of the last 2 months of 2016 for the S&P 500. In January, the
S&P 500 was similar to the previous month’s return (only -0.08% lower than December)
but the Average Equity Fund Investor was able to improve its gains by over 2% and
outperform the index and the Average Index Investor.
The previous year, the market rose steadily in November and December despite
uncertainty stemming from the recent presidential election. Equity investors were
burned in the fourth quarter, underperforming the S&P index in all 3 months.
In 2017, the Average Equity Fund Investor was able to outperform the S&P 500 in 2 out
of the 3 months. The markets were calm throughout the 1st quarter, displaying a lull in
volatility that began the previous November and that would extend until the end of the
year.1
1
See CBOE Market Volatility Index (VIX)
© 2018 Quantitative Analysis of Investor Behavior 12Q2 – Slow and Steady The markets would continue to rise in the second quarter without any significant disruptions. Each month saw slow and steady gains of the equity markets while volatility remained low. The Average Equity Fund Investor and the Average Equity Index Fund Investor both outperformed the S&P 500 in April. It would be the second straight month that they would do so. The Average Equity Fund Investor would continue to outperform the S&P for the 3rd month in a row in May while the Average Equity Index Fund Investor would slightly lag the index that month. June was a relatively flat month where the Average Equity Index Fund Investor prevailed slightly over the overall Average Equity Fund Investor and the S&P 500. Q3 – Average Investors Leading the Race The third quarter would see two months where the S&P 500 gained 2.06% and a flat month sandwiched in between. Volatility remained low, so there were very few market swings to help or harm the Average Investor’s return. The Average Equity Fund Investor return was tightly correlated to the S&P 500 during the quarter and by the end of September had not significantly trailed the S&P 500 since February (trailed the S&P 500 by -.04% in June and -0.18% in August and outperformed S&P 500 in March, April, May July and September). © 2018 Quantitative Analysis of Investor Behavior 13
Heading into the 4th quarter, the Average Equity Fund Investor was standing strong with
a YTD return of 15.48% vs and S&P 500 YTD return of 14.24%. The Average Equity Fund
Investor was on the verge of outperforming the market for a calendar year for the first
time since 2009 when the S&P 500 advanced 26.46% and the Average Equity Fund
Investor earned a whopping 32.10%.

Q4 – Average Investor Can’t Hang on for the Win
The fourth quarter of each year has been a historically poor period for the Average
Investor. In 2017, the Average Equity Fund Investor struggled in the fourth quarter for
the second straight year, underperforming the S&P all 3 months and ultimately
underperformed the major equity index for the year. It was a better quarter to be an
equity index investor, as the Average Equity Index Fund Investor outperformed the
Average Equity Fund Investor in all three months and significantly in December.

© 2018                     Quantitative Analysis of Investor Behavior                     14
The year 2017 was a year friendly to the Average Investor. The trend from the previous
year continued and investors had little to shake their confidence along the way. Gains
were steady, volatility was low, and the Average Equity Fund Investor left very little on
the table in 2017.

© 2018                     Quantitative Analysis of Investor Behavior                   15
Taking a Closer Look
                                         … Examining the Various Average Fund Investors

For years, DALBAR’s QAIB report has
looked at equity and fixed income fund
investors to see how their actual
market gain/loss compares to reported
market returns. In 2008, DALBAR
introduced       the   Average    Asset
Allocation Investor, covering funds
that invest in a mix of equity and fixed
income securities. In 2018, DALBAR is
introducing for the first time Average
Fund Investors for various fund
classifications.

With valuations fair to high2,
anticipation of lowered taxes, and the
market      presumably     anticipating
economic expansion, growth stocks
ruled the day in 2017. Large cap
growth fund investors earned almost
30% on the year, beating the S&P 500
by a wide margin (29.45% vs. 21.83%).

2
    According to YCarts.com, average P/E ratios of the S&P 500 in 2017 were in the range of 23-24.

© 2018                          Quantitative Analysis of Investor Behavior                       16
The average technology fund investor led all investor categories for 2017 and earned 10% more than any other sector fund investor. Sectors associated with safety such as precious metals and natural resources were at the bottom of the list. © 2018 Quantitative Analysis of Investor Behavior 17
Short-Term Focus and Market Timing
Irrational investor behavior is typically triggered by some sort of stimulus. A geo-
political event, previous market experiences, news stories, or a hot tip from a
colleague can distract an investor from his or her long-term goal. But investor
underperformance emanates only partially from poor decision-making; other
factors such as fees, the need for cash, and the unavailability of funds to invest
can all lead to an investor lagging the overall market.

For example, if Harry has to withdraw some portion of his investments to cover
medical costs. That can hardly be considered irrational investor behavior. Harry
may miss a market advance that will plague his portfolio for years to come but it
was not due to any of the psychological factors we have discussed over the years.

Or perhaps Harry does not have money to invest due to his personal
circumstances, but when he gets his Federal tax return he plans to put it all into
his IRA. If the market tanks in the first quarter before Harry contributes his tax
refund, he looks like a genius. If he misses a 1st quarter bull run, it looks like he
timed the market all wrong. The truth was that Harry did what he could do and
was at the mercy of Lady Luck.

While underperformance is not due entirely to irrational investor behavior, there
are two behaviors for which evidence shows time and time again that fall outside
of what would be generally accepted as a prudent investment strategy. The
behaviors are the tendency to move into and out of investments too frequently
and the tendency to time the market.

The data shows that the average mutual fund investor has not stayed invested for
a long enough period of time to execute a long term strategy. In fact, they
typically stay invested for just a fraction of a market cycle. QAIB has also shown
numerous instances in which market conditions create a shift in cash flows which
run counter to the eventual direction of the market.

© 2018                    Quantitative Analysis of Investor Behavior                    18
Retention Rates
Over the past 20 years, equity mutual fund investors have seldom managed to
stay invested for more than 4 years. When they have done so, it has generally
been during periods of bull markets. Equity fund retention rates surpassed the
four year mark from 2004-2006 and would do so again in 2013-2015. In 2016,
equity fund retention rates dipped below 4 years to 3.80 years but in 2017
rebounded back over the 4-year mark (4.03 yrs.).

After exhibiting retention rates below the 3-year mark 2013-2015, the Average
Fixed Income Fund Investor surpassed the 3.0 year mark in 2016 (3.09 yrs.) and
continued to forge higher in 2017 to its highest Retention Rate (3.45 yrs.) since
2006.

Asset allocation mutual fund investors have generally stayed invested longer
than their equity and fixed income investor counterparts. Asset allocation fund
retention rates have stood above the four year mark for eight straight years. In
2016, asset allocation fund Retention Rates decreased to 4.09 years, nearly falling
below the 4.0 year mark for the first time since 2008. However, in 2017, the

© 2018                   Quantitative Analysis of Investor Behavior              19
Average Asset Allocation Investor followed the trend of other Average Investors
and stayed put. Retention Rates for the 2017 Average Asset Allocation Investor
rebounded to the levels before 2016 where fund redemptions accelerated.

The market conditions of 2017 caused the expected effect on fund Retention
Rates. Investors tend to withdraw funds when markets decline or there is
imminent fear of a crash or correction. The effect of the increased withdrawals is
to reduce retention rates. The Retention Rates plummeted in 2016 as the
Average Investor was not comfortable where they stood. The Average Investor
was more comfortable in 2017 and for good reason, the markets gave no reason
to be concerned, so investors hung on and made their money right alongside the
market indices.

© 2018                   Quantitative Analysis of Investor Behavior             20
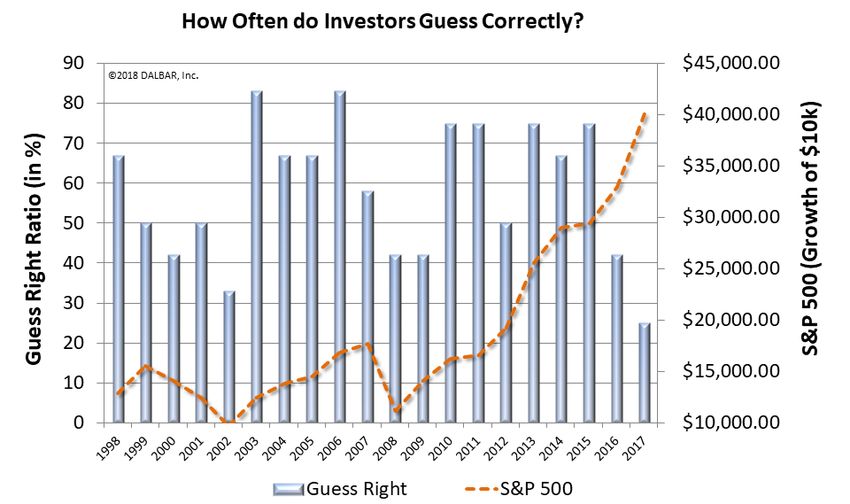
Market Timing
The retention rate data for equity, fixed income and asset allocation mutual funds
strongly suggests that over the long-term, investors lack the patience to stay
invested in any one fund for much more than four years. Even when the markets
are in perfect harmony, which is how one might categorize 2017, Retention Rates
still do not suggest sufficient holding periods. Investors displayed more patience
in 2017, but only from a relative standpoint. Over a quarter of equity funds’
assets are being redeemed and replaced with new purchases each year on
average over the last 20 years.

Low retention rates are not a result of investors investing their money for a few
years and then divesting forever. The growth of overall mutual fund assets over
time suggests much of the money being redeemed is moving from one
investment to another. It can be theorized that much of the money movement
suppressing Retention Rates can be attributed to the Average Investor’s tactical
strategies and market timing.

DALBAR continues to analyze the investors’ market timing successes and failures
through their purchases and sales. This form of analysis, known as the Guess
Right Ratio, examines fund inflows and outflows to determine how often
investors correctly anticipate the direction of the market the following month.
Investors guess right when a net inflow is followed by a market gain, or a net
outflow is followed by a decline.

Investors have guessed right 50% of the time or more 14 out of the last 20 years,
but 2017 was not one of them. Unfortunately for the Average Investor, guessing
right did not produce superior gains over the years because the dollar volume of
bad guesses exceeds the volume of right guesses. Even one month of wrong
guesses can wipe out several months of right ones.

In 2017, investors guessed right only 3 out of the 12 months (25%) despite a
consistently up-trending market.

© 2018                   Quantitative Analysis of Investor Behavior                 21
While Retention Rates suggest a decrease in redemptions, total redemptions
actually outweighed total sales in 8 out of the 12 months. So while investors were
less likely to redeem their funds, they were even less likely to add more funds.
Perhaps this signifies distrust with the current bull market where investors are
unwilling to continue investing at the same rate during all-time market highs.
Fortunately for the Average Investor, this ostensible trepidation did not lead to
significant underperformance, as the Average Equity Fund Investor only
underperformed the S&P 500 by 1.19%.

As we examined earlier
in this report, the 1.19%
underperformance         by
the Average Equity Fund
Investor          occurred
primarily in the 4th
quarter. In October, the
S&P was up over 2.3%,
the second best month
of the year
to that point. At that time, net fund flows were at its second lowest level of the
year. Money flows and the market direction were uncorrelated. That continued
to an even greater extent in November, as net outflows continued to accelerate
and the market continued to rise at an even greater pace. For the second straight
month, the second best month of the year (November surpassed October for that

© 2018                   Quantitative Analysis of Investor Behavior             22
title) coincided with the second greatest outflow of the year (November
surpassed October for that title as well).
December was (and typically always is) the month that experiences the largest
net inflow of funds. Unfortunately when investors were piling money back into
mutual funds, the S&P 500 was having an unremarkable month in comparison to
the other months of the year. In December, net inflows were far and away
greater than any other month. December’s +0.29% net inflow was nearly triple
the second largest inflow that took place in June. However the S&P 500 earned
only 1.11%, below its average monthly return of 1.66% in 2017.

                         Month-by-Month Look at
                       Equity Fund Investors in 2017
                                         Average
                       Net Inflow/    Equity Fund        S&P 500     Investor
             Month
                          Outflow        Investor         Return         Gap
                                           Return
            Jan           -0.08%          2.67%          1.90%        0.77%
            Feb           0.05%           2.80%          3.97%       -1.17%
            Mar           -0.03%          0.67%          0.12%        0.55%
            Apr           -0.12%          1.48%          1.03%        0.45%
            May           0.04%           1.51%          1.41%        0.10%
            Jun           0.10%           0.59%          0.62%       -0.03%
            Jul           -0.12%          2.21%          2.06%        0.15%
            Aug           -0.16%          0.13%          0.31%       -0.18%
            Sep           -0.05%          2.15%          2.06%        0.09%
            Oct           -0.14%          1.93%          2.33%       -0.40%
            Nov           -0.15%          2.11%          3.07%       -0.96%
            Dec           0.29%           0.29%          1.11%       -0.82%

© 2018                  Quantitative Analysis of Investor Behavior              23
BEHIND THE NUMBERS…
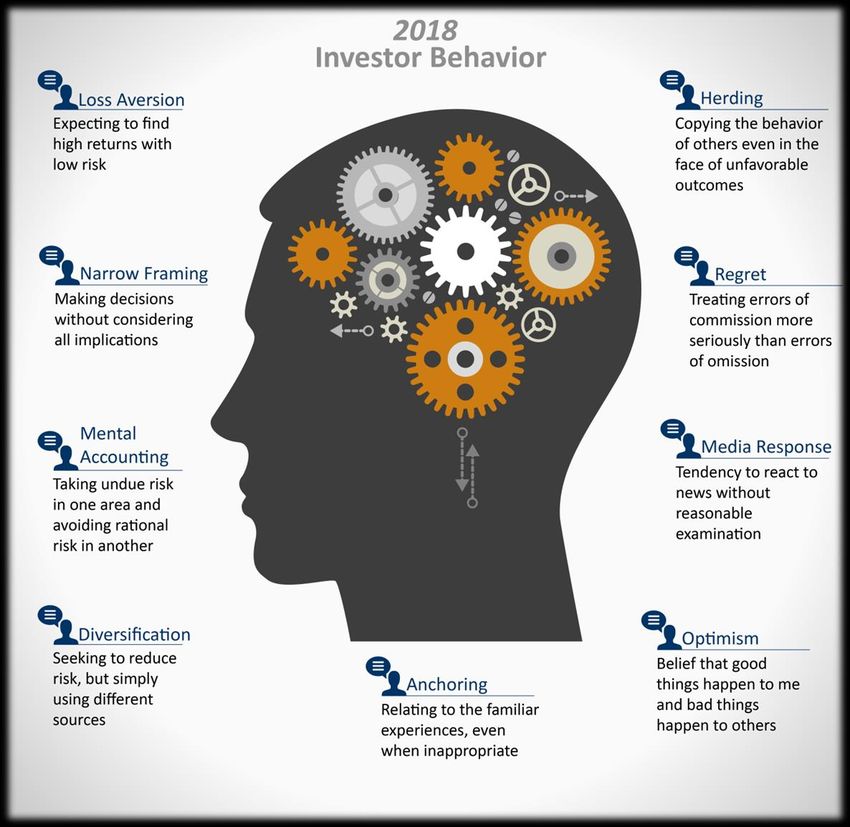
INVESTOR PSYCHOLOGY
When discussing investor behavior it is helpful to first understand the specific
thoughts and actions that lead to poor decision-making. Investor behavior is not
simply buying and selling at the wrong time, it is the psychological traps, triggers
and misconceptions that cause investors to act irrationally. That irrationality leads
to buying and selling at the wrong time, which leads to underperformance.
There are 9 distinct behaviors that tend to plague investors based on their
personal experiences and unique personalities.
© 2018 Quantitative Analysis of Investor Behavior 24APPENDICES 1. Year-by-Year Investor Returns 2. Glossary 3. QAIB Products 4. Investor Return Calculations: An Example 5. Rights of Usage and Sourcing Information © 2018 Quantitative Analysis of Investor Behavior 25
YEAR-BY-YEAR INVESTOR RETURNS
The following table shows the one-year investor return since inception from 1985
to 2017. These calculations assume that investors start investing on January 1 of
each year and withdraw their investments on December 31. The effect of
compounding across years is therefore lost. Additionally, because of the year-by-
year nature of the calculation, returns cannot be asset weighted.

                          Avg.                     Avg.                    Avg.
     Year
                         Equity                Fixed Income          Asset Allocation
    1985                27.79%                    11.86%                 20.50%
    1986                17.53%                      7.94%                 5.97%
    1987                 0.51%                     -0.84%                 6.03%
    1988                17.88%                      4.70%                -1.78%
    1989                23.51%                      6.63%                20.77%
    1990                 -5.62%                     2.18%                 6.81%
    1991                29.40%                    11.94%                 17.25%
    1992                 7.28%                      8.60%                 1.13%
    1993                15.93%                      7.87%                16.66%
    1994                 -0.02%                    -4.99%                -5.48%
    1995                26.52%                    14.37%                 25.36%
    1996                17.33%                      7.71%                11.51%
    1997                20.59%                      8.14%                16.02%
    1998                34.48%                      5.92%                32.40%
    1999                26.58%                     -5.68%                 5.47%
    2000                -10.20%                     4.17%                 1.39%
    2001                -14.92%                    -0.75%                -5.15%
    2002                -21.86%                     2.20%               -10.56%
    2003                30.08%                      4.31%                16.80%
    2004                12.60%                      1.30%                 8.01%
    2005                 8.45%                     -0.58%                 1.95%
    2006                14.65%                      2.09%                11.12%

© 2018                  Quantitative Analysis of Investor Behavior                 26
Avg. Avg. Avg.
Year
Equity Fixed Income Asset Allocation
2007 7.33% 0.80% 3.47%
2008 -41.77% -11.55% -31.35%
2009 32.10% 9.78% 19.31%
2010 14.11% 3.05% 8.83%
2011 -5.73% 1.84% -2.60%
2012 15.62% 4.70% 8.53%
2013 25.69% -3.47% 13.72%
2014 5.51% 1.19% 2.60%
2015 -2.28% -3.11% -3.48%
2016 7.26% 1.23% 5.48%
2017 20.64 1.52% 10.08%
© 2018 Quantitative Analysis of Investor Behavior 27GLOSSARY Average Investor The average investor refers to the universe of all mutual fund investors whose actions and financial results are restated to represent a single investor. This approach allows the entire universe of mutual fund investors to be used as the statistical sample, ensuring ultimate reliability. [Average] Investor Behavior QAIB quantitatively measures sales, redemptions and exchanges (provided by the Investment Company Institute) and describes these measures as investor behaviors. The measurement of investor behavior is the net dollar volume of these activities that occur in a single month during the period being analyzed. [Average] Investor Return (Performance) QAIB calculates investor returns as the change in assets, after excluding sales, redemptions, and exchanges. This method of calculation captures realized and unrealized capital gains, dividends, interest, trading costs, sales charges, fees, expenses and any other costs. After calculating investor returns in dollar terms (above) two percentages are calculated: Total investor return rate for the period Annualized investor return rate Total return rate is determined by calculating the investor return dollars as a percentage of the net assets, sales, redemptions and exchanges for the period. Annualized return rate is calculated as the uniform rate that can be compounded annually for the period under consideration to produce the investor return dollars. Average Equity Fund Investor The Average Equity Fund Investor is comprised of a universe of both domestic and world equity mutual funds. It includes growth, sector, alternative strategy, value, blend, emerging markets, global equity, international equity, and regional equity funds. © 2018 Quantitative Analysis of Investor Behavior 28
Average Equity Fixed Income Investor
The Average Fixed Income Fund Investor is comprised of a universe of fixed income
mutual funds, which includes investment grade, high yield, government, municipal,
multi-sector, and global bond funds. It does not include money market funds.

Average Asset Allocation Investor
The Average Asset Allocation Fund Investor is comprised of a universe of funds that
invest in a mix of equity and debt securities.

Average [Sector] Fund Investor
The Average [Sector] Fund Investor is comprised of a universe of funds that invest solely
in companies that operate in related fields or specific industries. The following Average
Sector Fund Investors were referenced in this report: Consumer, Health, Financial,
Tech/Telecom, Real Estate, Precious Metals, Utilities, and Natural Resources.

Average [Capitalization and Style] Fund Investor
The Average [Capitalization and Style] Fund Investor is comprised of a universe of funds
that are categorized by the types of companies in which they invest:
  Small-cap mutual funds invest primarily in companies with market capitalizations of up
  to $2-2.5 billion.
  Mid-cap mutual funds invest primarily in companies with market capitalization that
  generally ranges from $1 billion to $7 billion or in companies with both small and
  medium market capitalization.
  Large-cap mutual funds invest primarily in companies with market capitalizations
  which are generally more than $5 billion or in companies with both medium and large
  market capitalizations.
  Growth mutual funds invest primarily in common stock of growth companies, which
  are those that exhibit signs of above-average growth, even if the share price is high
  relative to earnings/intrinsic value.
  Value mutual funds invest primarily in common stock of value companies, which are
  those that are out of favor with investors, appear underpriced by the market relative
  to their earnings/intrinsic value, or have high dividend yields.
  Blend mutual funds invest primarily in common stock of both growth and value
  companies or are not limited to the types of companies in which they can invest.

Average Equity Index Fund Investor
The Average Equity Index Fund Investor is comprised of a universe of funds that are
designed to track the performance of a U.S. equity market index.

© 2018                     Quantitative Analysis of Investor Behavior                     29
Average Target Date Fund Investor
The Average Target Date Fund Investor is comprised of a universe of funds that follow a
predetermined reallocation of assets over time based on a specified target retirement
date.

Average Alternative Strategies (Alt-) Fund Investor
The Average Alternative Strategies (Alt-) Fund Investor is comprised of a universe of
funds that employ alternative investment approaches like long/short, market neutral,
leveraged, inverse, or commodity strategies to meet their investment objective. The
following Average Alternative Strategies Fund Investors were referenced in this report:
Alt-Domestic Equity, Alt-World Equity, Alt – Asset Allocation (“AA”), and Alt-Multisector
Bond.

Guess Right Ratio
The Guess Right Ratio is the frequency that the average investor makes a short-
term gain. One point is scored each month when the average investor has net
inflows and the market (S&P 500) rises in the next month. A point is also scored
when the average investor has net outflows and the market declines in the next
month. The ratio is the number of points scored as a percentage of the total
number of months under consideration.

Retention Rate
Retention Rate reflects the length of time the average investor holds a fund if the
current redemption rate persists. It is the time required to fully redeem the
account. Retention rates are expressed in years and fractions of years.

Inflation Rate
The monthly value of the consumer price index is converted to a monthly rate.
The monthly rates are used to compound a “return” for the period under
consideration. This result is then annualized to produce the inflation rate for the
period.

© 2018                     Quantitative Analysis of Investor Behavior                   30
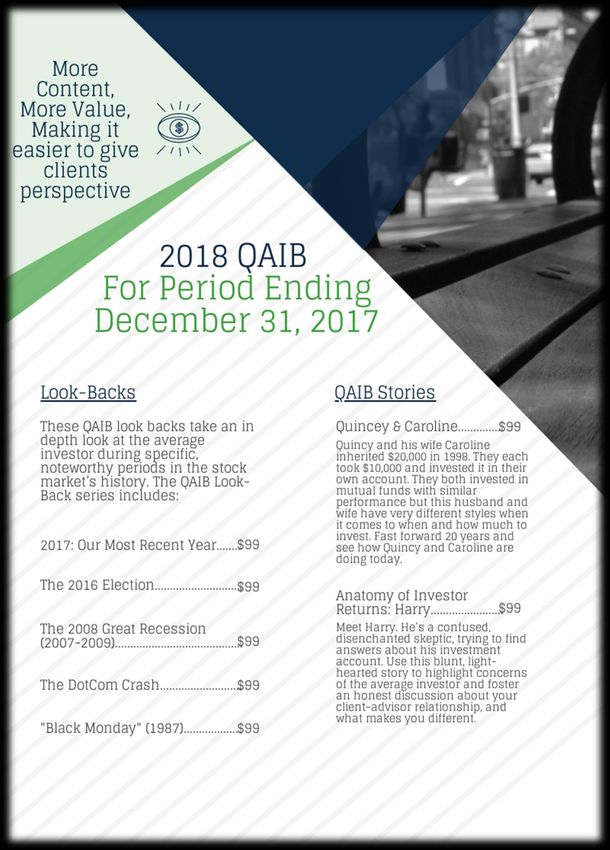
QAIB Products

© 2018     Quantitative Analysis of Investor Behavior   31
© 2018 Quantitative Analysis of Investor Behavior 32
INVESTOR RETURN CALCULATION…
                                                                  AN EXAMPLE
Investor return is calculated by measuring the actual gains that investors realize.
The following example is hypothetical:

Step 1: Compute Monthly Net Change
                                                                        1/31 Assets - 12/31 Assets =
The equity assets at the end of 1/31 are subtracted from                          Change
the assets at 12/31 to determine the change for the month.
The change is the net of investor actions [new investments                      5196 – 4940
(which includes the reinvestment of dividends and capital                           = 256
gain distributions), withdrawals (redemptions), exchanges
                                                                                 (In $ Billions)
in and out], changes in market value, net of loads, fees,
expenses, commissions, etc.

           Monthly Change 256          Step 2: Compute Change in Market Value
    Minus New Investments -123      The change in assets due to investor actions
         Plus Withdrawals +105
         Minus Exchanges in -25     are deducted from monthly net change,
         Plus Exchanges out +12     resulting in the market value change that is
     Equal Net Change in Market     net of loads, fees, expenses, commissions, etc.
                     Value 225      The net change in market value is the return
                    (In $ Billions)
                                    earned by the investor for the month, after all
fees and expenses are paid. This could be either a gain or loss.

                                                                                        January 225
Step 3: Calculate Total for Period                                                     February -28
The calculation is repeated for each month to develop the total for                      March +106
                                                                                           April +106
the periods for which the investor return is being measured – (1, 3,                       May -213
5, 10 and 20 years.)                                                                        June -5
                                                                                             July -20
                                                                                        August +119
                                                                                    September +88
                                                                                        October +195
                                                                                     November +154
                                                                                      December +30
                                                                                Total for period 757
© 2018                     Quantitative Analysis of Investor Behavior                   33
The example illustrates a one-year period. Note that the average investor
suffered losses in February, May, June and July but these were more than offset
by the gains in the other months.
Step 4: Determine Cost Basis
Opening Assets 4940
The cost basis is the opening balance for the period adjusted by Plus New Investments +1288
the investor actions (new investments, withdrawals, exchanges Minus Withdrawals -1150
in and out). Plus Exchanges in +206
Minus Exchanges out -128
Equal Cost Basis 5156
(In $ Billions)
Investor Return $ / Cost Basis = Step 5: Calculate Investor Return Percentage
% Return
Dividing the investor return dollars
757 / 5156= 15% calculated in Step 3 by the cost basis in
Step 4 gives the total investor return
(In $ Billions)
percentage.
Step 6: Find Annualized Rate of Return
Annualized return is then calculated. This is the single rate that can be
compounded for each year to produce the same effect as the varying monthly
rates.
Since the period in our example is only one year, the annualized investor return is
the same as the total investor return.
The formula used to calculate annualized return is:
Annualized Return =
[% Return ^(1/# of years)]-1
© 2018 Quantitative Analysis of Investor Behavior 34RIGHTS OF USAGE AND SOURCING INFORMATION
When purchasing the Full Study of the Quantitative Analysis of Investor Behavior
(“Document”), DALBAR, Inc. (“Licensor”) grants purchaser (“Licensee”) the rights
to incorporate certain materials contained within the document entitled, in
whole or in part, into other works (“Derivative Works”) on the condition that
Licensee makes required regulatory disclosures and sources QAIB and DALBAR as
appropriate.
1. Licensee shall own the copyright in Derivative Works.
2. Licensee shall not redistribute, provide access to, share or transfer printed or
electronic copies of the Document to anyone outside the Licensee’s
organization.
3. All right, title, and interest in the Document, including without limitation, any
copyright, shall remain with Licensor.
4. These rights are conveyed to purchasers for their own use and are limited to
their own specific publications.
Source example: “Quantitative Analysis of Investor Behavior, 2018,” DALBAR, Inc. www.dalbar.com
Applicable Disclosures Examples:
Equity benchmark performance and systematic equity investing examples are represented by the Standard &
Poor’s 500 Composite Index, an unmanaged index of 500 common stocks generally considered representative
of the U.S. stock market. Indexes do not take into account the fees and expenses associated with investing,
and individuals cannot invest directly in any index. Past performance cannot guarantee future results.
Bond benchmark performance and systematic bond investing examples are represented by the Barclays
Aggregate Bond Index, an unmanaged index of bonds generally considered representative of the bond
market. Indexes do not take into account the fees and expenses associated with investing, and individuals
cannot invest directly in any index. Past performance cannot guarantee future results.
Average stock investor, average bond investor and average asset allocation investor performance results are
based on a DALBAR study, “Quantitative Analysis of Investor Behavior (QAIB), 2016.” DALBAR is an independent,
Boston-based financial research firm. Using monthly fund data supplied by the Investment Company Institute,
QAIB calculates investor returns as the change in assets after excluding sales, redemptions and exchanges.
This method of calculation captures realized and unrealized capital gains, dividends, interest, trading costs,
sales charges, fees, expenses and any other costs. After calculating investor returns in dollar terms, two
percentages are calculated for the period examined: Total investor return rate and annualized investor return
rate. Total return rate is determined by calculating the investor return dollars as a percentage of the net of
the sales, redemptions, and exchanges for the period.
© 2018 Quantitative Analysis of Investor Behavior 35You can also read