#ALLTOGETHERNOW: IMPROVING SMALL BUSINESS LENDING IN THE ROCHESTER NY COMMUNITY - WRITTEN BY: BARBARA VAN KERKHOVE, PHD.
←
→
Page content transcription
If your browser does not render page correctly, please read the page content below

#AllTogetherNow:
Improving Small Business Lending in
the Rochester NY Community

WRITTEN BY:
BARBARA VAN KERKHOVE, PhD.
EMPIRE JUSTICE CENTER BOARD OF DIRECTORS
          JoAnn Smith (Chair)                                 Raymond Brescia, Esq. (Vice Chair)
          Rivera Carey PLLC                                   Albany Law School

          Kristen Clark CPA, FHFMA (Treasurer)                Deborah P. Amory, Ph.D (Secretary)
          The Bonadio Group                                   Empire State College

          Odette Belton, Esq.                                 John P. Bringewatt, Esq.
          Monroe County Public Defender                       Harter Secrest & Emery LLP

          Tehresa Coles                                       Maureen DeRosa
          The AYCO Company                                    Albany
          Nancy Engelhardt                                    L. Theresa Macon
          Energeia Partnership at Molloy College              Rochester
          David Tennant, Esq.                                 Emily Whalen, Esq.
          Nixon Peabody                                       Brown & Weinraub

         All directors serve as volunteers.

         EMPIRE JUSTICE CENTER LEADERSHIP
        Anne Erickson, President & CEO
        Bryan Hetherington, Chief Counsel
        Kristin Brown, Vice President
        Kristi Hughes, Vice President
        Lori McCormick, Chief Financial Officer

         ABOUT EMPIRE JUSTICE CENTER
         Empire Justice Center is a statewide, public interest law firm with offices in Albany, Rochester, White
         Plains, Yonkers and Central Islip (Long Island). Empire Justice focuses on changing the “systems” within
         which poor and low-income families live. With a focus on poverty law, Empire Justice undertakes
         research and training, acts as an informational clearinghouse, and provides litigation backup to local
         legal services programs and community based organizations. As an advocacy organization, Empire
         Justice engages in legislative and administrative advocacy on behalf of those impacted by poverty
         and discrimination. As a non-profit law firm, Empire Justice provides legal assistance to those in need
         and undertakes impact litigation in order to protect and defend the rights of disenfranchised New
         Yorkers.

#AllTogetherNow             2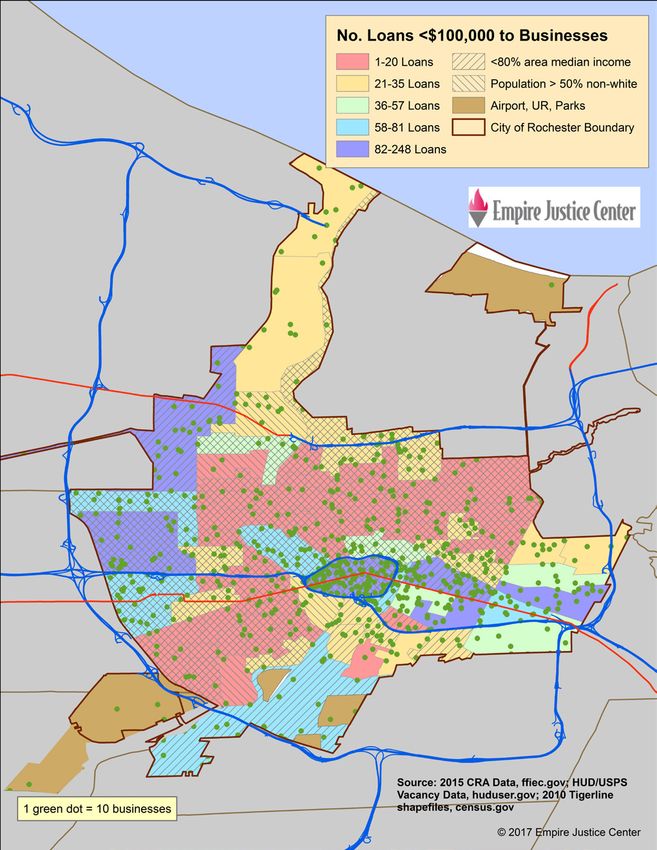
TABLE OF CONTENTS

     I     INTRODUCTION		 		                                                                             3

     II    PURPOSE OF REPORT AND STRUCTURE                                            			                5

     III   AGGREGATE ANALYSIS				 5
           A. SMALL BUSINESSES IN THE ROCHESTER AREA . . . . . . . . . . . . . . . . . 5
           B. COMPARING THE DISTRIBUTION OF LENDING TO BUSINESS. . . . . . . . .       5

     IV    MAPPING SMALL BUSINESS LENDING IN THE CITY OF ROCHESTER
           AND MONROE COUNTY				                                                                         10
           A. MAPPING SMALL BUSINESS LENDING IN THE CITY OF
              ROCHESTER AND MONROE COUNTY . . . . . . . . . . . . . . . . . . . . . . .                  10
           B. MAPPING SMALL BUSINESS LENDING OUTSIDE MONROE COUNTY . . .                                 13

     V     LENDING BY ROCHESTER’S TOP BANKS AND SMALL BUSINESS LENDERS                                   15
           A. LENDING BY ROCHESTER’S TOP BANKS . . . . . . . . . . . . . . . . . . . . . .               15
           B. ROCHESTER’S TOP SMALL BUSINESS LENDERS . . . . . . . . . . . . . . . . .                   21

     VI    CONCLUSION				                                                                                24

     VII   RECOMMENDATIONS				                                                                           26

     VIII APPENDICES				                                                                                 28
          APPENDIX A: Methodology . . . . . . . . . . . . . . . . . . . . . . . . . . . . . . . .        28
          APPENDIX B: Maps . . . . . . . . . . . . . . . . . . . . . . . . . . . . . . . . . . . . .     30
          APPENDIX C: Tables . . . . . . . . . . . . . . . . . . . . . . . . . . . . . . . . . . . . .   43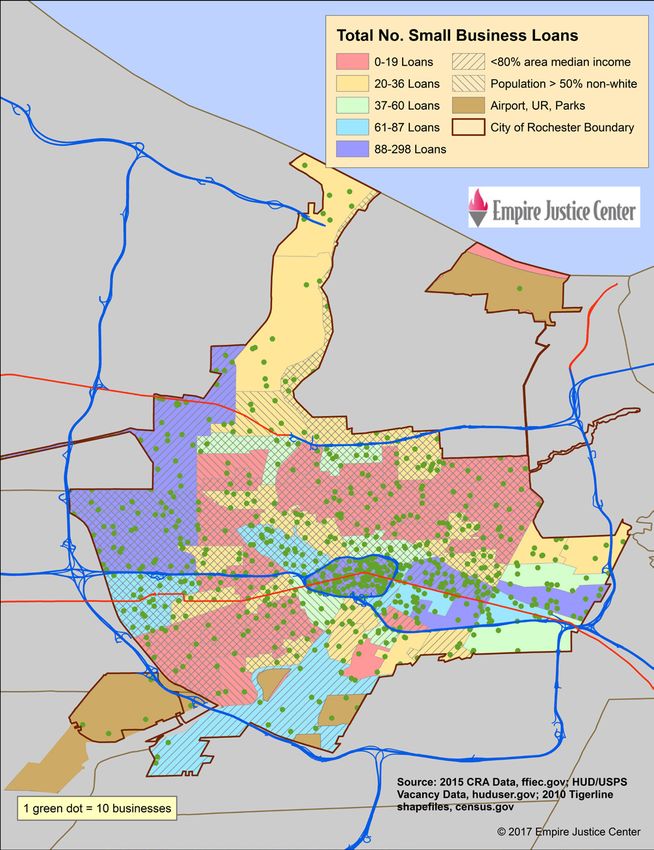
I. INTRODUCTION

This is the first analysis of small business lending that Empire Justice Center has done since the mid-1990s, when the
Greater Rochester Community Reinvestment Coalition (GRCRC), a coalition convened by Empire Justice Center and
its predecessor organization, the Public Interest Law Office of Rochester (PILOR), analyzed small business lending in
the city of Rochester. Equitable access to responsible credit has been important to these organizations since 1993,
when GRCRC was first convened to advocate for increased mortgage lending in the city of Rochester. Access to credit
matters. When done equitably and responsibly, obtaining mortgage and small business loans can reduce poverty;
build wealth in immigrant communities and communities of color, which are still suffering the vestiges of redlining;
and, most importantly, advance economic and racial justice.

Over the past 20 years, several crises in the mortgage lending industry—redlining, subprime lending and the
foreclosure crisis—have captured the attention of Empire Justice and GRCRC.1 Still, in discussions with banks and in
comments to their regulators,2 the topic of small business lending is often included, particularly the need for small
loans to smaller, mostly start-up businesses.
Small businesses today face numerous challenges, many of which are related to access to credit. As with mortgage
lending, small business lending at the national level declined dramatically between 2007 and 2010. While it has been
slowly recovering, small business lending has yet to reach its peak levels of 2007, or even the levels of 2001.3

These long-time challenges, along with the newer ones arising from changes in the small business lending industry,
are well documented, as seen below in our review of several recent small business lending reports.

•   In April of 2017, the 12 Federal Reserve Banks issued a report on the system’s Small Business Credit Survey. The
    report examined the financial challenges faced by small businesses. The report documented that 61% of survey
    respondents faced financial challenges; 44% of respondents expressed concern about credit availability, and 36%
    expressed concern about paying operating expenses.4
•   On September 14th 2017, the California Reinvestment Coalition (CRC) released a study based on a survey of
    42 CRC members and allies. The survey documented that small businesses seek multiple financing options
    but end up using credit cards, online lenders and merchant cash advances—all of which are often higher cost
    products. For these businesses, online lenders fill the credit gap left by regulated financial institutions, with 87%
    of CRC survey respondents reporting that small businesses “often” or “sometimes” turn to these services.5 Large
    institutions tend to make small business loans in the form of credit cards, which may carry higher rates, fewer
    protections, and be less likely to meet long term capital needs. Importantly, the report also documents the
    challenges of women-owned and minority-owned businesses, including discrimination, language access barriers,
    no credit history or bad credit history.
•   An August 2017 report by the Woodstock Institute discusses the distribution of Community Reinvestment
    Act (CRA) small business loans under $100,000 among small businesses in Detroit, MI and Richmond, VA. The
    report found that between 2012 and 2015, businesses in predominantly minority census tracts in Detroit and
    Richmond did not receive loans proportionate to their share of each region’s businesses. If loans had been made
    in proportion to the number of small businesses, an additional 17,000 loans worth $247 million would have been
    made in Detroit, and 3,800 additional loans worth $58.1 million would have been made in Richmond.6
•   A growing concern is that small businesses are turning to online lenders or “fintechs” to fill the gap left by brick
    and mortar lenders. In April 2017, the Harvard Business Review reported that small and medium sized enterprises
    had $300 billion in loans outstanding at U.S. banks. Morgan Stanley estimates that online lenders will increase
    lending to such businesses so that by 2020, $60 billion of lending will occur by online lenders.7 However, online
    lending can be expensive and unaffordable, with high interest rates and short terms that hurt a business’s ability
    to grow.8 Later in this report, we will discuss the need to allow states to regulate this growing industry.

As our country grapples with how small business lending, particularly fintech and merchant cash advance lending,
should be regulated, it’s important to understand how lenders are serving small businesses at the local level. Where is
small business lending occurring in the Rochester, New York area? How are smaller-sized businesses or those wanting
smaller loans being served? Are businesses getting their loans from banks with a local presence, from outside banks or
from credit card or online lenders?

               This report seeks to answer these questions to see how well economic and
                social justice are being served and to inform decisions about products,
              initiatives and regulations related to accessing credit for small businesses.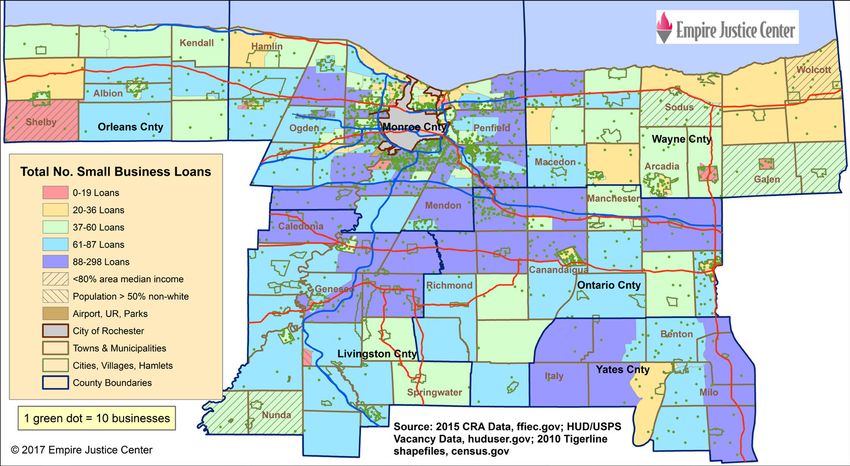
II. PURPOSE OF REPORT AND STRUCTURE

 Our report provides an in-depth snapshot of the small business lending landscape in the Rochester, New York area
 and how that landscape relates to the larger economic context described above. This report is intended to be a
 catalyst for a community conversation about increasing access to responsible credit for small businesses, both
 start-ups and established businesses, and particularly women, minority and immigrant-owned enterprises. Our
 hope is that our analysis of Rochester will help to inform not just the local conversation, but will be useful to state-
 and national-level stakeholders and decision makers as well.

 The report starts with a detailed examination of aggregate small business lending in 2015 in the six-county
 Rochester Metropolitan Statistical Area (MSA)--where loans were made in the MSA, the types of loans and the
 dollar volume of those loans, and compare the lending to the distribution of businesses in the MSA. We then look
 at the lending of individual banks and lenders in the Rochester area—the largest banks, the lenders making the
 largest number of small business loans and the lenders with the largest lending volumes. We also include several
 cases of initiatives happening here in Rochester and elsewhere in New York State that support small businesses
 and/or provide credit in innovative ways. Finally, we make several recommendations to improve the ability of
 Rochester-area businesses to access responsible credit so they and our economy can thrive.

 III. AGGREGATE ANALYSIS

 As seen in the table on the next page, in 2015 there were 15,648 CRA small business loans made in the Rochester
 NY MSA totaling over $790.2 million. Of these loans:

 •   14,141, or 90% of the total number of loans, were loans of $100,000 or less (the lowest category reported)
     totaling almost $208.9 million, or 26% of the total dollar volume of lending.
 •   7,153, or 46% of the total number of loans, were loans to businesses with gross annual revenues under $1
     million (GAR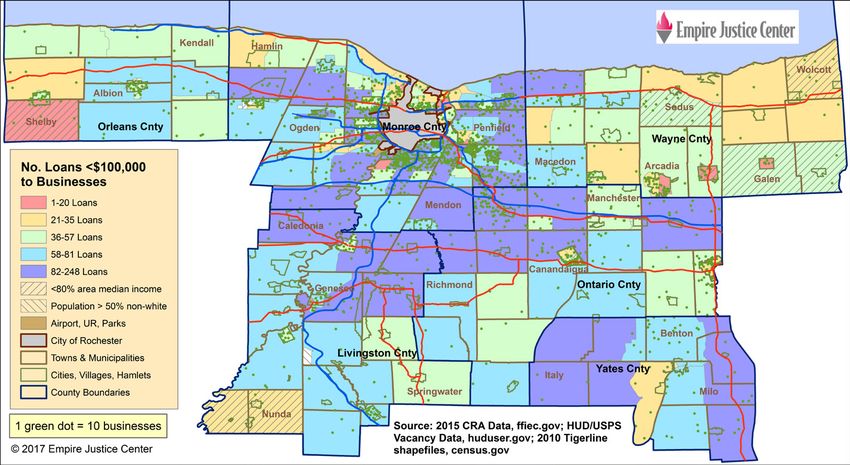
B. COMPARING THE DISTRIBUTION OF LENDING TO BUSINESSES

             Rochester MSA's Small Business Lending Compared to Geographic Distribution of Businesses
                                    and to Smaller Loans and Smaller Businesses

                                                                    Monroe                                     Majority Non-
                                   Rochester        City of         County                       LMI Tracts in White Tracts
                                     MSA           Rochester        Towns        Rest of MSA         MSA         in MSA
No. Occupied Businesses                 26,330      7,245               11,894           7,191          7,921              4,671
Number of Loans
 Total No. Loans                        15,648      2,660                8,134           4,854          2,626              1,446
 Loan Amt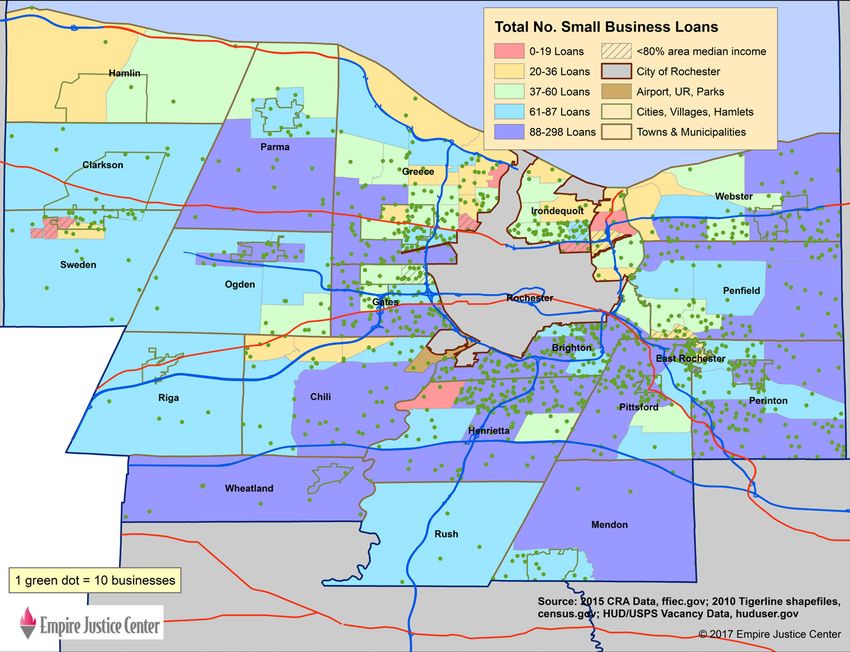
Of the $790 million in lending:

   •   $155.9 million (20%) was to businesses in the city of Rochester
   •   $414.9 million (52%) was to businesses in the surrounding Monroe County towns
   •   $219.4 million (28%) was to businesses in the rest of the MSA
   •   $98.6 million (12%) was to businesses in majority (50-100%) non-white census tracts
   •   $154.7 (20%) was to businesses in low-moderate income census tracts

   As seen in Figure 1 below, comparing the distribution of businesses to small business lending in the Rochester
   MSA in 2015, the lending does not match up to the distribution of businesses.

   While the city of Rochester has 28% of the MSA’s businesses, city businesses received only 2,660 loans or 17%
   of the MSA’s small business loans. Conversely, the surrounding towns in Monroe County have 45% of the MSA’s
   businesses, but businesses here received 8,134 loans or 52% of the area’s small business loans.

   FIGURE 1: COMPARING SMALL BUSINESS LENDING TO THE GEOGRAPHIC DISTRIBUTION OF BUSINESSES
   IN THE ROCHESTER MSA

Number of Occupied Businesses                    Number Small Business                         Number Volume Small
     in Rochester MSA                                   Loans                                 Business Lending ($000)

                                                               2,660
                                                               (17%)                                       $155,887
                                                                                                           (20%)
 7,191 (27%)    7,245 (28%)                   4,854 (31%)                                    $219,433
                                                                                             (28%)

       11,894 (45%)                                      8,134 (52%)                              $414,928 (52%)

               Rest of MSA                         Monroe County Towns                       City of Rochester

 Even within the city of Rochester, there are discrepancies in proportions of loans compared with the location of
 businesses, but not with the distribution of the dollar volume of lending. While 64% of city of Rochester businesses are
 located in majority non-white census tracts, only 54% of the loans, and 63% of the dollar volume of lending, made in
 the city went to businesses in these census tracts.

 Lending in the city’s low-moderate income census tracts follow a pattern similar to that seen in its communities of
 color—disparities in the distribution of loans made, but not so much in the dollar volume of lending. While 81% of the
 city’s businesses are in low-moderate income tracts, they received 73% of the loans and 80% of the dollar volume of
 lending.

 #AllTogetherNow          8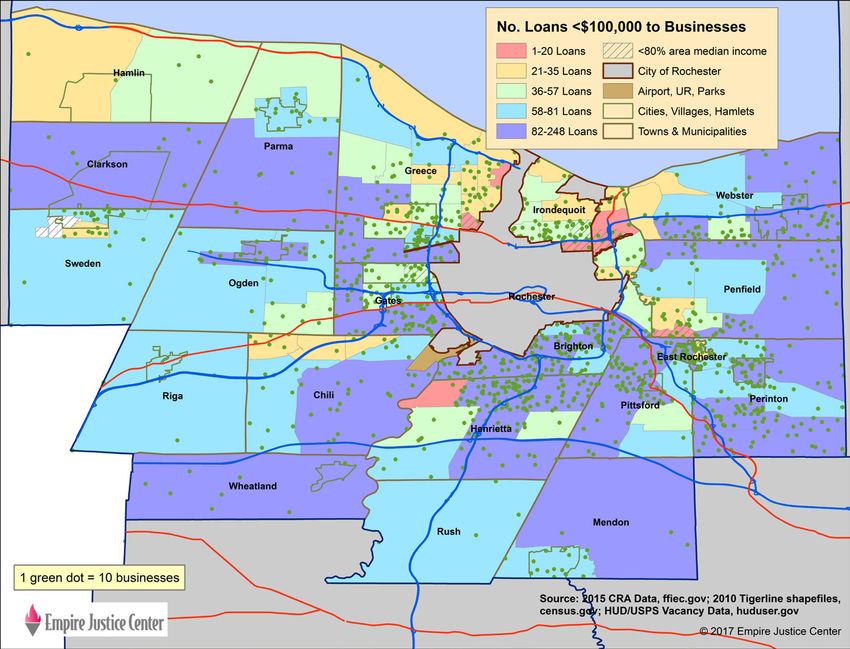
The average loan size in the Rochester MSA was $50,500; however, there were noteworthy differences across
geographies.

•   In the city of Rochester, the average loan size was $58,600, the highest average among the various geographic
    areas, while the average was $51,000 in the Monroe County towns and only $45,200 in the rest of the MSA
•   The average loan size in the MSA’s low-moderate income census tracts was $58,900, compared to $63,900 in
    the city’s low-moderate income areas and $50,800 in those in the Monroe County towns
•   The average loan size in majority non-white census tracts in the MSA, all but one of which are in the city of
    Rochester, was $68,200

Note that the average loan size decreases as the tract’s population becomes less white:

•   The average loan size in 50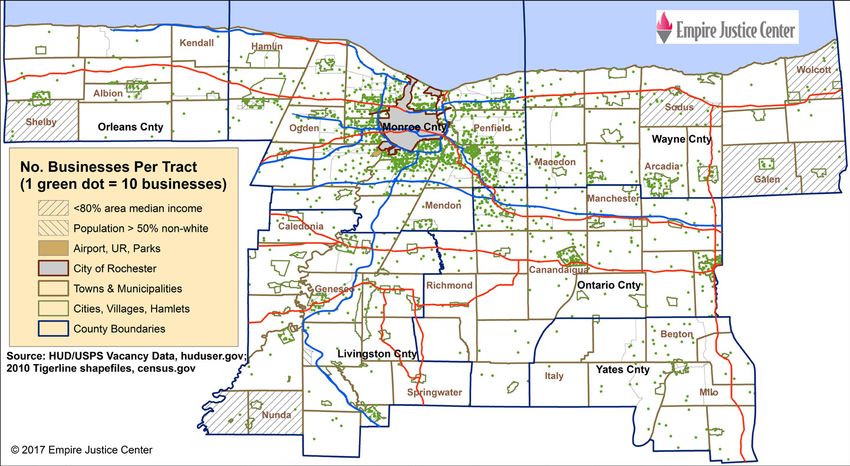
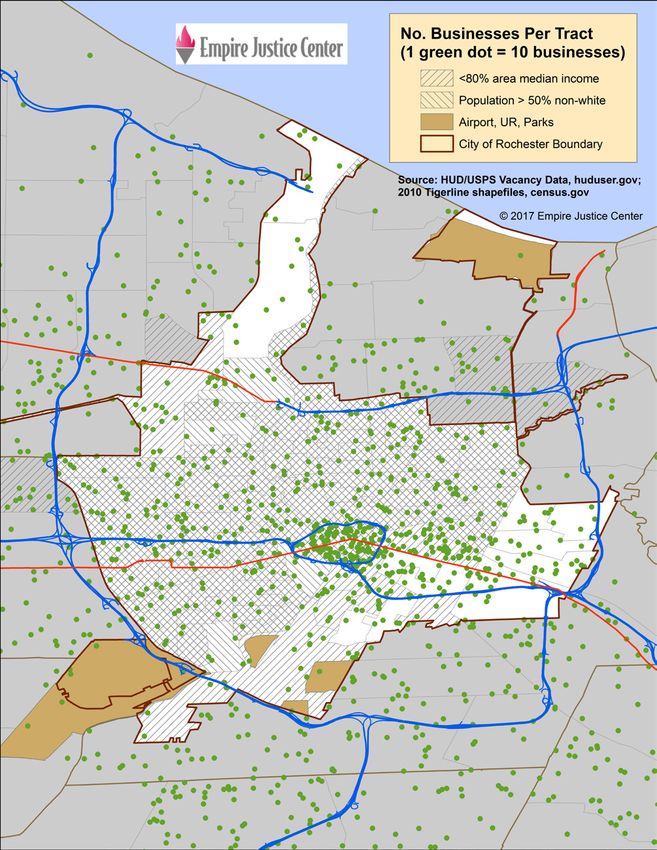
IV. MAPPING SMALL BUSINESS LENDING IN THE ROCHESTER AREA

 A. MAPPING SMALL BUSINESS LENDING IN THE CITY OF ROCHESTER AND MONROE COUNTY

 A revealing way to examine patterns of lending is through mapping data geographically. This was done with
 the numbers or concentration of businesses per census tract and the number of small business loans per
 census tract—namely the total CRA small business loans, the number of loans less than or equal to $100,000
 (
Comparing Number of Small Businesses to Number of Loans and Averages per
              Census Tract for Different Lending Categories and Geographies,
                                  Rochester NY MSA (2015)
                                    No. Occupied                                              No. Loans to
                                        Small             Total No.         No. Loans         GAR
In the Monroe County towns outside the city of Rochester, a total of 8,134 small business loans were made in 2015, with a mean of 73 loans per census tract and a median of 64 (see table above). As seen in Figure 5 showing the number of loans and businesses by census tract in the towns of Monroe County, very few census tracts are low- moderate income, and none are communities of color. Most of this map is either indigo or teal, indicating census tracts with the highest numbers of loans, 88-298 or 61-87 loans, respectively. Compare this to the city of Rochester map, where at least half of the map’s area is red or yellow, indicating fewer loans than the MSA mean of 58 loans. Most of the Monroe County towns have average or higher than average numbers of loans, despite the lower density of businesses on the west side or in the far southern parts of the county. There are some areas of Greece and Irondequoit, close to the city, and East Rochester, with a low-moderate income area, which received fewer- than-expected loans given the number of businesses. Note that Hamlin, northern Chili and west Webster have lower levels of small business loans, aligning with the relatively few businesses located there. The lending patterns for loans
CASE STUDY: PATHSTONE ENTERPRISE CENTER

PathStone Enterprise Center, Inc. (PECI) is a non-profit, 501(c)(3) regional Community Development Corporation
organized in 1997 and certified as a Community Development Financial Institution (CDFI) in 1998. It is an affil-
iate of PathStone Corporation, based in Rochester, NY. PECI is the economic development and lending arm of
PathStone Corporation with a service area that includes upstate New York between Buffalo and Syracuse and the
western half of Puerto Rico.

Since its inception, PECI has made an aggregate 1,348 loans totaling $30.6 million, while leveraging an additional
$26.2 million in private funding, and PECI currently has assets of approximately $12,000,000. The small business
loan segment of the portfolio has resulted in over 2,600 jobs created or retained in New York and Puerto Rico. PECI
services all of its loans. Its current small business portfolio includes over 180 loans with outstanding balances total-
ing over $6,300,000. In FY2017 PECI originated 89 small business loans totaling $3,880,000 (or an average of just
over $43,000 per loan). 47 of those loans were to businesses owned by minorities.

PECI is capitalized by a variety of government and private funds. PECI is microlender for SBA and USDA. PECI has
received loan and grant capital from New York’s Empire State Development that it uses for relending. In addition
PECI has received Program Related Investments (long term low interest loans or grants) from six financial institu-
tions and three foundations for the purpose of making loans that they are unable to make in their service areas.

TK Flooring Inc. is a Rochester-based startup flooring company that came to PathStone Enterprise Center when
the owner Mr. Thoue Kongmany, an immigrant from Southeast Asia, decided to strike out on his own after work-
ing as a crew foreman for a large established flooring company for several years. Because of the startup status
and competitive nature of the business, the Enterprise Center loan committee was reluctant to make a loan to TK
and initially turned him down, but offered him a chance to come back if he was able to provide his list of pending
contracts and better financial data. Mr. Kongmany came back, the loan committee approved him for $10,000 and
soon an additional $10,000, and another $25,000. Each time Mr. Kongmany heard the concerns of the loan com-
mittee and adjusted his business practices accordingly. He was eventually approved for a fifth loan in the amount
of $100,000 based on the 11 contracts he had been awarded. After being awarded that loan, he had been in busi-
ness long enough and had a good enough financial statement that a community bank was willing to provide his
business a line of credit. He now has extensive contracts including with a university and with a hotel chain.
B. MAPPING SMALL BUSINESS LENDING OUTSIDE MONROE COUNTY

 i. Geographic distribution of businesses

 Over two-thirds of the businesses in the Rochester MSA fall within Monroe County. The five counties outside
 Monroe (Livingston, Ontario, Orleans, Wayne and Yates) had 7,191 businesses or 29% of the MSA’s businesses. As
 shown in Figure 10, outside Monroe County, the businesses are most concentrated just to the southeast and east
 of Monroe County and in the villages.

 ii. Geographic distribution of loans

 We would expect these counties to have proportions of the MSA’s small business loans similar to the 29% of
 businesses. As seen in the tables and figure above, this expectation is often met for the five counties as a whole. In
 2015, businesses in these counties received 4,854 loans or 31% of the MSA’s loans and $219.4 million or 28% of the
 total dollar volume of lending made in the region.

 There was a mean of 63 loans per census tract and a median of 56, slightly higher than the averages for the MSA
 as a whole (see table on page 11). As seen in Figure 11, showing the total number of small business loans for the
 MSA, many of the census tracts outside the city in Monroe County received the largest numbers of loans (88-298
 loans, indigo tracts) as did several in Yates, Livingston, and Ontario Counties. These three counties also had several
 census tracts receiving between 37-87 loans (green and teal tracts), the two categories near the mean and median,
 and they only had a few census tracts of low lending (0-36 loans, red and yellow tracts). Although Wayne County
 appears to have several villages and tracts with comparable numbers of businesses to, if not more businesses
 than, several areas in Livingston and Yates Counties, lending for much of Wayne County is low, particularly in the
 villages along the Erie Canal (along the south) and in the eastern part of the county.

 Businesses in Livingston, Ontario, Orleans, Wayne and Yates Counties received 4,434 loans
V. LENDING BY ROCHESTER’S TOP BANKS AND SMALL BUSINESS LENDERS

We also examined how the top banks and small business lenders performed compared to their peers, the
aggregate and other financial institutions, particularly with respect to lending to businesses in low-moderate
income neighborhoods and to businesses with GAR
i. Total loans and dollar volume of lending

    In 2015, 15,851 small business loans were originated in the Rochester MSA totaling $793 million. The table below
    shows the performance of the top 8 banks (in order of dollar volume of lending and with overall market share
    rankings).

               Top 8 Banks 2015 Small Business Loans and Dollar Volume of Lending,
                                       Rochester NY MSA
                                       (In order of dollar volume of lending)
                                      Number of Loans                       Dollar Volume of Lending ($MM)
                                            Market      Rank Among         Dollar                  Rank Among
                               No.           Share       All Lenders      Volume      Market share All Lenders
M&T                                 842           5.3%               9        $212.88       26.8%             1
Five Star                           757           4.8%             10          $89.59       11.3%             2
Canandaigua NB                      984           6.2%               6         $79.43       10.0%             3
JPMorgan Chase                     1564           9.9%               2         $40.20         5.1%            5
First Niagara                       444           2.8%             11          $32.54         4.1%            6
Bank of America                     934           5.9%               8         $31.10         3.9%            7
Citizens Bank                       333           2.1%             12          $20.66         2.6%           10
KeyBank                             177           1.1%             17          $13.38         1.7%           16
Totals Top 8                       6035          38.1%                        $519.77       65.5%

This is summarized here:

•     M&T made 842 loans (5.3% of the market) totaling $212.9 million (26.8% of the market), so it ranked 1st in dollar
      volume of lending
•     Five Star made 757 loans (4.8% of the market) totaling $89.6 million (11.3% of the market), so it ranked 2nd in
      dollar volume of lending
•     Canandaigua NB ranked 3rd in dollar volume of lending by making 984 loans (6.2% of the market) totaling $79.4
      million (10% of the market)
•     JPMorgan Chase made 1,564 loans (9.9% of the market) totaling $40.2 million (5.1% of the market), putting it 5th
      in dollar volume of lending
•     First Niagara ranked 6th in dollar volume of lending by making 444 loans (2.8% of the market) totaling $32.5
      million (4.1% of the market)
•     Bank of America ranked 7th in dollar volume of lending by making 934 loans (5.9% of the market) totaling $31.1
      million (3.9% of the market)
•     Citizens ranked 10th in dollar volume of lending by making 333 loans (2.1% of the market) totaling $20.7 million
      (2.6% of the market)
•     KeyBank made 177 loans (1.1% of the market) totaling $13.4 million (1.7% of the market), so it ranked 16th in
      dollar volume of lending

#AllTogetherNow           16
We would expect a bank’s small business lending market share to be in line with its depository market share. Overall, the top 8 banks do not meet this expectation. Together, the top 8 banks captured 66% of the Rochester area’s small business dollar volume lending market, significantly smaller than their combined 83% depository market share. Some banks, however, met or exceeded their depository market shares with respect to their dollar volume of small business lending—M&T, Five Star and Canandaigua NB. Bank of America’s 7th place dollar volume lending ranking exceeded its 8th place depository market share ranking. JPMorgan Chase’s lending is much higher in terms of number of loans compared to its dollar volume of lending because one of its subsidiaries, Chase Bank, is a major small business credit card lender. While not shown here, Chase Bank made 1,471 small business loans in 2015 (all of which were
ii. Lending to businesses in low-moderate income neighborhoods

Of the 15,821 small business loans totaling $793 million made in the Rochester MSA in 2015, only 2,626, or 17%,
totaling $154.8 million, or 20%, went to businesses located in low-moderate income census tracts (see Table 2,
Appendix C). On average, the top 8 banks performed similarly in lending to businesses in low-moderate income
tracts, with 16% of their loans and 21% of their dollar volume of lending going to these businesses.

Some of the top banks, however, outperformed or matched these averages in lending to businesses in low-
moderate income areas:

•   First Niagara made 23% of its loans and 23% of its dollar volume of lending in low-moderate income tracts
•   KeyBank made 20% of its loans and 32% of its dollar volume of lending in low-moderate income tracts
•   M&T made 20% of its loans and 23% of its dollar volume of lending in low-moderate income tracts
•   Canandaigua NB made 18% of its loans and 21% of its dollar volume of lending in low-moderate income tracts

Note that three of these four banks making loans in low-moderate income neighborhoods are local or regional
banks.

iii. Smaller loans

Since 90% of the loans were
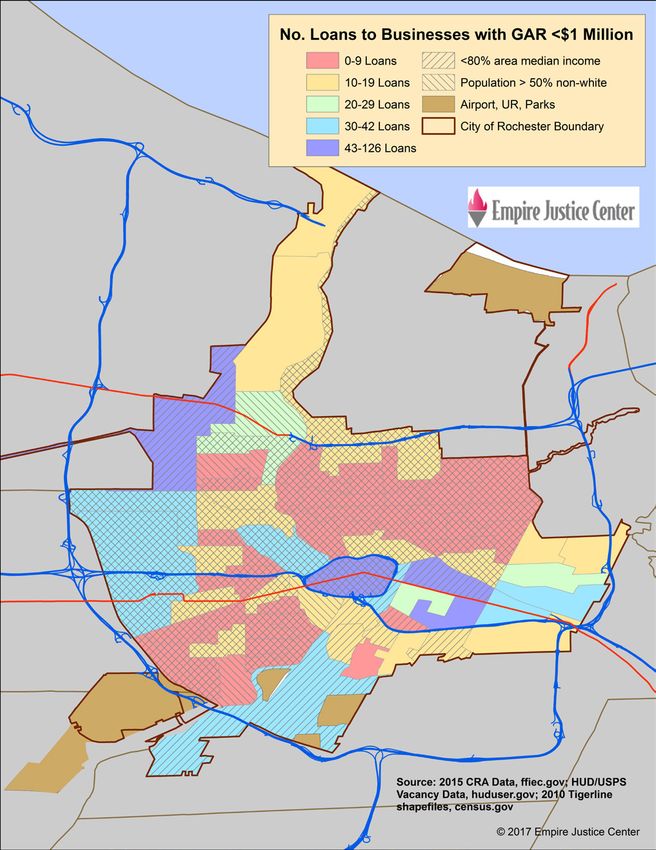
Smaller businesses, those with gross annual revenues less than $1 million or those with less than 500 employees
(according to the Small Business Administration), are important to the nation’s economy. Businesses with less than
500 employees provide jobs for almost one-half of private sector workers,22 and are more likely to hire those with
a high school diploma than are larger firms.23 Businesses with GAR
Of the total dollar volume of lending made by other financial institutions, 6.2% went to businesses with
     GAR
B. ROCHESTER’S TOP SMALL BUSINESS LENDERS In this section, we examine the lending patterns of the Rochester area’s top small business lenders, based on total number of loans and dollar volume of lending, Tables 3 and 4 respectively in Appendix C. i. Top lenders by total number of loans Collectively, the top 8 lenders made 10,979 small business loans in 2015, about 70% of the small business loans made in the Rochester MSA (see Table 3). Here is a summary of the top 8 lenders (by number of loans made): • American Express was by far the top lender, with 2,539 loans and 16% of the market • JPMorgan Chase ranked 2nd with 1,564 loans and 9.9% of the market • Capitol One ranked 3rd with 1,505 loans and 9.5% of the market • Synchrony Bank was 4th with 1,333 loans and 8.4% of the market • US Bank was 5th with 1,143 loans and 7.2% of the market • Canandaigua NB was 6th with 984 loans and 6.2% of the market • Citibank ranked 7th with 977 loans and 6.2% of the market • Bank of America came in 8th with 934 loans and 5.9% of the market Note that only three of the top 8 lenders here are among the Rochester area’s top 8 banks—JPMorgan Chase, Canandaigua NB and Bank of America. The five other lenders are clearly credit card lenders, as 99-100% of their loans were
ii. Top lenders by dollar volume of lending

Table 4, showing the top 8 small business lenders in the Rochester area by dollar volume of lending, looks a lot
more like the top 8 bank lending table, as 6 of the top 8 dollar volume lenders are also among the top 8 banks.

Collectively, the top 8 lenders made $573.6 million in small business lending in 2015, for 72% of the total dollar
volume of lending in the Rochester MSA. Here is a summary of the top 8 dollar volume lenders:

•   M&T was by far the top lender, with $212.9 million in lending and 27% of the market
•   Five Star ranked 2nd with $89.6 million in lending and 11% of the market
•   Canandaigua NB ranked 3rd with $79.4 million in lending and 10% of the market
•   Bank of Castile was 4th with $61.8 million in lending and 7.8% of the market
•   JPMorgan Chase was 5th with $40.2 million in lending and 5.1% of the market
•   First Niagara was 6th with $32.5 million in lending and 4.1% of the market
•   Bank of America ranked 7th with $31.1 million in lending and 3.9% of the market
•   American Express came in 8th with $26.1 million in lending and 3.3% of the market

Five of these top 8 dollar volume lenders are local or regional banks (M&T, Five Star, Canandaigua NB, Bank of
Castile and First Niagara), of which four are among the top 8 banks. Bank of Castile, while not a top 8 bank, is a
local bank. After M&T, Bank of Castile had the highest average loan size of $193,200 per loan. And, given that Bank
of Castile’s dollar volume market shares to businesses with GAR
First Niagara clearly knew how to lend to smaller businesses, and found ways to serve those located in low-
moderate income neighborhoods; 82% of its 444 loans went to businesses with GAR
VI. CONCLUSION

 This report is an attempt to answer several questions about access to credit by Rochester area small businesses.
 Where is small business lending occurring? How are smaller-sized businesses or those wanting smaller loans being
 served? Are businesses getting their loans from banks with a local presence, from outside banks or from credit
 card and online lenders?

 In 2015, loans to small businesses in the Rochester area were most concentrated in suburban Monroe County. As
 a whole, the towns in Monroe County received higher proportions of the loans and the dollar volume of lending
 (both 52%) than expected given their proportion of the MSA’s occupied businesses (45%). Businesses in the city of
 Rochester, in low-moderate income tracts and in communities of color received fewer loans and less of the dollar
 volume of lending than expected by the proportions of businesses in these areas.

 Geographic differences in the number of small business loans are also seen in the maps. Most Monroe County
 towns experienced lending that was higher than the MSA average of 58 loans per census tract. In comparison,
 most of the city of Rochester had fewer loans than the MSA average. In the rest of the MSA, Wayne County
 generally had the lowest levels of lending.

 Ninety percent of the loans originated in 2015 were less than or equal to $100,000, indicating that there is a strong
 market for relatively small loans in the Rochester area. The average loan size was slightly higher in the city of
 Rochester ($58,600) than it was in the Monroe County towns ($51,000) or the rest of the MSA ($45,200).

 Most of the small business lending in the Rochester area in 2015 was to businesses with revenues of $1 million
 or more. Only 46% of the loans in the MSA, and 31% of the dollar volume of lending, were to businesses with
 gross annual revenues under $1 million, even though at the national level these businesses make up 95% of all
 enterprises.

 Our analysis of the Rochester area’s top 8 banks shows that, overall, the MSA’s largest banks penetrated the small
 business lending market less than expected by their depository market share. Together, the top 8 depositories did
 less lending to businesses with GAR
Five of the top 8 institutions making the most loans are large credit card lenders—American Express, Capital
One, Synchrony, US Bank and Citibank. Ninety-nine to 100% of these lenders’ loans were
VII. RECOMMENDATIONS

 Rochester’s shift from a big company high-tech manufacturing region is almost complete. We now have a variety
 of small high tech and service businesses, as well as large service and educational institutions. Rochester also is
 host to a growing immigrant community, members of which are starting micro-businesses to support themselves
 and their families.

 Moreover, as documented in an August 2017 report by Act Rochester, the Rochester area has yet to effectively
 address the “substantial disparities in childhood poverty, overall poverty, academic achievement, earnings and
 homeownership rates between African Americans and Latinos and white populations.”28 Thriving small businesses
 in the city of Rochester can increase the ability of city residents to access jobs and climb out of poverty and for
 these disparities to be reduced.

 A. RECOMMENDATIONS

 For all of these businesses to succeed, no matter their size, sector or geographic area, they need access to
 affordable, responsible credit and lenders who understand Rochester’s changing market. Empire Justice Center
 recommends the following actions to seed a community conversation about how to make this happen.

 1. Expand and enhance the small business lending data that is reported and released to the public to
    allow for more detailed analysis and increased accountability. The Consumer Financial Protection Bureau
    (CFPB) can do this by promulgating a strong rule to implement Section 1071 of the Dodd-Frank Wall Street
    Reform and Consumer Protection Act (Dodd-Frank).29 Advocates and financial institutions should support
    a strong rule by the CFPB and strongly oppose any efforts to repeal Section 1071 or to develop carve-outs
    or exemptions. If a strong Section 1071 rule is approved, some of the new information is likely to include
    the action taken on a business loan application (ie. whether it was approved or denied), as well as the gross
    annual revenue of the business, the race, ethnicity and gender of the principle owner(s), the census tract of the
    business, and the type and purpose of the loan.30 Except for two large gross annual revenue categories, none
    of this information is currently available to the public. Such data will be extremely valuable in helping ensure
    fair lending to small businesses, particularly those owned by women and people of color.

 2. Support the Small Business Borrowers’ Bill of Rights (BBoR) by either becoming a signatory or endorser.31
    The BBoR identifies six fundamental rights that all small business owners seeking financing should have, along
    with specific practices by lenders and brokers that are necessary to uphold and protect these rights. They are
    rights to transparent pricing and terms, non-abusive products, responsible underwriting, fair treatment from
    brokers, inclusive credit access and fair collections practices. Lenders can become signatories, attesting that
    they abide by all of the requirements of the BBoR. Organizations that are not directly involved in lending but
    that support responsible business lending practices can endorse the BBoR.

 3. Increase affordable loan options for young or start-up small businesses. Banks can work with local
    community advocates, economic development officials, community development financial institutions (CDFIs)
    and the business community to craft a product that is affordable and makes business sense. Some banks only
    offer credit card loans for businesses younger than 2 years. These banks should be encouraged to refer these
    businesses to CDFIs, so they don’t have to resort to a higher cost credit card loan or a predatory loan from an
    online or merchant cash advance lender.

#AllTogetherNow        26
4. Banks need to adequately fund CDFIs to make smaller loans and provide technical assistance to new or
young businesses. However, funding of CDFIs cannot replace doing the work of underwriting and originating
small business loans; banks need to do this as well. When businesses are not ready for a loan, banks can refer
them to CDFIs for credit repair and technical assistance. CDFIs can return the favor by referring businesses to
banks for a more traditional loan product when ready.
5. Ensure adequate financing of federal and state funds that support CDFIs. The U.S. Treasury CDFI Fund is
under threat of being gutted in the 2018 federal executive budget where its funding would go from $248
million to $14 million.32 The New York State CDFI Fund, modeled after the federal fund, was created by
legislation in 2007. However, it has yet to receive any appropriations.33
6. Increase the visibility of CDFIs’ loan products and technical support services. CDFIs should work together
at the local level to market their products and services and work with their supervising organizations to get
marketing support. Banks should provide funding and/or technical support for the marketing of what CDFIs
offer.
7. States should have the power to regulate fintech companies. While the Office of the Comptroller of the
Currency (OCC) is considering creating a new “special purpose” national bank charter for fintech lenders,34
fintechs can currently apply for an industrial loan company (ILC) charter and be regulated by the OCC. Social
Finance, Varo and Square have all applied to the OCC for regulatory approval to expand their ability to lend to
small businesses under an ILC charter.35 If the OCC approves these charter applications, fintech lenders will be
able to lend all over the country and charge higher interest rates than are allowed under New York State and
other state laws. In January 2017, NY Department of Financial Services (DFS) Superintendent, Maria T. Vullo,
submitted a comment letter opposing the OCC’s proposal to create a special purpose national bank charter for
fintech companies,36 and in May 2017, the department sued the OCC.37 DFS argued that, instead of the OCC
granting national charters that would allow fintech institutions to avoid state usury caps, New York should
license and regulate fintechs. In December 2017, a federal judge dismissed the DFS’s May lawsuit, saying that
since the OCC had yet to reach a decision on fintech charters, the case was filed too early.38
#AllTogetherNow 27APPENDIX A APPENDIX A 28
I. METHODOLOGY

Aggregate data. Empire Justice obtained the 2015 aggregate CRA small business lending data from the public
data files at Federal Financial Institutions Examination Council (FFIEC), specifically Table A1-1, Small Business Loans
by County - Originations from the Council’s flat files,39 and used the count and dollar volume of small business
loan originations by census tract for the Rochester MSA. Some of the totals in this report that used this data may
be slightly different than overall small business lending totals, due to some of the data reported with “tract not
known.” This data set includes small business loans made via business credit card loans.

Lender data. Empire Justice obtained the 2015 CRA small business lending disclosure data from the National
Community Reinvestment Coalition (NCRC), which obtained the data from Federal Financial Institutions
Examination Council (FFIEC), specifically Table D1-1, Small Business Loans by County – Originations.40 NCRC then
filtered the data to obtain the count and dollar volume of CRA small business loans (totals and those in low-
moderate income census tracts) by lender for the Rochester MSA. This data set includes small business loans made
via business credit card loans.

Estimating the number of businesses. HUD aggregates by census tract US Postal Service (USPS) data on residential
and business vacancies.41 Using several fields from this data, Empire Justice created an estimate of the number
of occupied businesses in each census tract as of March 31, 2017. It was calculated as: Estimated number
occupied businesses = Total Count of Business Addresses – (Total Count of Vacant Business Addresses + Total
Count of No Statistics Business Addresses). “No Statistics Business Addresses” can be classified as no-stat for many
reasons, including: Rural Route addresses vacant for 90 days or longer; addresses for businesses or homes under
construction and not yet occupied; addresses in urban areas identified by a carrier as not likely to be active for
some time. We believe this approach conservatively estimates the number of businesses occupied as of March 31,
2017. Thanks to the National Community Reinvestment Coalition (NCRC) for providing the original HUD dataset.

Mapping. The maps were created using the aggregate CRA small business lending data and laying the estimated
number of occupied businesses per census tract over the colors signifying the number of loans per census tract.
The dots do not indicate the actual location of businesses. The mapping program, ARC GIS, scatters the dots
randomly throughout each census tract, giving a sense of the density of occupied businesses in each tract.

The number of loans for each type of loan (total CRA loans, loans
APPENDIX B: MAPS

APPENDIX B   30
FIGURE 2: NUMBER BUSINESSES BY CENSUS TRACT AS OF MARCH 31, 2017 (ROCHESTER, NY)
FIGURE 3: NUMBER BUSINESSES BY CENSUS TRACT AS OF MARCH 31, 2017 (MONROE COUNTY, NY)
FIGURE 4: TOTAL NUMBER CRA SMALL BUSINESS LOANS - 2015, AND NUMBER OF BUSINESSES, BY
CENSUS TRACT (ROCHESTER, NY)
FIGURE 5: TOTAL NUMBER CRA SMALL BUSINESS LOANS - 2015 AND NUMBER OF BUSINESSES, BY
CENSUS TRACT (MONROE COUNTY, NY)
FIGURE 6: NUMBER LOANS
FIGURE 7: NUMBER LOANS
FIGURE 8: NUMBER LOANS TO BUSINESSES WITH GROSS ANNUAL REVENUES UNDER $1 MILLION BY
CENSUS TRACT, 2015 (ROCHESTER, NY)
FIGURE 9: NUMBER LOANS TO BUSINESSES WITH GROSS ANNUAL REVENUE UNDER $1 MILLION BY
CENSUS TRACT, 2015 (MONROE COUNTY, NY)
FIGURE 10: NUMBER BUSINESSESS BY CENSUS TRACT AS OF MARCH 31, 2017 (ROCHESTER NY MSA)
FIGURE 11: TOTAL NUMBER CRA SMALL BUSINESS LOANS - 2015, AND NUMBER OF BUSINESSES,
BY CENSUS TRACT (ROCHESTER, NY MSA)
FIGURE 12: NUMBER LOANS
FIGURE 13: NUMBER LOANS TO BUSINESSES WITH GROSS ANNUAL REVENUES UNDER $1 MILLION
BY CENSUS TRACT, 2015 (ROCHESTER NY MSA)
APPENDIX C: TABLES

                     APPENDIX C   43
Table 1: Offices and Deposits of all FDIC-Insured Institutions, Rochester NY MSA
Deposit Market Share Report, as of June 30, 2015
Outside of Market Inside of Market
Institution Name CERT State Bank State/ No. of Deposits No. of Deposits Market
Rank (Hqtrd) Class Federal Offices ($000) Offices ($000) Share
Charter
1 Manufacturers and Traders Trust Company 588 NY SM State 680 69,435,147 31 4,067,862 24.57%
2 JPMorgan Chase Bank, National Association 628 OH N Federal 5,517 1,067,217,028 28 2,207,972 13.34%
3 The Canandaigua National Bank and Trust Company 6985 NY N Federal 0 0 25 1,821,820 11.01%
4 Citizens Bank, National Association 57957 RI N Federal 818 71,764,107 33 1,575,129 9.52%
5 First Niagara Bank, National Association 16004 NY N Federal 387 27,565,021 20 1,395,054 8.43%
6 KeyBank National Association 17534 OH N Federal 979 71,492,706 23 1,076,380 6.50%
7 Five Star Bank 659 NY SM State 30 1,716,822 20 956,098 5.78%
8 Bank of America, National Association 3510 NC N Federal 4,847 1,168,791,585 14 777,157 4.69%
9 The Lyons National Bank 7151 NY N Federal 2 80,011 10 673,182 4.07%
10 Community Bank, National Association 6989 NY N Federal 165 5,593,217 19 626,848 3.79%
11 The Bank of Castile 13292 NY NM State 9 582,823 10 412,184 2.49%
12 Genesee Regional Bank 26333 NY NM State 0 0 3 372,817 2.25%
13 Fairport Savings Bank 30056 NY SB State 0 0 5 177,683 1.07%
14 USNY Bank 58541 NY NM State 2 87,199 1 120,084 0.73%
15 Northwest Bank 28178 PA SB State 157 5,880,396 5 92,533 0.56%
16 Generations Bank 16040 NY SB Federal 6 151,088 3 53,334 0.32%
17 The Upstate National Bank 13748 NY N Federal 2 24,989 1 50,047 0.30%
18 Medina Savings and Loan Association 30547 NY SL State 0 0 1 46,460 0.28%
19 Savannah Bank National Association 14619 NY N Federal 4 98,617 1 27,210 0.16%
20 Steuben Trust Company 12936 NY NM State 12 396,111 2 21,718 0.13%
21 Woodforest National Bank 23220 TX N Federal 749 3,962,586 3 2,386 0.01%
Top 8 Banks 13,258 2,477,982,416 194 13,877,472 83.84%
Number of Institutions in the Market: 21 TOTALS 14,366 2,494,839,453 258 16,553,958 100Table 2: Top 8 Banks Small Business Lending, 2015
Top 8 Depositories, Rochester, NY MSA
Number of Loans
AFI BOA CNB Citizens FNFG Five Star JPMC KeyBank M&T Top 8 OFI
Number of Loans Ranking Among All 8 6 12 11 10 2 17 9
Rochester MSA Total 15,851 934 984 333 444 757 1564 177 842 6,035 9,816
Rochester MSA in LMI CT 2,626 174 177 48 101 93 181 35 171 980 1,646
Loan AmtTable 3: Top 8 CRA Small Business Lenders, 2015
(By Total Number of Loans)
Rochester, NY MSA
Number of Loans
American Capital Synchrony
AFI Express JPMC One Bank US Bank CNB Citibank BOA Top 8 OFI
Rochester MSA Total 15,851 2,539 1,564 1,505 1,333 1,143 984 977 934 10,979 4,872
Rochester MSA in LMI CT 2,626 404 181 282 193 179 177 200 174 1,790 836
Loan AmtTable 4: Top 8 CRA Small Business Lenders, 2015
(By Total Dollar Volume of Lending)
Rochester, NY MSA
Number of Loans
Bank of Am
AFI M&T Five Star CNB Castile JPMC FNFG BOA Express Top 8 OFI
Rochester MSA Total 15,851 842 757 984 320 1,564 444 934 2,539 8,384 7,467
Rochester MSA in LMI CT 2,626 171 93 177 51 181 101 174 404 1,352 1,274
Loan AmtEND NOTES
1. Some of Empire Justice Center’s reports can be found at: http://www.empirejustice.org/assets/pdf/publications/reports/paying-more-for-the-american.
pdf
http://www.empirejustice.org/assets/pdf/publications/reports/river-runs-dry-ii.pdf
http://www.empirejustice.org/assets/pdf/publications/reports/monroe-report--in-the-eye-of-the-storm/report-in-the-eye-of-the-storm.pdf.
2. See this comment letter at: http://www.empirejustice.org/assets/pdf/policy-advocacy/comments/grcrc-jpmc-crc-letter.pdf.
3. Woodstock Institute. August 2017. Patterns of Disparity: Small Business Lending in the Detroit and Richmond Regions. As found at: http://www.wood-
stockinst.org/sites/default/files/attachments/Detroit%20and%20Richmond%20Report%20Website.pdf.
4. Federal Reserve System. April 2017. Small Business Credit Survey: Report on Employer Firms. As found at: https://www.newyorkfed.org/medialibrary/me-
dia/smallbusiness/2016/SBCS-Report-EmployerFirms-2016.pdf.
5. California Reinvestment Coalition. September 2017. Displacement, Discrimination and Determination: Small Business Owners Struggle to Access Afford-
able Credit; Results from a Statewide Survey in California. As found at: http://www.calreinvest.org/system/resources/W1siZiIsIjIwMTcvMDkvMTMvMjM-
vMTcvMDYvODk5L0NSQ19TbWFsbF9CdXNpbmVzc19SZXBvcnQucGRmIl1d/CRC%20Small%20Business%20Report.pdf.
6. Woodstock Institute. August 2017. Patterns of Disparity: Small Business Lending in the Detroit and Richmond Regions. As found at: http://www.wood-
stockinst.org/sites/default/files/attachments/Detroit%20and%20Richmond%20Report%20Website.pdf.
7. Karen Mills Brayden McCarthy. April 26, 2017. How Banks Can Compete Against an Army of Fintech Startups. Harvard Business Review. As found at:
https://hbr.org/2017/04/how-banks-can-compete-against-an-army-of-fintech-startups.
8. The Opportunity Fund. May 2016. Unaffordable and Unsustainable: The New Business Lending on Main Street. As found at: http://www.opportunityfund.
org/assets/docs/Unaffordable%20and%20Unsustainable-The%20New%20Business%20Lending%20on%20Main%20Street_Opportunity%20Fund%20
Research%20Report_May%202016.pdf.
9. See methodology section for source and methodology on number of businesses.
10. Learn more at: http://www.venturejobs.org/InvestmentPrograms/RochesterFund.aspx.
11. See the following articles: https://rbj.net/2017/10/11/venture-jobs-foundation-plans-meeting-on-accelerator-program/ and
https://rbj.net/2017/06/02/jpmorgan-grant-to-create-jobs-program/
12. See Appendix A: Methodology for more information on the mapping.
13. Mean is the numerical average of a set of data points, determined by adding all the data points and then dividing the total by the number of points.
Median is the middle value, and is determined by arranging the set of data points in order from smallest to largest, and finding the middle value (if there
is an odd number of data points) or the average of the two middle values (if there is an even number of data points). (http://stattrek.com/statistics/dictio-
nary.aspx).
14. Note that we do not compare the number of businesses in a census tract to the number of loans to businesses with GAREND NOTES
36. NYS DFS. January 1, 2017. Press Release: DFS SUPERINTENDENT VULLO SUBMITS COMMENT LETTER TO OCC IN OPPOSITION OF PROPOSED SPECIAL PUR-
POSE NATIONAL BANK CHARTER FOR “FINTECH” COMPANIES. As found at: http://www.dfs.ny.gov/about/press/pr1701171.htm.
37. Karen Freifeld. May 12, 2017. NY regulator sues U.S. OCC over national charters for online lenders. Reuters. As found at: https://www.reuters.com/article/
us-new-york-occ-fintech/ny-regulator-sues-u-s-occ-over-national-charters-for-online-lenders-idUSKBN1882QO.
38. Karen Friefeld. December 12, 2017. Judge tosses NY lawsuit over national charters for online lenders. Reuters. As found at: https://www.reuters.com/arti-
cle/us-new-york-occ-fintech/judge-tosses-ny-lawsuit-over-national-charters-for-online-lenders-idUSKBN1E62UD.
39. As found at: https://www.ffiec.gov/cra/craflatfiles.htm.
40. This can be found at: https://www.ffiec.gov/cra/craflatfiles.htm.
41. This can be found at: https://www.huduser.gov/portal/usps/index.html.
END NOTES 49EMPIRE JUSTICE CENTER
Albany ♦ Long Island ♦ Rochester ♦ Westchester
www.empirejustice.orgYou can also read