Housing in Elmbridge Facts & figures - December 2019 - Elmbridge Borough ...
←
→
Page content transcription
If your browser does not render page correctly, please read the page content below
Housing in Elmbridge
                Facts & figures

December 2019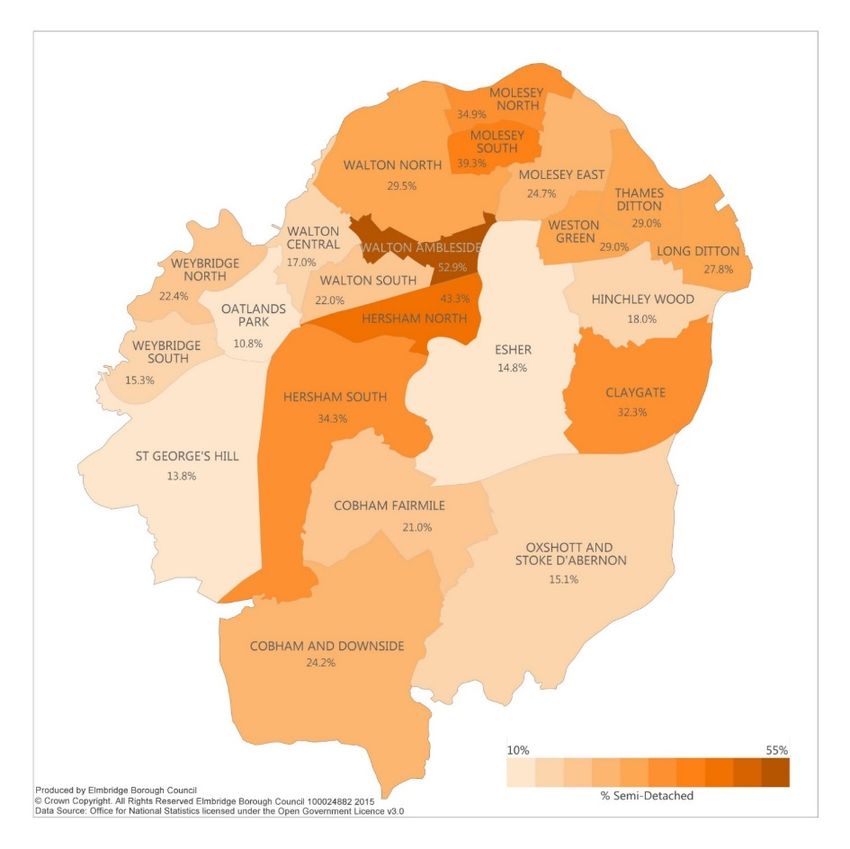
Contents
        Introduction.......................................................................................................3
       Chapter 1 ...........................................................................................................4
       People & population ...........................................................................................
       Chapter 2 .........................................................................................................12
       The housing stock in Elmbridge........................................................................
       Chapter 3..........................................................................................................27
       Fuel poverty, energy efficiency & carbon reduction .......................................
       Chapter 4..........................................................................................................30
       The housing market in Elmbridge .....................................................................
       Chapter 5 .........................................................................................................37
       Supply & demand of affordable housing in Elmbridge ...................................
       Chapter 6 .........................................................................................................40
       Trends in homelessness ....................................................................................
       Chapter 7 .........................................................................................................42
       Housing Benefits & Welfare Reform .................................................................

                                                             2
Published by the Housing Service                                  Originally produced March 2015 – updated December 2019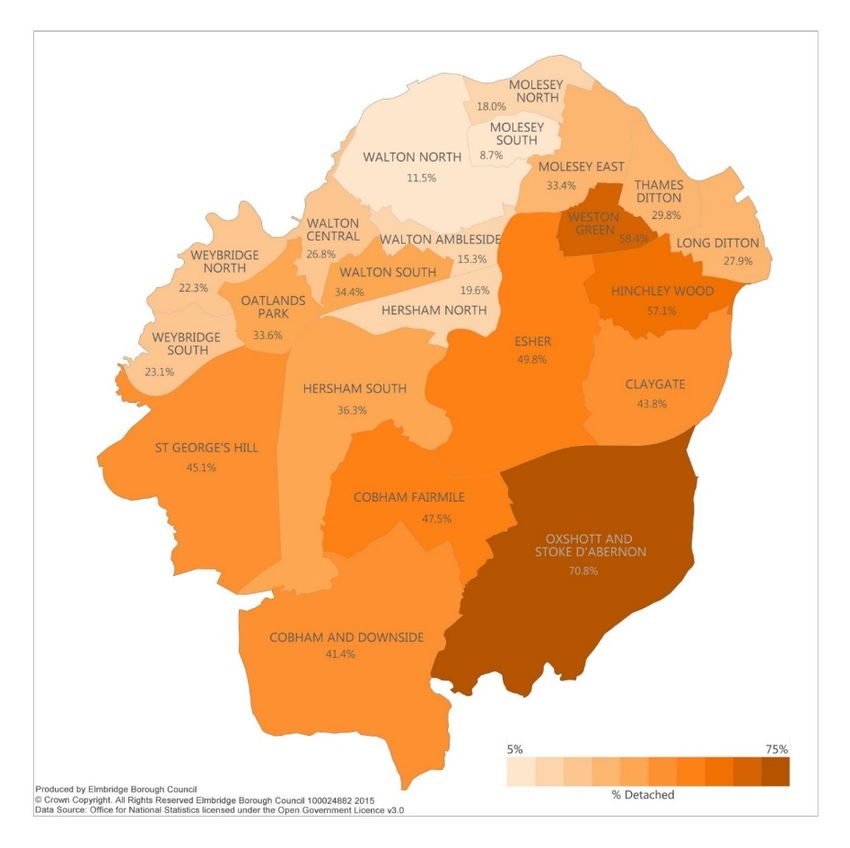
I. Introduction and strategic context
This document is the evidence base to accompany Elmbridge Borough Council’s
Housing, Homelessness & Rough Sleeping Strategy 2020 - 24. Its purpose is to
provide a statistical overview of housing within Elmbridge, presenting and explaining
a range of information through the use of tables and graphics.
Where appropriate, data covering Elmbridge is compared with that elsewhere, usually
with other boroughs and districts in Surrey, South East England and nationwide.
The evidence base covers a range of issues, from population change through to the
energy efficiency of the housing stock. Much of the content is already available to
the public and has been compiled from various sources. In some cases, the data has
been collated from information held by the Council.
The evidence base should help highlight issues and patterns within Elmbridge,
including the key features of the local housing market and the supply of and need for
affordable housing here. It also informs the selection of priorities and objectives
contained within the aforementioned strategy.
The evidence base will be updated on a regular basis to help inform any reviews of
the strategy which it supports.
Any queries or comments about the content should be directed to the Housing
Strategy & Enabling Team, which can be contacted via:
housingpolicy@elmbridge.gov.uk or telephone: 01372 474 631 or 01372 474 632.
3
Published by the Housing Service Originally produced March 2015 – updated December 2019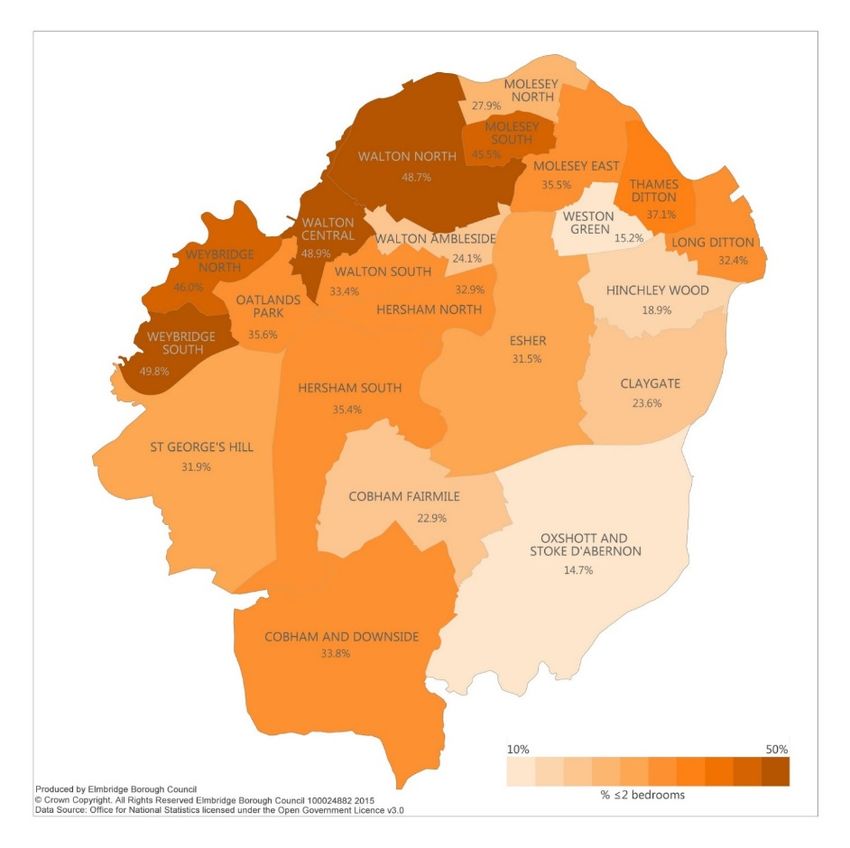
1        People and Population
1.1        Overall Population
1.1.1      Figure 1 below shows the respective populations of the eleven boroughs and districts
           within Surrey, as first recorded by the 2011 Census, with Elmbridge having the third
           largest population in Surrey, recorded as 130,875, with updated figures as estimates
           for 2018. Elmbridge is still the third largest population in Surrey, with an increase of
           8,939 (7.3%) in the population of 121,936, up to 2011, and an estimated additional
           growth of 5,751 persons up to 2018.
         Figure 1 Population of Surrey boroughs & districts (usual residents), 2011 – 2018

                                   Source: 2011 census and NOMIS estimate October 2019

1.1.2      The latest mid-year estimate, for 2018, estimated that the population of Elmbridge
           was 136,626, an increase of 5,751 (4.4%) on the 2011 Census figure.
Source:
https://www.ons.gov.uk/peoplepopulationandcommunity/populationandmigration/populationestimates/bulletins/a
nnualmidyearpopulationestimates/mid2018

1.2        Ethnic profile of Elmbridge

1.2.1      Table 1 below provides a breakdown of the ethnicity of Elmbridge’s population as at
           the 2011 Census, in absolute and proportionate sizes. It compares the borough’s
           ethnicity with county and national levels. It shows that the proportion of Elmbridge’s
           population recorded as White British at the time of the 2011 Census was almost
           identical to the national figure (79.9% compared to 79.8%). There are some
           differences in the relative proportion of the ethnic minority groups, with Elmbridge
           having a considerably larger percentage of its population in all Other White groups
           (10.4%) compared to the national and county-figures but a smaller proportion of other
                                                   4
Published by the Housing Service                       Originally produced March 2015 – updated December 2019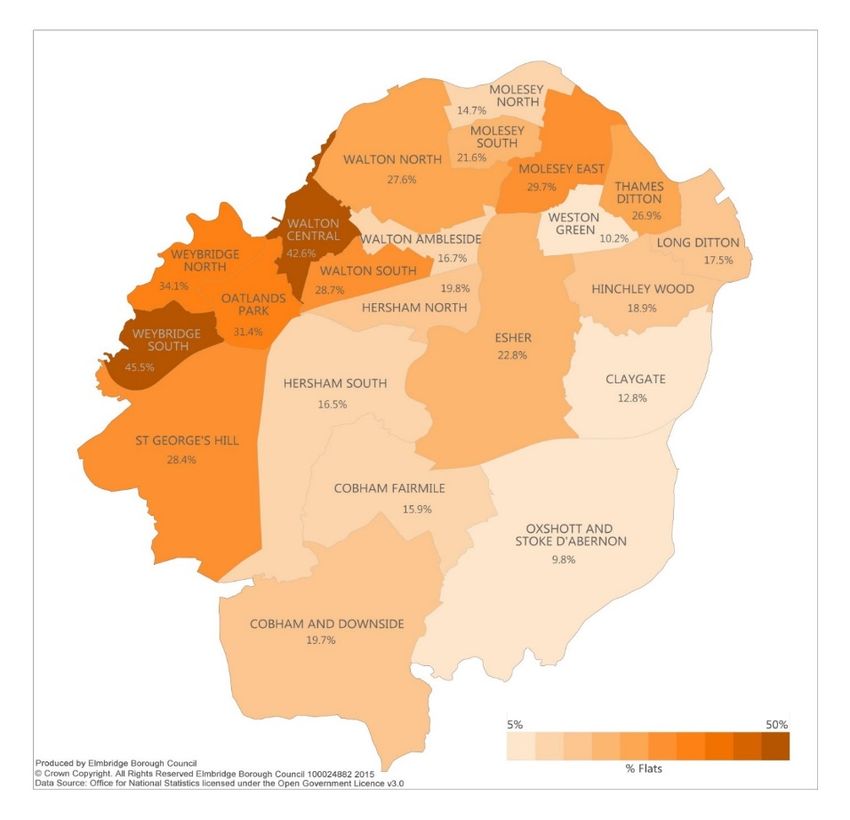
certain ethic groups (e.g. those of Pakistani, Black African / Caribbean or Other Black
           origins).
         Table 1- Ethnicity in Elmbridge, Surrey & England – 2011 Census
   2011 Census - Ethnic group                              Elmbridge Elmbridge          England      Surrey
                                                           number      %
   White: English/Welsh/Scottish/Northern Irish/British      104,508      79.9             79.8           83.5
   White: Irish                                                2,072       1.6               1             1.1
   White: Gypsy or Irish Traveller                              153        0.1              0.1            0.2
   White: Other White                                         11,390       8.7              4.6            5.5
   Mixed/multiple ethnic group: White and Black Caribbean       521        0.4              0.8            0.4
   Mixed/multiple ethnic group: White and Black African         347        0.3              0.3            0.2
   Mixed/multiple ethnic group: White and Asian                1,550       1.2              0.6            0.9
   Mixed/multiple ethnic group: Other Mixed                     993        0.8              0.5            0.6
   Asian/Asian British: Indian                                 2,489       1.9              2.6            1.8
   Asian/Asian British: Pakistani                               555        0.4              2.1             1
   Asian/Asian British: Bangladesh                              504        0.4              0.8            0.3
   Asian/Asian British: Chinese                                1,143       0.9              0.7            0.8
   Asian/Asian British: Other Asian                            2,384       1.8              1.5            1.7
   Black/African/Caribbean/Black British: African               620        0.5              1.8            0.7
   Black/African/Caribbean/Black British: Caribbean             272        0.2              1.1            0.3
   Black/African/Caribbean/Black British: Other Black           118        0.1              0.5            0.1
   Other ethnic group: Arab                                     597        0.5              0.4            0.4
   Other ethnic group: Any other ethnic group                   659        0.5              0.6            0.5
   All categories: Ethnic group                              130,875      100              100            100
                                       Source: 2011 Census – table DC4201EW

                                       Source: 2011 Census – table DC4201EW

1.3        Place of birth of Elmbridge residents

1.3.1      The 2011 Census recorded the country of birth of those residents in Elmbridge at that
           time and the date of arrival into the UK of those born abroad. This showed that 5,734
           (4.4% of the borough’s population) had migrated to the UK between 2007 and 2011.
           Cobham Fairmile and Cobham and Downside recorded the largest number of
           residents who had arrived in the UK between 2007-11, with 487 and 499
           respectively, with Walton North the lowest at 139.
                                             5
Published by the Housing Service                 Originally produced March 2015 – updated December 2019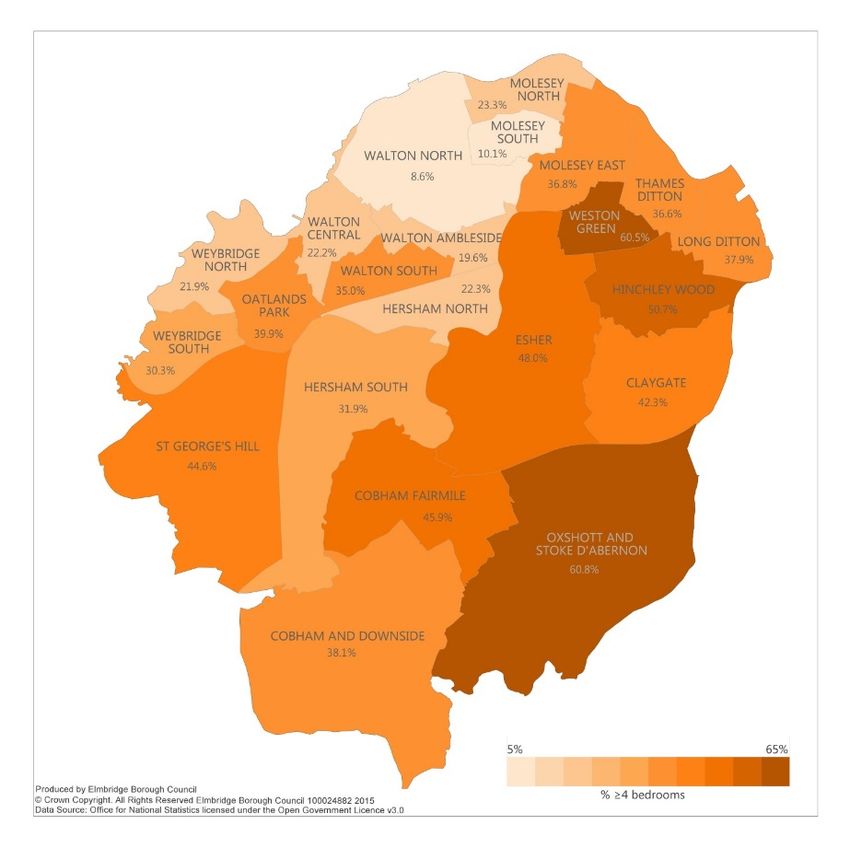
1.3.2 Table 2 below provides a breakdown of the country of birth of Elmbridge’s population
as at 2011 and the numbers of those born abroad, who moved to the UK between
2007 and 2011. This shows that those born in continental Europe accounted for the
single largest group of new arrivals (at 1,780) closely followed by those from The
Americas and the Caribbean (1,581).
Table 2 - Country of Birth of Elmbridge Residents (2011) and Arrivals to UK 2007-11
Country of Birth All categories Born in Born Arrived
the UK outside UK 2007-11
All categories 130,875 106,959 23,916 5,734
Europe total 115,733 106,959 8,774 1,865
Of which – Ireland 1,463 0 1,463 85
Of which - Other Europe 7,311 0 7,311 1,780
Africa 4,446 0 4,446 719
Middle East and Asia 5,694 0 5,694 1,295
The Americas and the Caribbean 3,793 0 3,793 1,581
All other 1,209 0 1,209 274
Source (above): 2011 Census - ONS table LC2804EW
1.4 Migration in to and out from Elmbridge
1.4.1 The 2011 Census collected information on where households were living one year
previously. The headline data for Elmbridge revealed considerable movement in and
out and within the borough over the twelve-month period. The headline information
was:
45,595 households in Elmbridge lived at the same address one year before
1,845 households in Elmbridge had moved within Elmbridge within the previous
year
2,655 households had moved into Elmbridge in the previous 12 months (2,108
from elsewhere in the UK and 547 from outside of the UK)
1,997 households previously resident in Elmbridge one year before were now
living elsewhere in the UK.
1.5 Age structure of the borough
1.5.1 Table 3 (following below) compares the age structure of Elmbridge as measured by
the 2001 Census with the position in 2011. It shows that the largest percentage rises
in population were concentrated amongst those aged 60 to 64 and those aged 85
and over. There were contractions in the population within the age bands 25 to 29
(seeing an 11% fall) and amongst the 30 to 44-year old band. Table 3 shows how
the borough’s population is ageing and the population projections set out below
indicate that the growth in the older people’s population is set to continue over the
decades to come.
6
Published by the Housing Service Originally produced March 2015 – updated December 2019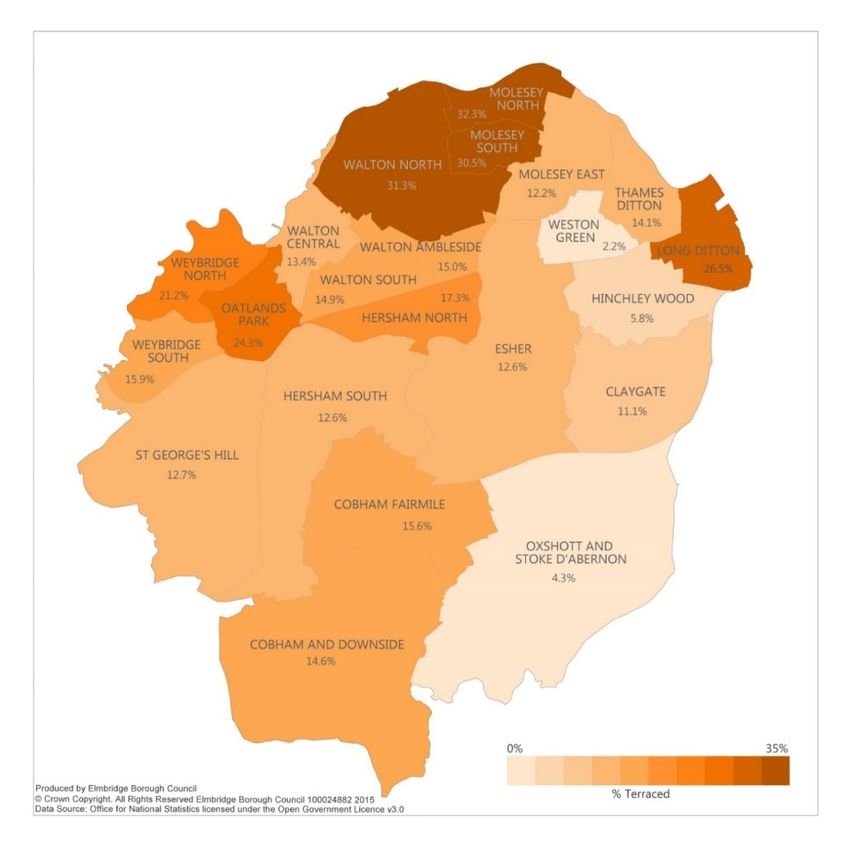
Table 3 Age structure of Elmbridge Population, 2001-11
            Age band                                      Numerical change Percentage change
                                     2001        2011         2001- 2011          2001-2011
            Age 0 to 4               8,037       9,358          1,321                16%
            Age 5 to 9               8,284       8,639            355                 4%
            Age 10 to 14             7,463       8,315            852                11%
            Age 15 to 19             6,226       7,155            929                15%
            Age 20 to 24             5,038       5,109             71                 1%
            Age 25 to 29             6,802       6,036           -766               -11%
            Age 30 to 44            29,725      29,607           -118                 0%
            Age 45 to 59            24,727      27,470          2,743                11%
            Age 60 to 64             5,671       7,668          1,997                35%
            Age 65 to 74             9,739      10,540            801                 8%
            Age 75 to 84             7,247       7,316             69                 1%
            Age 85 to 89             1,909       2,344            435                23%
            Age 90 and over          1,068       1,318            250                23%
            Total                  121,936     130,875          8,939                 7%
                                         Source: 2011 & 2011 Census – Table KS102EW

                                        Source: 2011 & 2011 Census – Table KS102EW

1.6       General health
          Table 4 (following below) records the general health of Elmbridge’s population at the
          time of the 2011 Census (based on self-assessment). The table and the
          accompanying chart show that the borough has a higher proportion of its population
          in very good or good health than the regional or national levels and a correspondingly
          lower proportion who regard themselves as being in poor health.
               Table 4 General health of the population, 2011
           Self-assessed           Very good      Good           Fair           Bad           Very bad
               health                health       health        health         health          health
              Elmbridge          73,880       40,555            12,360         3,213              867
            Elmbridge (%)         56.5         31.0               9.4           2.5               0.7
              Surrey (%)          52.4         33.6              10.6           2.7               0.8
             England (%)          47.2         34.2              13.1           4.2               1.2
                  Source: 2011 Census – KS301EW

                                                  7
Published by the Housing Service                      Originally produced March 2015 – updated December 2019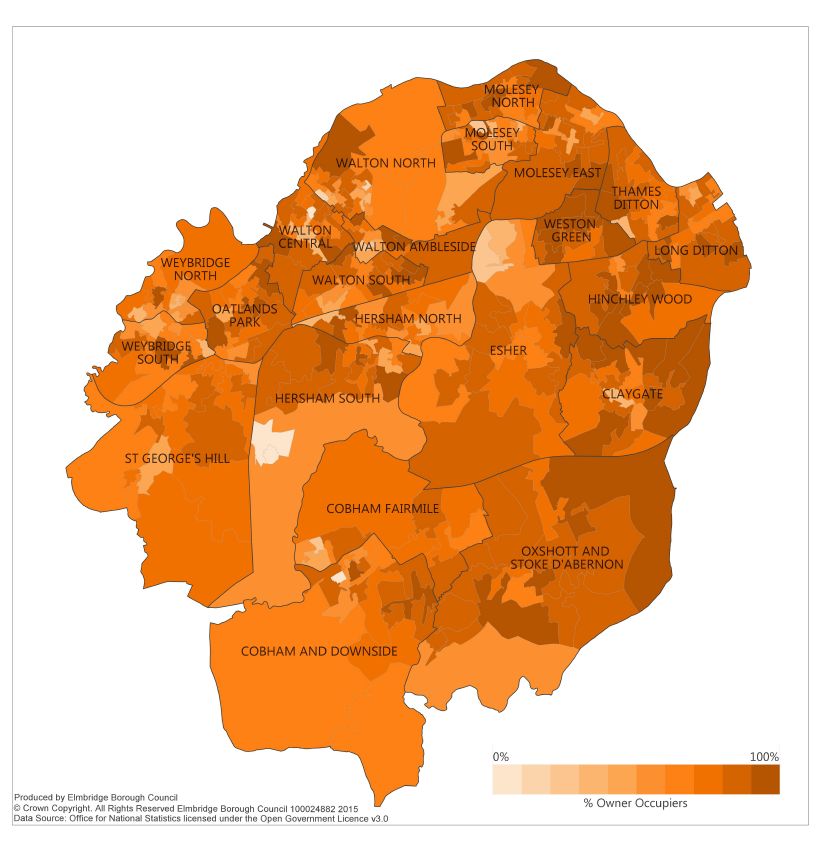
Figure 2 General health of the population, 2011

                                              Source: 2011 Census – KS301EW

1.7        Household numbers & projections

1.7.1      A household is defined as one person living alone, or a group of people (not
           necessarily related) living at the same address who share cooking facilities and share
           a living room, sitting room or dining room. Table 5 below shows the changes in
           household numbers within Elmbridge and other geographies, recorded between 2001
           and 2011. It reports an increase of 2,301 households (4.3%) to 52,922.

                        Table 5 Change in total household numbers between 2001 & 2011
                   Area            2001 Census    2011 Census         2001-2011 change           % change
             Elmbridge                50,621           52,922             2,301                     4.3%
             Surrey                  433,176          455,791            22,615                     5.0%
             South East             3,287,489        3,555,463          267,974                     8.2%
             England               20,451,427       22,063,368         1,611,941                    7.9%
                                            Source: 2011 Census – Table KS402EW
1.7.2      The latest projections (CLG Live Table 406) for household numbers (based on past
           trends) indicate that the number of households in Elmbridge will rise to 58,000 by
           2021, which would represent an increase of 5,000 (9.6%) compared to the figure
           recorded by the 2011 Census.

1.8       Population projections in Elmbridge 2014 – 2039

1.8.1      The population projections provided by Office of National Statistics (ONS) are based
           on predictions around birth and death rates and changes in population resulting from
           migration. Figure 3 (following) shows the population projection for Elmbridge
           covering the 25 years from 2014 to 2039.

                                                      8
Published by the Housing Service                          Originally produced March 2015 – updated December 2019
Figure 3 Projection in Elmbridge population growth from 2014–2039

         Source: ONS – 2014-based Subnational Population Projections for England (Published 2016)

1.8.2      Population and household growth help to drive growth in housing requirements and
           population change influences the different types and size of housing required.
           According to the ONS, the borough’s population is forecasted to grow to nearly
           153,500 by 2039, a rise of just under 21,000 (15.6%) over 25 years, as shown by
           Figure 3 above.

1.8.3      Table 6 below provides a more detailed breakdown of these projections, looking at
           five-year intervals and changes within five-year age-bands. This shows significant
           variations in the rate of population change across different age groups.

1.8.4      For example, to 2039, it is projected that a key part of the working-age population
           (those aged between 30 and 49) will fall in absolute and relative terms. At the same
           time, approximately two-thirds of the growth is predicted to come about through an
           increase in the numbers of older people, with the population of those aged 70 or
           more set to rise from 17,000 to 29,000 by 2039. The largest growth (in percentage
           terms) is forecasted to occur amongst those aged 90 and above, with this group
           forecasted to grow from 1,600 in 2014 to 1,800 by 2019 and 4,500 by 2039, a rise of
           181%.
         Table 6 Population projections by age group in Elmbridge (2014-2039 – 5-year band)
                                                                                                            %
   Projected population            2014      2019         2024        2029         2034        2039
                                                                                                            change
   all people - All ages           132,800   137,200      142,100     146,400      150,100      153,500       15.58%
   all people - Age 0-4            10,000     9,700        9,900        9,800       9,700        9,700        -3.00%
   all people - Age 5-9             9,500    10,700       10,400       10,600       10,500      10,400        9.47%
   all people - Age 10-14           8,400     9,400       10,500       10,300       10,500      10,400        23.80%
   all people - Age 15-19           7,400     7,100        8,000        8,900       8,700        8,900        20.27%
   all people - Age 20-24           4,600     4,000        3,700        4,200       4,600        4,500        -2.17%
   all people - Age 25-29           5,100     5,700        5,100        4,800       5,500        5,900        15.68%

                                                      9
Published by the Housing Service                          Originally produced March 2015 – updated December 2019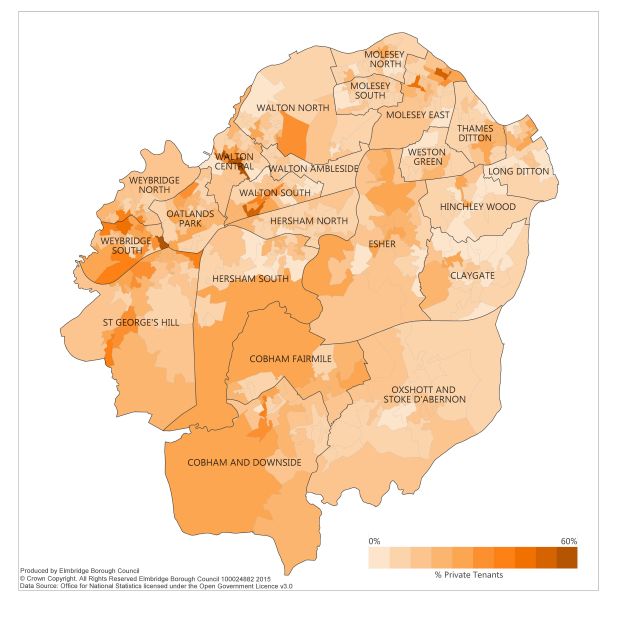
all people - Age 30-34          7,400    6,900      7,200        6,800       6,400        7,200        -2.70%
   all people - Age 35-39          10,100   9,700      9,400        9,600       9,200        8,700       -13.86%
   all people - Age 40-44          10,900   10,700    10,700       10,500       10,700      10,200        -6.42%
   all people - Age 45-49          11,000   10,700    10,600       10,800       10,600      10,800        -1.81%
   all people - Age 50-54          10,100   10,400    10,300       10,300       10,500      10,400        2.97%
   all people - Age 55-59          7,900    9,500     10,000        9,800       9,700       10,000        26.58%
   all people - Age 60-64          6,900    7,300      8,800        9,300       9,100        9,100        31.88%
   all people - Age 65-69          6,900    6,300      6,700        8,100       8,500        8,400        21.73%
   all people - Age 70-74          5,000    6,300      5,800        6,200       7,500        8,000        60.00%
   all people - Age 75-79          4,300    4,500      5,800        5,400       5,800        7,000        62.79%
   all people - Age 80-84          3,400    3,800      4,000        5,300       5,000        5,400        58.82%
   all people - Age 85-89          2,300    2,600      3,000        3,300       4,400        4,200        82.60%
   all people - Age 90+       1,600     1,800      2,100       2,700      3,300      4,500     181.25%
         Source: ONS – 2014-based Subnational Population Projections for England (Published 2016)
1.8.5      A closer look at the same data clearly indicates that future housing provision will
           need to focus on the needs of the elderly and the very elderly:

1.8.6 The ageing population will have significant implications centred on housing, care and
       support requirements. The likely implications are quantified through Projecting Older
       People Population Information (POPPI).

1.8.7      Table 7 below reproduces selected POPPI data for Elmbridge up to 2030, using a
           combination of population projections and prevalence data, to project numbers falling
           into certain groups. This shows rises of between 37% and 44% in the number of
           older people likely to fall into the particular categories.

                                                 10
Published by the Housing Service                      Originally produced March 2015 – updated December 2019
Table 7 Projections for Elmbridge relating to older people aged 65 & over: 2015-30
Variable 2015 2020 2025 2030 Percentage
rise, 2015-30
Aged 65 & over and unable to manage at least
one domestic task on their own (e.g. household 10,227 11,216 12,616 14,425 41%
shopping, using a vacuum cleaner etc.)
Aged 65 & over and unable to manage at least
one mobility activity on their own (e.g. going out
of doors and walking down the road; getting up 4,692 5,191 5,858 6,752 44%
and down stairs; getting in and out of bed)
Aged 65 & over and predicted to have a fall 6,598 7,172 7,971 9,173 39%
Aged 65 & over and living alone 9,026 9,726 10,974 12,386 37%
Source: Projecting Older People Population Information (POPPI).
11
Published by the Housing Service Originally produced March 2015 – updated December 20192 The housing stock in Elmbridge
2.1 Dwelling numbers and type
2.1.1 Table 8 below provides a breakdown of the different dwelling types in Elmbridge, as
recorded at the 2011 Census and compares it with county and national figures. The
table and Figure 4 (below) both show that the proportion of detached homes within
Elmbridge is far higher at 34%, than in England (22%), whereas the proportion of
terraced and semi-detached dwellings is somewhat lower locally.
2.1.2 Table 8 also records an increase of 3,155 dwellings between the 2001 and 2011
census dates. Two-thirds of this increase is attributable to a rise in the number of
flats, maisonettes or apartments.
Table 8 Dwelling types – changes in Elmbridge
Dwelling type Number Number Numerical Percentage Percentage Percentage
2001 2011 change Elmbridge Surrey England
Whole house or bungalow:
18,389 18,817 428 33% 22%
Detached 34%
Whole house or bungalow:
13,841 14,245 404 29% 31%
Semi-detached 26%
Whole house or bungalow:
9,076 9,386 310 17% 16% 25%
Terraced (including end-
terrace)
Flat, maisonette or apartment
11,250 13,274 2,024 24% 21% 22%
Caravan or other mobile or
63 52 -9 1% 0%
temporary structure 0%
Total
52,619 55,774 3,155 100% 100% 100%
Source: 2001 & 2011 Census – KS401EW
Figure 4 Dwelling type by area, 2011 Census
Source: 2011 Census – KS401EW
2.1.3 Within Elmbridge, there is considerable variation between wards in the make-up of
dwelling types, as shown in Table 9 below. Oxshott & Stoke D’Abernon has the
12
Published by the Housing Service Originally produced March 2015 – updated December 2019highest proportion of detached dwellings (at 70.8%) and Molesey South (at 8.7%).
Weybridge South has the highest proportion of flats (at 45.5%) with Oxshott & Stoke
D’Abernon, the lowest (at 9.8%). The table also shows the percentage change in
the number of dwellings in each ward between 2001 and 2011, with the largest
percentage increases occurring in Walton Central, Hinchley Wood and Weybridge
South. Only two wards, Walton North and Weston Green recorded falls in the
number of dwellings.
Table 9 Dwellings numbers & types by ward (percentage), 2011 Census
Main dwelling types - 2011 Numbers of
unshared
dwellings
Area Detached Semi- Terraced Flat 2001 2011 %
% detached % % (no.) (no.) change
%
Claygate 43.8 32.3 11.1 12.8 2,642 2,840 7%
Cobham Fairmile 47.5 21.0 15.6 15.9 1,733 1,787 3%
Cobham and Downside 41.4 24.2 14.6 19.7 2,677 2,955 10%
Esher 49.8 14.8 12.6 22.8 2,593 2,899 12%
Hersham North 19.6 43.3 17.3 19.8 2,485 2,592 4%
Hersham South 36.3 34.3 12.6 16.5 2,710 2,808 4%
Hinchley Wood 57.1 18.0 5.8 18.9 1,681 1,964 17%
Long Ditton 27.9 27.8 26.5 17.5 2,517 2,583 3%
Molesey East 33.4 24.7 12.2 29.7 2,721 2,809 3%
Molesey North 18.0 34.9 32.3 14.7 2,585 2,577 0%
Molesey South 8.7 39.3 30.5 21.6 2,788 2,897 4%
Oatlands Park 33.6 10.8 24.3 31.4 2,733 2,840 4%
Oxshott &Stoke D'Abernon 70.8 15.1 4.3 9.8 2,398 2,630 10%
St George's Hill 45.1 13.8 12.7 28.4 2,585 2,795 8%
Thames Ditton 29.8 29.0 14.1 26.9 2,516 2,541 1%
Walton Ambleside 15.3 52.9 15.0 16.7 1,579 1,631 3%
Walton Central 26.8 17.0 13.4 42.6 2,681 3,255 21%
Walton North 11.5 29.5 31.3 27.6 2,981 2,915 -2%
Walton South 34.4 22.0 14.9 28.7 2,689 2,761 3%
Weston Green 58.4 29.0 2.2 10.2 1,427 1,395 -2%
Weybridge North 22.3 22.4 21.2 34.1 1,869 2,021 8%
Weybridge South 23.1 15.3 15.9 45.5 1,900 2,236 18%
Elmbridge 33.7 25.5 16.8 23.8 52,490 55,731 6%
Surrey 32.9 29.1 15.7 21.5
England 22.3 30.7 24.5 22.1
Source: Nomis 2011 Census – table KS401EW
2.1.4 Figure 5, Figure 6, Figure 7 & Figure 8 (following below) map the distribution of the
different types of dwelling per ward as recorded by the 2011 Census.
13
Published by the Housing Service Originally produced March 2015 – updated December 2019Figure 5 Terraced homes as a % of all dwellings per ward in Elmbridge, 2011
Source: Nomis 2011 Census – table KS401EW
Figure 6 Flats as a % of all dwellings per ward in Elmbridge, 2011
Source: Nomis 2011 Census – table KS401EW
14
Published by the Housing Service Originally produced March 2015 – updated December 2019Figure 7 Semi-detached homes as a % of all dwellings per ward in Elmbridge, 2011
Source: Nomis 2011 Census – table KS401EW
Figure 8 Detached homes as a % of all dwellings per ward in Elmbridge, 2011
Source: Nomis 2011 Census – table KS401EW
15
Published by the Housing Service Originally produced March 2015 – updated December 20192.1.5 Table 10 below provides a breakdown of the number of bedrooms per dwelling and
again compares Elmbridge with Surrey and England. It shows that Elmbridge has a
significantly higher proportion of homes with four or more bedrooms than England
(34% compared with 19%).
Table 10 Dwellings by area and number of bedrooms as per 2011 Census
Area No . of 1 bed 2 bed 3 bed 4 bed 5
bedrooms bedroom+
Elmbridge 0.1% 9.9% 24.0% 31.9% 20.5% 13.5%
Surrey 0.2% 10.9% 24.3% 36.4% 19.6% 8.6%
England 0.2% 11.8% 27.9% 41.2% 14.4% 4.6%
Source: Nomis – 2011 Census – Table QS411EW
2.1.6 Table 11 shows the variation between wards in the proportion of homes with a
particular number of bedrooms. For example, Weybridge North had the highest
proportion of one-bedroom properties (at 16%) whereas Oxshott & Stoke D’Abernon
had the highest proportion of homes with five or more bedrooms (at 34%). Figure 9
charts the proportion of homes with two or fewer bedrooms per ward, whilst Figure
10 maps the proportion of dwellings in each ward with four or more bedrooms.
Table 11 Proportion of dwellings by number of bedrooms by ward, 2011
Area 1 2 bed 3 bed 4 bed 5 bed or
bed % % % more %
%
Claygate 5% 19% 34% 26% 16%
Cobham Fairmile 6% 17% 31% 18% 27%
Cobham and Downside 9% 24% 28% 22% 17%
Esher 8% 23% 20% 21% 27%
Hersham North 12% 21% 45% 16% 6%
Hersham South 16% 19% 32% 16% 16%
Hinchley Wood 6% 13% 30% 40% 11%
Long Ditton 9% 23% 30% 26% 12%
Molesey East 10% 26% 27% 23% 13%
Molesey North 5% 23% 49% 20% 4%
Molesey South 16% 29% 44% 8% 2%
Oatlands Park 8% 28% 24% 26% 14%
Oxshott and Stoke D'Abernon 6% 9% 24% 26% 34%
St George's Hill 5% 27% 23% 22% 23%
Thames Ditton 7% 30% 26% 24% 13%
Walton Ambleside 6% 18% 56% 15% 4%
Walton Central 15% 34% 29% 14% 8%
Walton North 16% 33% 43% 7% 2%
Walton South 8% 26% 32% 23% 12%
Weston Green 2% 13% 24% 38% 22%
Weybridge North 18% 28% 32% 15% 7%
Weybridge South 17% 33% 19% 17% 13%
Source: Nomis – 2011 Census – Table QS411EW
16
Published by the Housing Service Originally produced March 2015 – updated December 2019Figure 9 Proportion of homes with two or fewer bedrooms by ward, as at 2011 Census
Source: Nomis – 2011 Census – Table QS411EW
Figure 10 Proportion of homes with four or more bedrooms by ward - 2011 Census
Source: Nomis – 2011 Census – Table QS411EW
17
Published by the Housing Service Originally produced March 2015 – updated December 20192.1.7 Table 12 provides a breakdown of the number of bedrooms by tenure. It shows a
stark difference between market and affordable rented tenures. Whereas, 76% of
owner-occupied homes have three or more bedrooms, 64% of social rented homes
have two or less bedrooms. The profile of private rented / rent-free homes is closer
to that of social rented than the owner-occupied sector , with a majority of homes
(60%) having two or less bedrooms. Figure 11 illustrates the differences between
the tenures.
Table 12 Number of bedrooms by tenure, dwellings in Elmbridge, 2011 Census
Bedrooms
Tenure All 1 2 3 4 or more
categories bed beds beds bedrooms
All categories: Tenure 52,922 10% 24% 32% 34%
Owned or shared ownership: Total 39,053 4% 20% 35% 41%
Owned: Owned outright 18,119 3% 20% 36% 41%
Owned: Owned with a mortgage or loan or 20,934 4% 20% 34% 42%
shared ownership
Rented or living rent free: Total 13,869 28% 36% 23% 13%
Rented: Social rented 5,218 40% 29% 28% 3%
Rented: Private rented or living rent free 8,651 20% 40% 21% 19%
Source: Nomis – 2011 Census – LC4405EW
Figure 11 Number of bedrooms by tenure, dwellings in Elmbridge - 2011 Census
Source: Nomis – 2011 Census - LC4405EW
2.2 Occupancy levels
2.2.1 Levels of overcrowding and under-occupation are measured using the bedroom
standard. This compares the number of bedrooms needed to avoid undesirable
sharing (given the number, ages and relationship of the household members) and the
number of bedrooms actually available to the household. Census data indicated that
2.6% (1,408) of households in Elmbridge were overcrowded, compared with 4.6%
nationally, when using the bedroom standard. Table 13 below also shows that
overcrowding is more prevalent in rented housing than amongst owner-occupiers
(8% of social tenants and 6% of private-renters compared to 1% of owner-occupiers).
18
Published by the Housing Service Originally produced March 2015 – updated December 20192.2.2 Conversely, 45% of Elmbridge households are considered to be under-occupying, in
that they had at least two more bedrooms than they needed under the bedroom
standard. The figure for England is 34%. Locally, levels of under-occupation are
highest amongst owner-occupiers (at 55%) and lowest amongst social housing
tenants (10%).
Table 13 Occupancy rating by tenure in Elmbridge - 2011 Census
Occupancy rating (bedrooms) All Owned or Social Private rented
categories shared rented or living rent
Tenure ownership free
All categories: Occupancy rating
(bedrooms)
52,922 100% 74% 10% 16%
Occupancy rating (bedrooms) of +2 or more 23,842 45% 55% 10% 22%
Occupancy rating (bedrooms) of +1 16,409 31% 32% 22% 34%
Occupancy rating (bedrooms) of 0 11,263 21% 12% 61% 39%
Occupancy rating (bedrooms) of -1 or less 1,408 3% 1% 8% 6%
Number of households with an occupancy 1,408
rating (bedrooms) of -1 or less
3% 499 413 496
Source: Nomis – 2011 Census - LC4108EW
2.3 Empty Homes
2.3.1 According to Council Tax records, as at September 2018, there were a total of 1,164
homes recorded as empty in Elmbridge (2.2% of the stock) and a further 352
recorded as second homes (0.6%). Of those recorded as empty, 493 (0.9%) were
recorded as long-term empty (in being vacant for at least six months) and 129 of
these were subject to the Empty Homes Premium (having been empty for at least
two years).
2.4 Housing Tenure
2.4.1 Table 16 below shows the tenure patterns in Elmbridge in 2011 and compares them
with the position ten years earlier.
Table 16 Changes in tenure in Elmbridge 2001 to 2011
2001 Change in stock
2011 Change in %
(no.) 2001-2011 (2001-2011)
No. % No. % No. % change
All Households 50,621 100% 52,922 100% 2,301
Owned 39,338 77.7% 38,660 73.1% -678 -4.6%
Owned: Owns outright 17,302 34.2% 18,119 34.2% 817 0.0%
Owned: Owns with a mortgage or loan 21,773 43.0% 20,541 38.8% -1,232 -4.2%
Owned: Shared ownership 263 0.5% 393 0.7% 130 0.2%
Social rented 5,224 10.3% 5,218 9.9% -6 -0.4%
Private rented 5,179 10.2% 8,006 15.1% 2,827 4.9%
Living rent free 880 1.7% 645 1.2% -235 -0.5%
Source: Nomis – Census 2001 & 2011 Table (KS402EW)
19
Published by the Housing Service Originally produced March 2015 – updated December 20192.4.2 The main points to note are that whilst owner-occupation remains the dominant
tenure, both the rates of owner-occupation in Elmbridge and the number of owner-
occupiers fell in the borough over the ten-year period. The biggest change relates to
the private-rented sector, growing over 50% (or 2,827 homes) and rising from 10% to
15%, reflecting a national pattern.
2.4.3 Table 17 below looks at the changes in tenure over a longer timeframe (between
1981 and 2011). This shows the absolute growth in the number of households overall
in the borough and the increases in both the number of homeowners and private
renters in this period. The tables also show that the social rented sector was smaller
in 2011 than it was in 1981. This is largely as a result of the number of Right-to-Buy
sales, through which homes were lost from the social rented sector, exceeding the
number of affordable homes for rent developed or built over the same period.
Table 17 Changes in housing tenure in Elmbridge 1981 – 2011
Total Home- Social rented Private rented Living rent Shared
Elmbridge
Households owners sector sector free / Other ownership
1981 Census 41,027 29,183 7,261 4,545 38 0
1991 Census 45,993 35,478 5,857 4,658 78 0
2001 Census 50,622 39,074 5,224 5,179 880 265
2011 Census 52,922 38,660 5,218 8,006 645 393
Source: Nomis – Census 1981 to 2011 Table UV63
2.4.4 Table 18 below compares the local tenure patterns with the regional and national
picture. Essentially levels of owner-occupation in Elmbridge (at 73%) are
considerably higher than the nationwide figure of 63%, but the proportion of social
housing here is considerably lower (9.9% compared to 17.7%).
Table 18 Overall percentage of tenure in Elmbridge, Surrey, SE and England
Tenure 2011 Owned Owned with All social All private Shared Living rent
outright a mortgage rented rented ownership free
England 30.6% 32.8% 17.7% 16.8% 0.8% 1.3%
South East 32.5% 35.1% 13.7% 16.3% 1.1% 1.3%
Surrey 34.8% 38.1% 11.4% 13.5% 1.0% 1.2%
Elmbridge 34.2% 38.8% 9.9% 15.1% 0.7% 1.2%
Source: Nomis – Census 2001 & 2011 Table UV63
Source: Nomis – Census 2001 & 2011 Table UV63
20
Published by the Housing Service Originally produced March 2015 – updated December 2019Tenure 2018 Council All social Other public All private
owned rented sector sector
England 1,592,000 2,539,000 43,000 19,998,000
Surrey 19,110 36,900 1,620 436,250
Elmbridge 10 5,500 20 51,880
2.4.5 Figure 12 reiterates the point that owner-occupation levels in Elmbridge and Surrey
are higher than the national average, with a correspondingly lower proportion of
social housing. Despite the growth in Elmbridge’s private-rented sector outlined
earlier, its size (as a proportion of the borough’s housing stock) is slightly smaller
than the national figures (15.1% compared to 16.8%).
Figure 12 Tenure in Elmbridge, Surrey, South East and England 2011
Source: Nomis 2011 Census (table UV63)
2.4.6 Table 19 (following below) reveals the differences in tenure pattern by the age band
of the household head. It shows that the majority of the small number of households
headed by a person aged under 25 are renting privately and that owner-occupation is
the predominant tenure for all age-bands from those aged 25 and above, but
especially for those aged 35 and above. Levels of outright home-ownership are
highest amongst those of retirement age. Whilst levels of renting-privately generally
fall with age, the pattern for social housing is slightly different, with the lowest
proportion of social-renters being found amongst those in the age-bands 35 to 49
and 50 to 64, with the figure then rising amongst the older age-bands.
21
Published by the Housing Service Originally produced March 2015 – updated December 2019Table 19 Tenure by age of household head in Elmbridge, 2011
Age group All tenure Total owned Owned Owned with Social Private
Percentage categories or shared outright a mortgage rented rented
households ownership or shared or living
in age-band ownership rent free
All categories: 100% 52,922 74% 34% 40% 10% 16%
Age 24 and under 1% 616 18% 6% 12% 26% 56%
Age 25 to 34 11% 5,716 49% 5% 44% 11% 40%
Age 35 to 49 34% 17,792 71% 11% 60% 8% 21%
Age 50 to 64 28% 14,743 82% 38% 44% 8% 10%
Age 65 to 74 12% 6,362 83% 70% 13% 11% 6%
Age 75 to 84 10% 5,131 81% 75% 6% 13% 5%
Age 85 and over 5% 2,562 75% 70% 5% 19% 6%
Source: Nomis – Census 2011 – Table DC4201EW
2.4.7 Figure 13 below shows the relative number of households headed by people aged
under 35 compared to those aged 35 and above, as at 2001 and 2011. It shows that
the vast majority of households in Elmbridge were headed by persons aged 35 or
more and that owner-occupiers were the largest group in each cohort and social-
renters the smallest.
Figure 13 Tenure mix of households in Elmbridge, 2001 and 2011 by age of household head
Source: Nomis – Census 2011 – Table DC4201EW
2.4.8 Figure 14 (following below) shows the change in tenure patterns by age in Elmbridge
between 2001 and 2011. The most significant changes occurred within households
headed by those under 35, with a drop in the proportion of owner-occupiers (from
62% to 46%) and a rise in those renting privately from 27% to 42%. This might be
explained by a number of factors, including possibly the difficulties younger
households face in terms of affording to buy on the open market in places such as
Elmbridge. These issues are covered in more detail further on.
22
Published by the Housing Service Originally produced March 2015 – updated December 2019Figure 14 Tenure mx of Elmbridge households by age of household head, 2001 & 2011
Source: Census 2011 &2001– Table DC4201EW
2.4.9 Within Elmbridge, there is considerable variation in tenure between different wards
as shown by Table 20 (below). Weston Green has the highest levels of owner-
occupation and lowest proportions of social rented homes (87.6% and 1.8%
respectively) whilst Walton North has the converse (61.1% and 23.3%). Weybridge
South has the highest proportion of private-rented homes, at 29.7%.
Table 20 – Tenure across Elmbridge 2001 Census (%)
% of tenure by ward - 2011 Owner Social Private Shared Living rent
Occupier rented rented ownership free
Claygate 80.1 9.4 9.2 0.4 0.9
Cobham Fairmile 65.2 14.6 17.4 0.2 2.7
Cobham and Downside 70.1 10.4 17.2 0.8 1.6
Esher 71.8 10.1 15.8 0.7 1.6
Hersham North 67.7 18.9 11.9 0.6 1
Hersham South 69.9 15.9 12 0.9 1.3
Long Ditton 76.8 11.2 10.8 0.4 0.8
Molesey East 77.7 2.5 18.5 0.2 1.1
Molesey North 78.8 8.3 11.5 0.8 0.7
Molesey South 68 18.8 11.2 0.9 1.2
Oatlands Park 76.8 4.6 17.2 0.1 1.3
Oxshott and Stoke D'Abernon 81.4 5.6 10.4 1.1 1.5
St George's Hill 72.2 2.9 22.6 0.2 2.1
Thames Ditton 79.6 5.3 13.6 0.4 1
Walton Ambleside 69.9 19.2 8.4 1.3 1.3
Walton Central 66.8 6.8 23.4 2.1 1
Walton North 61.1 23.3 13.3 1.6 0.7
Walton South 77.6 2.6 17.9 1 0.9
Weston Green 87.6 1.8 9.4 0.1 1.2
Weybridge North 63.3 16.2 17.9 1.2 1.3
Weybridge South 64.3 4.3 29.7 0.3 1.4
Elmbridge 73.0 9.8 15.1 0.7 1.2
Source (above): Census - 2001 Table UV63
23
Published by the Housing Service Originally produced March 2015 – updated December 20192.4.10 Figure 15, Figure 16 and Figure 17 (following) map the distribution of the three main
tenures (owner-occupation, private-renting and social renting) across the 406 output
areas within Elmbridge. Output areas are the smallest geographical areas which
Census data is reported on and whilst the number of residents and households within
each output area will vary, the recommended size is in the region of 125 households.
Figure 15 Owner-occupiers as a %age of all households in output areas – Census 2011
Source: Census - 2001 Table UV63
2.4.11 Figure 15 shows that owner-occupation remains the dominant tenure across
Elmbridge. The most notable exception within Hersham South ward, comprises the
properties within Whiteley Village, where the majority of residents classed
themselves as social housing tenants.
24
Published by the Housing Service Originally produced March 2015 – updated December 2019Figure 16 Private-renters as a %age of all households in output areas - Census 2011
Source: Census - 2001 Table UV63
2.4.12 Figure 16 shows the distribution of private-rented households across Elmbridge.
The larger concentrations appear to be in Walton Central, parts of Walton South,
Molesey East and Weybridge South ward and are likely to be in town centre
locations, or close to railway stations. Some of these concentrations are likely to
coincide with buy-to-let dwellings within recently built developments.
25
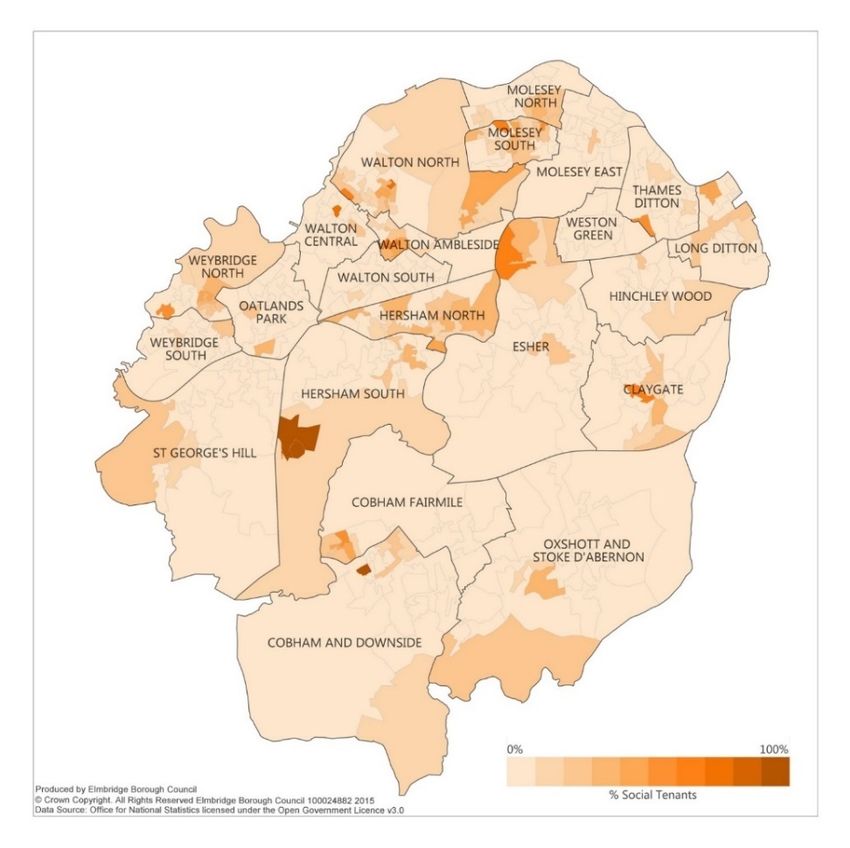
Published by the Housing Service Originally produced March 2015 – updated December 2019Figure 17 Social housing tenants as a percentage of all households in output areas - Census 2011
Source: Census - 2001 Table UV63
2.4.13 Figure 17 shows the distribution of affordable housing for rent within the Borough
over the 406 output areas. Aside from those clusters linked to Whiteley Village in
Hersham South. The lightly shaded areas indicate that the majority of the borough’s
output areas (particularly those in the southern half of Elmbridge) have relatively little
rented social housing within them.
26
Published by the Housing Service Originally produced March 2015 – updated December 20193 Energy efficiency, fuel poverty & carbon
reduction
3.1 Energy efficiency
3.1.2 The energy efficiency of dwellings is measured through the Government’s Standard
Assessment Procedure (SAP) for the Energy Rating of Dwellings. A SAP rating of
below 30 is considered very energy inefficient, while a score of 70 or more is
considered very energy efficient. In 2014, a stock-modelling exercise was
undertaken by the Building Research Establishment (BRE) across Surrey to help
target efforts to tackle fuel poverty and improve home energy efficiency.
3.1.3 Table 14 (below) sets out the simple average SAP (Standard Assessment
Procedure) rating for dwellings in Elmbridge, compared to Surrey as a whole and
compares it with national figures collected in 2012 and reported through the English
Housing Survey 2012-13.
Table 14 Average Simple SAP Ratings – Elmbridge, Surrey & England
Owner- Private- Social All stock
occupied rented housing
Elmbridge 57 58 61 58
Surrey 59 58 62 58
England 57 58 65* (h.a.) 59
Sources: BRE Survey & English Housing Survey 2012-13
3.1.4 The average SAP ratings within Elmbridge are very similar to the national and
county-wide levels.
3.2 Fuel poverty
3.2.1 The Government has changed how fuel poverty is defined and measured. Under the
new “Low Income, High Costs” definition introduced in 2013, a household is
considered to be fuel poor if their income is below the poverty line (taking into
account energy costs) and their energy costs are higher than is typical for their
household type.
3.2.2 In 2017 (the latest year for which figures are available), under the new measure, it
has been estimated that 4,635 (7.3%) households in Elmbridge were in fuel poverty
compared to 10.9% across England.
3.2.3 Table 15 (following below) provides an estimate of fuel poverty levels by tenure
within Elmbridge and compares it with Surrey-wide estimates. This is based on the
BRE stock modelling exercise referred to previously. It indicates that fuel poverty is
most prevalent within the private-rented sector in Elmbridge, with an estimated 1 in 8
households renting privately thought to be in fuel poverty.
27
Published by the Housing Service Originally produced March 2015 – updated December 2019Table 15 % dwellings in Surrey estimated to be in fuel poverty by local authority and by tenure
Private Sector (%)
Area Owner Occupied Private Rented Social housing stock All stock
Elmbridge 4.7 12.2 7.7 7.8
Surrey 5.6 14.3 6.6 8.1
Source: (BRE Housing Stock Appraisal 2016)
3.3 Carbon reduction
3.3.1 Since 2007, central government has published estimates of the carbon dioxide
emissions attributed to local authority areas. The statistics show CO2 emissions
allocated on an “end-user basis” where emissions are distributed according to the
point of energy consumption. The figures break down emissions into “industry and
commercial”, “transport” and “domestic” categories. Table 16 (following below)
charts the pattern and scale of emissions assigned to Elmbridge between 2005 and
2017 (which is the latest available data).
3.3.2 The figures show that the domestic sector has been the single largest source of
emissions within Elmbridge for every year since 2005. The figures also show the
general downward trend in CO2 emissions in Elmbridge over the years, in line with
the national picture and a consequent reduction in per capita emissions overall. The
table shows a general downward trend in CO2 emissions attributable to direct
household consumption. Domestic CO2 emissions are influenced by a range of
factors such as the fuel types used, the type and condition of the housing (including
its insulation), the average temperature, average household size, type of household
and the income and preference of the occupiers. Emissions can vary from year to
year due to weather patterns, with severe winters leading to greater energy use (and
therefore more CO2 released) and milder winters leading to a reduction.
Table 16 Estimate of CO2 emissions attributed to Elmbridge, 2005-17
Year Industry & Domestic Transport Grand Population Per capita Per capita
commercial - kT CO2 – kT CO2 total emissions (all emission
– kT CO2 sectors) – (domestic) -
tonnes of CO2 tonnes of CO2
2005 247 373 270 890 127.3 6.99 2.93
2006 251 374 267 893 128.8 6.94 2.90
2007 243 367 263 873 129.8 6.73 2.83
2008 249 373 252 875 129.9 6.73 2.87
2009 216 342 247 806 130 6.20 2.63
2010 225 369 240 835 130.9 6.38 2.82
2011 203 327 239 770 131.4 5.86 2.49
2012 220 356 229 806 132.2 6.1 2.69
2013 208 351 228 788 133.5 5.9 2.63
2014 176 295 232 704 134.8 5.22 2.19
2015 164 288 235 688 135.4 5.09 2.13
2016 143 275 238 658 136.1 4.84 2.02
2017 133 257 236 627 136.4 4.60 1.88
Source: UK local authority and regional carbon dioxide emissions national statistics: 2005 to 2017
28
Published by the Housing Service Originally produced March 2015 – updated December 20193.3.3 Despite the reduction in the average size of Elmbridge residents’ average carbon
footprint, for domestic emissions, Elmbridge residents have consistently one of the
largest such footprints within England. For 2017, Elmbridge residents’ domestic
carbon footprint was the ninth highest of any over 300 local authority areas. This is
thought to be due to several reasons. Firstly, homes in Elmbridge are on average,
20% larger than the typical English home and need more energy to heat. Secondly,
Elmbridge has a greater proportion of detached properties than many other places
and these are inherently less energy efficient. Thirdly, the relative affluence of
residents may help explain the pattern, in terms of preferences and price-sensitivity.
3.3.4 There is no authoritative data-source which collects all information on measures
installed which improve the energy efficiency of the housing stock. The official figures
record measures reported through Government-sponsored programmes such as the
Energy Company Obligation (ECO), which started on 1 January 2013 and which in its
current format, runs to 2022. It focuses on providing energy efficiency measures to
low income and vulnerable consumers and those living in “hard to treat properties”
and includes loft and cavity wall insulation and replacement boilers.
3.3.5 The statistics will not capture installations undertaken by households directly (for
example, installing loft insulation).
3.3.6 Figures published by the Department of Business, Energy and Industrial Sectors
(BEIS) up to the end of June 2019 showed that 2,242 ECO funded measures had
been installed within homes in Elmbridge (equivalent to 41 measures per 1,000
households). This is less than half the take-up rate across England, which stands of
91 per 1,000. These 2,242 measures were installed in 1,955 homes (some
properties had more than one measure installed) equivalent to a take up rate of 3.6%
households, just over half the national rate of 7.1%.
3.3.7 At March 2019 there were 43,174 Domestic Energy Performance Certificates (EPC’s)
in Elmbridge. The rating scale spans from A to G, A being the most efficient, and G
the worst - the higher the efficiency, the lower the running costs:
Band No of EPCs
A 28
B 4411
C 11877
D 15328
E 8070
F 2114
G 407
Total 42235
Source: https://epc.opendatacommunities.org/
29
Published by the Housing Service Originally produced March 2015 – updated December 20194 The Housing Market in Elmbridge
4.1 Housing Costs
4.1.1 Property prices remain amongst the highest in the country, with the average price of
a home sold in 2019 (Q3) (as per Land Registry records on last quarter 2017) being
£799,744. As Table 21 shows, these figures have risen consistently.
Table 21 Changes in average residential sales’ prices in Elmbridge – 2012-19
Year 2012 2013 2014 2015 2016 2017 2018 2019
Average £609,756 £649,482 £667,224 £699,549 £702,242 £722,500 £767,219 £792,031
Source: Land Registry data (as reported by LGI) & Land Registry Open Data
Table 21a Median house price in Elmbridge against Surrey house prices 2012-17
Median House Price 2012-2017
Area
2012 2013 2014 2015 2016 2017
Elmbridge £405,000 £430,000 £450,000 £495,000 £528,500 £565,000
Surrey £300,650 £315,250 £338,250 £375,900 £412,600 £437,160
Source: Local Government Inform (LGI) reports 2018
UK average house prices (ONS) 2018 - 2019
Property type Jun-18 Jun-19 Difference
Detached £343,969 £349,879 1.70%
Semi-detached £215,660 £219,752 1.90%
Terraced £184,595 £187,082 1.30%
Flat or maisonette £204,732 £200,699 -2.00%
All £228,190 £230,292 0.90%
Table 21b – Median house price (newly built & existing dwellings) for Elmbridge & Outer London
Elmbridge Mean for Outer London
Median house price, quarterly rolling
Period (12 months Median house price, quarterly rolling year
year
ending)
Newly built Existing Newly built Existing
2016 Q2 £490,000 £517,355 £373,958 £396,795
2016 Q3 £482,450 £526,700 £388,512 £407,176
2016 Q4 £489,450 £537,475 £391,626 £413,289
2017 Q1 £485,000 £550,000 £403,858 £419,703
2017 Q2 £473,475 £565,000 £416,733 £425,548
2017 Q3 £515,000 £570,500 £418,965 £431,861
2017 Q4 £508,500 £570,000 £429,420 £436,296
2018 Q1 £645,000 £575,000 £439,559 £438,560
2018 Q2 £850,000 £570,000 tbc tbc
2018 Q3 £607,500 £570,000 tbc tbc
2018 Q4 £405,000 £570,000 tbc tbc
2019 Q1 £400,000 £578,250 tbc tbc
2019 Q2 £382,500 £585,000 tbc tbc
Source: Office for National Statistics, House Price Statistics for Small Areas
4.1.2 Average house prices in Elmbridge are the ninth highest in England, and the highest
outside London (Source: Local Government Inform (LGI) reports 2018).
30
Published by the Housing Service Originally produced March 2015 – updated December 20194.1.3 Table 22 below provides a more detailed breakdown of the sale prices achieved
between mid-as at December 2017 by different property type. It shows considerable
variations in values between property types, with detached dwellings achieving the
highest prices and flats the lowest.
Table 22 Sale prices achieved in Q4 2017 by property type in Elmbridge
Lower Number August 2019
Dwelling Type Mean Median Quartile sold average price
All £779,826 £570,000 £290,000 2,040 £568,643
Detached £1,396,090 £1,150,000 £875,000 589 £1,178,454
Semi-detached £672,038 £596,000 £480,000 504 £568,381
Terrace £536,076 £470,925 £395,000 417 £446,577
Flat £381,070 £329,800 £258,000 526 £314,806
Source: Local Governent Inform (LGI) reports 2018
4.2 Affordability of home-ownership
4.2.1 The affordability of housing is governed by a number of factors, including incomes,
prices, interest rates and so on. One measurement of affordability compares
property prices with incomes. The Annual Survey of Hours and Earnings (ASHE)
reports workplace earnings based on a sample of earners every year and compared
with property prices by Central Government to compare trends in affordability over
time and between different areas.
4.2.2 Table 23 and Table 24 (following) compare the gross full-time earnings in 2017 on
both a residence-based measure (i.e. for those living in Elmbridge, Surrey and
England) and a workplace-based measure (i.e. for those working in those localities).
The figures show that incomes, on the various measures, are higher for those living
in Elmbridge than those working here, but that on both sets of indicators, Elmbridge
has higher incomes recorded than the Surrey and national measures.
Table 23 Weekly gross full-time earnings workplace-based, 2016 & 17
31
Published by the Housing Service Originally produced March 2015 – updated December 2019Period by Elmbridge Minimum for Mean for all Maximum for
workplace mean house all English English all English
price authorities authorities authorities
2012 £593.7 £347.7 £490.6 £919.7
2013 £574.9 £369.4 £499.0 £945.2
2014 £606.4 £381.0 £501.7 £928.0
2015 £624.8 £389.9 £509.2 £926.2
2016 £631.7 £390.6 £520.6 £958.2
2017 £670.8 £398.9 £533.0 £989.2
Table 24 Weekly gross full-time earnings residence based, 2016 &17
Period Minimum for all Mean for all Maximum for all
Elmbridge
by residence English authorities English authorities English authorities
2012 £717.9 £338.6 £515.4 £805.6
2013 £694.7 £374.0 £522.9 £823.0
2014 £728.3 £386.9 £525.9 £791.3
2015 £743.6 £388.2 £534.3 £771.4
2016 £715.7 £413.1 £547.8 £1,034.4
2017 £733.9 £407.2 £558.6 £862.4
Earnings by place of residence (2018)
Elmbridge South East Great Britain
Gross weekly pay
Full-time workers £792.10 £614.50 £571.10
Male full-time workers £858.80 £670.80 £612.20
Female full-time workers £687.40 £541.90 £510.00
Hourly pay - excluding overtime
Full-time workers £20.83 £15.65 £14.36
Male full-time workers £22.78 £16.61 £14.89
Female full-time workers £18.55 £14.43 £13.56
Source: ONS
4.2.3 Figure 18 (below) tracks the ratio of the lower quartile property price against lower
quartile full-time, residence-based earnings. This measure is often used to help
ascertain the ability of first-time buyers to access local housing markets as lower-
quartile prices can be considered as an indicator of entry-level prices. Figure 18
shows that the ratio between lower quartile prices and incomes has been consistently
higher in Elmbridge than the nationwide equivalent. It also shows the trend of the
ratio increasing over time (i.e. prices becoming less affordable relative to incomes.
For example, in 2003, the ratio of lower quartile property prices to earnings in
Elmbridge was 9.65:1, but by 2017, the ratio had grown to 15.08:1 (the fourth highest
ratio of any local authority area outside of London).
4.2.4 As such, even though the incomes used for this measure are higher for Elmbridge
than elsewhere, this is more than offset by the premium on property prices locally,
resulting in a higher property price: income ratio in Elmbridge compared to most
other parts of the country.
32
Published by the Housing Service Originally produced March 2015 – updated December 2019Figure 18 - Ratio of lower quartile house price to lower quartile gross annual (residence-
based) earnings (ratio) (from 2003 to 2017) for Elmbridge & All English authorities
Source: LGI research report
4.2.5 Figure 19 (following below) charts the pattern of median property sales prices to
median workplace full-time earnings. It reveals the same patterns as the lower
quartile statistics, in so much as Elmbridge having higher price to income ratios than
elsewhere and the gap between incomes and property prices growing over time.
Figure 19 - Ratio of median house price to median gross annual (residence-based)
earnings (ratio) (from 2003 to 2017) for Elmbridge & All English authorities
Source: LGI research report
4.2.6 In 2017, the ratio of median house prices to incomes in Elmbridge was 14.5, the
second highest ratio of all 67 local authorities in the South East and significantly
above the national figure.
4.2.7 Figure 18 shows that the ratio between lower quartile prices and incomes has been
consistently higher in Elmbridge than the nationwide equivalent. It also shows the
trend of the ratio increasing over time (i.e. prices becoming less affordable relative to
incomes. For example, in 2003, the ratio of lower quartile property prices to earnings
in Elmbridge was 9.65:1, but by 2017, the ratio had grown to 15.08:1 (the fourth
highest ratio of any local authority area outside of London). Compared to the figure of
33
Published by the Housing Service Originally produced March 2015 – updated December 20197.63, respectively. Furthermore, the affordability gap is widening, with the ratio
having increased from 12.34 to 15.48 between 2012 and 2017.
4.2.8 Analysis carried out on behalf of Shelter and published in January 2015 in its report
“A Home of Their Own” has provided estimates as to the length of time different type
of first-time buying households across the country would take to save a 20% deposit.
Within Surrey, a couple without children, who began to save in September 2014,
would take an estimated 9.8 years to save a 20% deposit to buy within the county,
whereas a couple with one child were estimated to require 17.3 years and a single
person 18.8 years. These figures were all higher than the national and regional
estimates and give some indication as to the difficulties facing prospective first-time
buyers to meet living costs (such as rent and household costs) and save to buy a
home at the same time.
4.3 Rent level comparisons
4.3.1 Since 2011, the Valuation Agency Office (VOA) has collected and published statistics
on private-rented sector rent levels across the country. The data consistently shows
that average private-sector rents in Elmbridge are amongst the highest in the country
and the overall monthly average rent of £1,845 set out below is the highest of any
local authority area outside of London. Table 25 below provides a comparison of
monthly average rents in Elmbridge with other localities for the year from 1 April
2017.
Table 25 Comparison of average monthly private-sector rents 2017-18
Elmbridge Elmbridge
Size Elmbridge Surrey South East England 2015-16 change change
1 Bedroom £995 £950 £825 £840 £896 9.9% £99
2 Bedrooms £1,350 £1,275 £1,045 £895 £1,236 8.4% £114
3 Bedrooms £1,700 £1,600 £1,300 £995 £1,555 8.5% £145
4 Bedrooms+ £5,000 £2,885 £2,200 £1,850 £3,970 20.6% £1,030
Overall £1,700 £1,450 £1,150 £950 £1,845 -8.5% -£145
Source: Valuation Office Agency 2017-18
Elmbridge Elmbridge
2018-19 Surrey South East England 2017-18 % change
change
1 Bedroom £947 £894 £718 £731 £995 -4.82% -£48
2 Bedrooms £1,257 £1,151 £916 £800 £1,350 -6.89% -£93
3 Bedrooms £1,716 £1,488 £1,131 £916 £1,700 0.94% £16
4 Bedrooms+ £3,971 £2,517 £1,873 £1,320 £5,000 -20.58% -£1,029
Overall £1,973 £1,513 £1,160 £942 £1,700 16.06% £273
Source: Valuation Office Agency 2018-19
4.3.2 A year-on-year analysis of average private-sector rents in Elmbridge in the two years
from 2015/16 to 2017/18, using VOA data, reveals that average rents rose on 1-bed
units by 0.9% (£99) and for 3-bed unit 8.5% (£145).
4.3.3 Table 26 below compares the average monthly rent for private-rented homes in
Elmbridge for 2016/17 against the average rent levels charged by larger housing
associations in Elmbridge for properties let at social rent and affordable rent for their
general-needs properties (i.e. excluding retirement or supported housing).
34
Published by the Housing Service Originally produced March 2015 – updated December 2019You can also read