WHITE PAPER FH Healthcare Indicators and FH Medical Price Index 2021 - An Annual View of Place of Service Trends and Medical Pricing - WHITE ...
←
→
Page content transcription
If your browser does not render page correctly, please read the page content below
WHITE PAPER

      FH® Healthcare Indicators and
      FH® Medical Price Index 2021
An Annual View of Place of Service Trends and Medical Pricing

                                                 A FAIR Health White Paper, March 31, 2021

             Copyright 2021, FAIR Health, Inc. All rights reserved.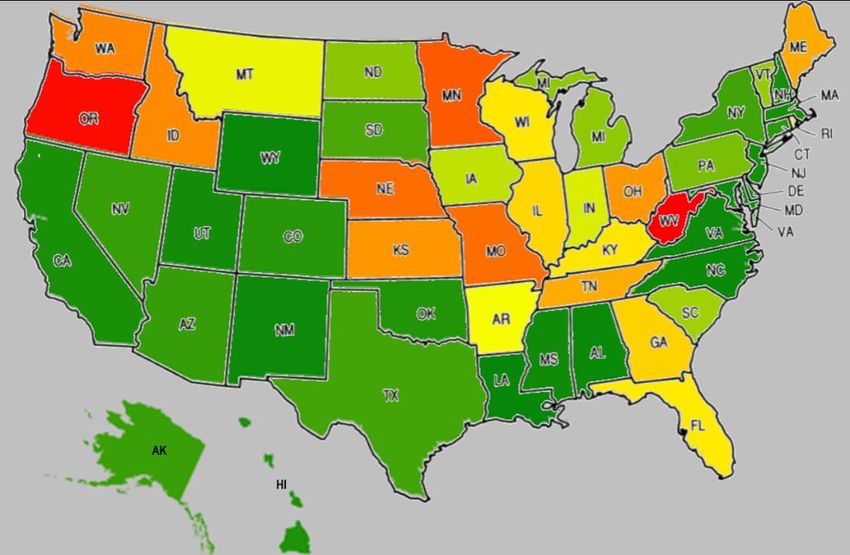
Summary
This is the fourth annual edition of FH® Healthcare Indicators and FH® Medical Price Index, two measures
developed by FAIR Health to provide clarity in a rapidly changing healthcare environment. Drawing on the
independent nonprofit’s national database of billions of privately insured healthcare claims—the largest in
the country—these two measures apply different approaches to illuminate different aspects of the national
healthcare sector, including, among other factors, trends in the place of service and billed and allowed
amounts for professional services.

FH Healthcare Indicators analyze trends involving the place of service, or setting (e.g., office, inpatient
hospital, retail clinic, urgent care center, telehealth, ambulatory surgery center [ASC] and emergency
room [ER]), for healthcare in recent years. Focusing on alternative places of service—retail clinics, urgent
care centers, telehealth and ASCs—as well as ERs, FH Healthcare Indicators evaluate changes in
utilization, geographic and demographic factors, diagnoses, procedures and costs. In the new edition, all
time frames shift forward one year from the previous edition. For example, if a chart last year showed
usage trends from 2013 to 2018, this year’s chart shows 2014 to 2019. It does not show changes that
occurred in 2020 as a result of the COVID-19 pandemic; those will be apparent in next year’s
edition. Here are some of the key findings from the period ending in 2019:

    •    In all places of service studied for change in utilization, utilization increased from 2018 to 2019.
         The greatest rate of growth was for telehealth (73 percent), followed by urgent care centers (47
         percent), retail clinics (39 percent), ERs (33 percent) and ASCs (30 percent).
    •    Among the places of service studied, ERs continued to hold the highest percentage of medical
         claim lines in 2019, with 2.94 percent of all medical claim lines nationally. The comparable
         percentages for the other places of service were 1.56 percent for urgent care centers, 1.04
         percent for ASCs, 0.22 percent for telehealth and 0.05 percent for retail clinics.
    •    In telehealth in 2019, males accounted for more claim lines than females in one adult age group:
         71-80 years. The distribution in that age group was 55 percent male, 45 percent female. It was
         the first time in four years of tracking (2016-2019) that an adult age group had more claim lines
         submitted for men than women in any of the places of service in which FAIR Health studied
         gender-related patterns—retail clinics, urgent care centers, telehealth, ASCs and ERs.
    •    In retail clinics, urgent care centers and telehealth, the 31-40 age group had the greatest share of
         claim lines in 2019. But in ERs, it was the 51-60 age group.
    •    In 2019, West Virginia had the highest percentage of any state of retail clinic claim lines as a
         percentage of all medical claim lines. This was a change from previous years studied by FAIR
         Health, when Minnesota held that position.
    •    The most common diagnostic category in 2019 in retail clinics and urgent care centers was acute
         respiratory diseases and infections. But in telehealth it was mental health conditions, and among
         individuals over 22 years of age in the ER, it was digestive system issues.
    •    In 2019, the median charge amount for a 30-minute new patient office visit (CPT®1 99203) ranged
         from $150 in a retail clinic to $217 in an office to $239 in an urgent care center.

FH Medical Price Index tracks the weighted average growth in median procedure charges and median
imputed allowed amounts2 in six procedure categories. This report does not consider facility fees. The
categories are:

1 CPT © 2020 American Medical Association (AMA). All rights reserved.
2 Because payors’ contracted network rates are proprietary and cannot be shared, FAIR Health employs an
imputation methodology to determine benchmarks for allowed amounts. First, FAIR Health calculates the ratios of
actual allowed amounts to charges for groups of procedure codes on a regional basis. The resulting ratios are applied
to the actual charges for each specific procedure at the local (geozip) level to develop an “imputed” allowed amount
for each claim line.

                                FH Healthcare Indicators and FH Medical Price Index 2021                           2
•   Professional evaluation and management (E&M; excluding E&Ms performed in a hospital setting);
    •   Hospital E&M (excluding E&Ms performed in a professional setting, such as typical office visits);
    •   Medicine (excluding E&Ms);
    •   Surgery (procedures for which the physician would bill);
    •   Pathology and laboratory (including both technical and professional components, i.e., both
        equipment and professional services); and
    •   Radiology (including both technical and professional components).

May 2012 is the base month, to which values in later periods are compared; therefore, FH Medical Price
Index establishes a consistent point of reference that makes it easy to identify and compare shifts.

In the first edition, FH Medical Price Index presented an overview from May 2012 to May 2017, which was
extended in the second edition to November 2018, and in the third to November 2019. In the new edition,
the indices are extended to November 2020. Findings include the following, all for the period November
2019 to November 2020:

    •   Of the six procedure categories, hospital E&Ms had the greatest percent increase in charge
        amount index, 6 percent, and in allowed amount index, 10 percent.
    •   The radiology charge amount index decreased one percent, the only decrease in either charge
        amount or allowed amount indices.
    •   Radiology had the lowest percent increase in allowed amount index, three percent.
    •   The professional E&M charge amount index grew three percent and allowed amount index five
        percent.
    •   The medicine charge amount index grew one percent and allowed amount index nine percent.
    •   The surgery charge amount index increased three percent and allowed amount index seven
        percent.
    •   The pathology and laboratory charge amount index increased five percent and allowed amount
        index four percent.

Background
In a white paper in March 2018, FAIR Health launched two new measures of healthcare information: FH®
Healthcare Indicators and FH® Medical Price Index.3 Designed to provide clarity in a rapidly changing
healthcare environment, these two measures for deriving insights from data elicited a welcome public
response; stakeholders expressed appreciation for being offered this “macro” view into the nation’s
healthcare system. From the start, the measures were intended to be released annually to reflect ongoing
changes. In the last two years, FAIR Health released the second4 and third5 annual editions, and this is
the fourth.

3 FAIR Health, FH® Healthcare Indicators and FH® Medical Price Index: A New View of Place of Service Trends and
Medical Pricing, A FAIR Health White Paper, March 2018,
https://s3.amazonaws.com/media2.fairhealth.org/whitepaper/asset/FH%20Medical%20Price%20Index%20and%20F
H%20Healthcare%20Indicators--whitepaper.pdf.
4 FAIR Health, FH® Healthcare Indicators and FH® Medical Price Index 2019: An Annual View of Place of Service

Trends and Medical Pricing, A FAIR Health White Paper, April 2019,
https://s3.amazonaws.com/media2.fairhealth.org/whitepaper/asset/FH%20Healthcare%20Indicators%20and%20FH
%20Medical%20Price%20Index%202019%20-%20A%20FAIR%20Health%20White%20Paper.pdf.
5 FAIR Health, FH® Healthcare Indicators and FH® Medical Price Index 2020: An Annual View of Place of Service

Trends and Medical Pricing, A FAIR Health White Paper, March 2020,
https://s3.amazonaws.com/media2.fairhealth.org/whitepaper/asset/FH%20Healthcare%20Indicators%20and%20FH
%20Medical%20Price%20Index%202020--A%20FAIR%20Health%20White%20Paper.pdf.

                               FH Healthcare Indicators and FH Medical Price Index 2021                           3
Since the first edition, the healthcare sector has continued to evolve and grow more complex. Healthcare
stakeholders continue to need information that will enable them to discern fundamental trends and
patterns, and to make decisions on that basis. FH Healthcare Indicators and FH Medical Price Index are
intended to serve all such constituents, including insurers and companies that self-insure, third-party
administrators, hospitals and health systems, physicians and other individual providers, pharmaceutical
and device manufacturers, federal and state government officials, legislators, policy makers, economists
and academic researchers.

Both FH Healthcare Indicators and FH Medical Price Index use the same data source: FAIR Health’s
database of over 32 billion claim records, which is growing at a rate of over 2 billion claim records a year.
The data are contributed by payors and administrators who insure or process claims for private insurance
plans. A national, independent nonprofit organization, FAIR Health uses this repository—the nation’s
largest collection of private healthcare claims data—in furtherance of its mission of bringing transparency
and integrity to healthcare costs and health insurance information.

Like previous releases, this year’s edition of FH Healthcare Indicators and FH Medical Price Index is
intended to assist healthcare stakeholders in a variety of ways. For example, health systems can use the
information in budgeting and considering affiliations or market expansion; insurers in designing plan
benefits and provider networks, informing reimbursement policies and setting premiums; government
agencies and policy makers in framing public health campaigns and responses, and setting courses to
benefit the public good; investors in researching the healthcare sector; and economists and researchers
in seeking to track and evaluate important trends.

In this edition, as in previous editions, FH Healthcare Indicators and FH Medical Price Index each
advance one year in the data they report: FH Healthcare Indicators to 2019 and FH Medical Price Index
to 2020. For this reason, FH Healthcare Indicators do not include data from the COVID-19 pandemic year
(next year’s edition will extend to 2020), whereas FH Medical Price Index does. Indeed, this year’s FH
Healthcare Indicators present a valuable picture of the nation’s healthcare environment just before
COVID-19 arrived in the United States, while FH Medical Price Index offers an account of healthcare
pricing trends in the midst of the pandemic.

Methodology
For this study, FAIR Health used its repository of private claims data, which includes data on
commercially insured and Medicare Advantage (Medicare Part C) enrollees, but not that of uninsured
individuals or those on Medicaid or on Medicare Parts A, B and D.6

FH Healthcare Indicators Methodology
To segregate FAIR Health claims data into venues of care, FAIR Health used standard Centers for
Medicare & Medicaid Services (CMS) place of service codes to identify retail clinics (CMS place of
service 17), urgent care centers (CMS place of service 20) and office (CMS place of service 11). Other
methodologies were used to identify ERs (e.g., CMS place of service 23, bill type of 131 and/or an
emergency department visit CPT code [CPTs 99281 through 99285]); telehealth (telehealth CPT codes
such as CPT 99441 or telehealth modifiers such as GQ); and ASCs (bill type of 83* or CMS place of
service 24).

6 It should be noted that FAIR Health also receives data for traditional Medicare Parts A, B and D under the Centers
for Medicare & Medicaid Services Qualified Entity Program, but those data are not a source for this report.

                                FH Healthcare Indicators and FH Medical Price Index 2021                               4
The data were then aggregated by a variety of key fields, including state, urban/rural, diagnostic
categories (e.g., urinary tract infection, ear infection, acute respiratory infection), year of service and
patient demographics (age and gender), to identify trends and patterns in utilization and variation in cost.
Diagnostic categories were consolidated from the International Classification of Diseases–Clinical
Modification (ICD-CM) into clinically relevant groups to make them consumer-friendly. The data were
evaluated with single and multiple variables to look for distinct trends and associations, which were then
used to create graphical representations of the information.
In the graphical representations, the term “claim lines” refers to the individual procedures listed on
insurance claims. A single claim for one patient may have multiple claim lines, with each line reflecting a
separate procedure. To normalize the data and avoid fluctuations due to natural changes within plan data
(e.g., the closing of a major employer and the loss of those members, or the addition of a major employer
to a plan from which FAIR Health receives data, which would create a net influx of data from those
members), FAIR Health calculates each data point as a percentage of the total number of medical claim
lines for each year. When evaluating rural or urban data for a place of service, the denominator is all
medical claim lines within that year and region. When evaluating total national data for a place of service,
the entirety of medical claim lines for that year is the denominator. Once this claim line percentage is
established, FAIR Health creates two separate types of trend charts.
“Percent of claim lines” is the percentage of all normalized claim line percentages as described above
associated with a given grouping (e.g., a place of service) in a given time period in a particular chart. For
example, in figure 1, which shows normalized claim line shares with retail clinic usage by rural, urban and
national settings from 2014 to 2019, each year’s data point for national usage is the percentage share of
all the normalized claim lines in the national usage grouping from 2014 to 2019. If one were to add up all
the data points for national usage from all the years in this period, they would total 100 percent.
Other graphs present “percent of all medical claim lines.” In this case, the number of claim lines for the
place of service being evaluated in a particular location (state, rural, urban or national) in a particular year
is presented as a percentage of all claim lines within the FAIR Health database that are designated as
medical claim lines (not including dental or pharmacy claim lines) in that location in that year. For
example, in figure 2, rural retail clinic claim lines in 2014 are shown as a percentage of all rural medical
claim lines in that year.
FH Medical Price Index Methodology
FAIR Health used two of its benchmark products, FH® Medical and FH® Allowed Medical, to calculate,
respectively, charge amounts and allowed amounts for FH Medical Price Index. For each procedure
code, the benchmark products (modules containing cost data based on recent claims) include a median
value, which is the dollar value used for all codes included in the indices. For the 2020 indices, 18
releases of the benchmark products were used to establish the price component of the indices: May and
November of each year from 2012 to 2020. The total frequency across the entire time period for each
procedure code within the selected categories (professional E&M, hospital E&M, medicine, surgery,
pathology and laboratory, and radiology) was used to select codes for inclusion or exclusion. Each
procedure code that had a total combined frequency of one million or more occurrences in the last 11
module releases was included in the indices. This allowed for natural inclusion of new codes and eventual
exclusion of deleted codes in a gradual and controlled manner so as not to create erroneous fluctuations.
Once the list of codes to be included in the 2020 indices was established, the median charge or allowed
amount for each code in each release was used as the price and multiplied by the corresponding
frequency for that code for the 18 releases, producing the release code median total. Then, all release
code median totals in a category were summed to get a total dollar value for each release in that category
(the release median total). That release median total was divided by the total frequency to generate a
FH Healthcare Indicators and FH Medical Price Index 2021 5release average median. Each index was then created by using the following index formula: dividing each
release average median for each month and year by the first release average median established (May
2012, the base):
Release Weighted Average of MedianMONTH YEAR
------------------------------------------------------------------- = Index ValueMONTH YEAR
Release Weighted Average of MedianBASE
The table below provides a sample calculation of how an FH Medical Price Index value is derived.
Table. Calculation of FH Medical Price Index for professional E&M charge amounts over a sample
of the period May 2012-November 2020
Release
Median FH
Total/Total Medical
Index
Release Release Median Total Total Frequency Frequency = Price
Formula
Release Index
Average Value
Median
May $139.07 $139.07
2012
$280,020,108,863 2,013,522,941 ( ) 1.00
(base) $139.07
Nov $192.61
2020
$503,714,036,046 2,615,247,477 $192.61 ( ) 1.38
$139.07
FH Healthcare Indicators and FH Medical Price Index 2021 6FH Healthcare Indicators
As in last year’s report, FAIR Health studied four alternative places of service—retail clinics, urgent care
centers, telehealth and ASCs—and compared them to more traditional venues of care, offices and ERs.
Retail Clinic
The normalized share of claim lines for retail clinics grew nationally 306 percent from 2014 to 2019 (figure
1), a slightly faster pace of growth than that documented in last year’s report (293 percent from 2013 to
2018).
Growth from 2014 to 2019 was higher in urban (329 percent) than rural areas (102 percent). From 2018
to 2019, total growth in the percentage share of retail clinic utilization was 39 percent and urban growth
43 percent; in rural areas, retail clinic usage declined 7 percent.
30%
25%
Percent of claim lines
20%
15%
10%
5%
0%
2014 2015 2016 2017 2018 2019
Year
Rural Urban Retail Clinic Total
Figure 1. Percent of claim lines with retail clinic usage by rural, urban and national settings, 2014-
2019
FH Healthcare Indicators and FH Medical Price Index 2021 7In figure 1 above, rural and urban retail clinic usage in 2014 is shown as a percentage of all rural and
urban retail clinic usage, respectively, measured by claim lines, from 2014 to 2019. But in figure 2 below,
rural and urban retail clinic usage in 2014 is shown as a percentage of all rural and urban medical claim
lines, respectively, in that year.
In rural, urban and national settings from 2014 to 2019, the percentage of all medical claim lines
attributed to retail clinics was less than 0.1 percent, just as it had been from 2013 to 2018. Use is
increasing, however. In rural areas, retail clinics’ percentage of all medical claim lines approximately
doubled, rising from 0.02 percent in 2014 to 0.04 percent in 2019. In urban areas and the nation as a
whole, the percentage rose from 0.01 percent to 0.05 percent.
0.06%
Percent of all medical claim lines for
0.05%
0.04%
that setting
0.03%
0.02%
0.01%
0.00%
2014 2015 2016 2017 2018 2019
Year
Rural Urban Retail Clinic Total
Figure 2. Claim lines with retail clinic usage as a percentage of all medical claim lines by rural,
urban and national settings, 2014-2019
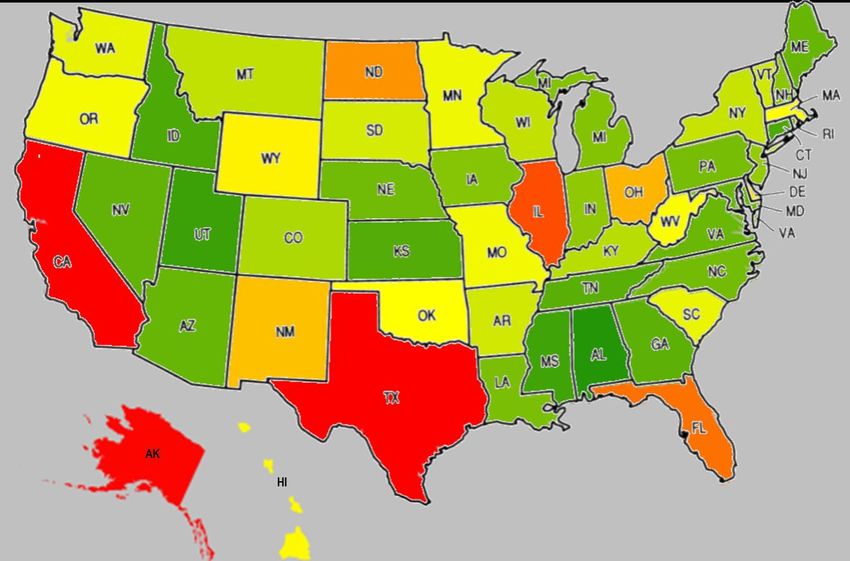
FH Healthcare Indicators and FH Medical Price Index 2021 8In the heat map below, states in which claim lines with retail clinic usage were a greater percentage of all
medical claim lines than other states in 2019 are on the red end of the spectrum, while states with a lower
percentage are on the green end (figure 3). In previous years, Minnesota was the number one state for
claim lines with retail clinic usage as a percentage of all medical claim lines by state. But this year West
Virginia took that position, with Oregon in second place and Minnesota in third. Nebraska and Missouri
came, respectively, in fourth and fifth place. Compared to the year before, all but Minnesota were new to
the list of five states with highest retail clinic usage.
The five states with the lowest retail clinic usage in 2019, in order from least to most, were Louisiana,
Wyoming, North Carolina, Alabama and Virginia. All were new to that list compared to the year before.
The geographic changes in retail clinic usage may be related to widely reported industry changes that
promote such usage. For example, following the acquisition of Aetna by CVS Health, the combined
company has been expanding the types of services allowed within its retail clinics and has been
expanding their reach. 7 Similarly, Walmart has begun expanding into retail clinics as well—offering
services such as primary care and psychiatric counseling.8
Figure 3. Percent of claim lines with retail clinic usage compared to all medical claim lines by
state, 2019
7 Angelica LaVito, “CVS Creates New Health-Care Giant as $69 Billion Merger with Aetna Officially Closes,” CNBC,
November 28, 2018, https://www.cnbc.com/2018/11/28/cvs-creates-new-health-care-giant-as-69-billion-aetna-
merger-closes.html.
8 Tina Reed, “Walmart Health Announces Expansion with New Clinics Planned in Chicago, Georgia and Florida,”
Fierce Healthcare, September 17, 2020, https://www.fiercehealthcare.com/practices/walmart-health-announces-
expansion-new-clinics-planned-chicago-georgia-and-florida#:~:text=Practices-
,Walmart%20Health%20announces%20expansion%20with%20new,in%20Chicago%2C%20Georgia%20and%20Flor
ida&text=In%20all%2C%20Walmart%20Health%20officials,%2C%20Walmart%20U.S.%20Health%20%26%20Welln
ess.
FH Healthcare Indicators and FH Medical Price Index 2021 9The age distribution of retail clinic claim lines changed in 2019 (figure 4). In 2018, individuals aged 51-60
were the age group for which the most retail clinic claim lines were submitted, but in 2019 individuals
aged 31-40 took that position, with 18 percent of retail clinic claim lines. Generally, retail clinics skewed
younger in 2019, with the age group 0-10, for example, accounting for 11 percent of claim lines compared
to 3 percent in 2018, and the age group over 80 accounting for 2 percent of claim lines compared to 6
percent in 2018.
20%
18%
16%
Percent of claim lines
14%
12%
10%
8%
6%
4%
2%
0%
0 to 10 11 to 18 19 to 22 23 to 30 31 to 40 41 to 50 51 to 60 61 to 70 71 to 80 Over 80
Age group
Figure 4. Percent of claim lines with retail clinic usage by age group, 2019
FH Healthcare Indicators and FH Medical Price Index 2021 10In 2019 as in previous years, more claim lines were submitted for women than for men in most age
groups in the places of service in which FAIR Health studied gender-related patterns—retail clinics,
urgent care centers, telehealth, ASCs and ERs. As noted in past editions, this is consistent with the
findings of other researchers that women are more likely than men to visit physicians9 and make use of
healthcare services.10
In retail clinics from 2016 to 2018, the only age group in which claim lines for males outnumbered those
for females was that of children aged 0-10. In 2019, however, the gender distribution for that age group
was almost even, with males and females each accounting for approximately 50 percent (figure 5). In the
other age groups, the gender distribution was similar to what it had been in 2018.
Over 80
71 to 80
61 to 70
51 to 60
Age group
41 to 50
31 to 40
23 to 30
19 to 22
11 to 18
0 to 10
0% 10% 20% 30% 40% 50% 60% 70% 80%
Percent of claim lines
Male Female
Figure 5. Percent of claim lines with retail clinic usage by age and gender, 2019
9 Jill J. Ashman, Esther Hing and Anjali Talwalkar, “Variation in Physician Office Visit Rates by Patient Characteristics
and State, 2012,” NCHS Data Brief, no. 212 (Hyattsville, MD: National Center for Health Statistics, 2015),
https://www.cdc.gov/nchs/data/databriefs/db212.pdf.
10 Klea D. Bertakis et al., “Gender Differences in the Utilization of Health Care Services,” Journal of Family Practice
49, no. 2 (2000):147-52, https://www.ncbi.nlm.nih.gov/pubmed/10718692.
FH Healthcare Indicators and FH Medical Price Index 2021 11As in previous years, the most common diagnostic category in retail clinics in 2019 was acute respiratory
diseases and infections, which accounted for 37 percent of retail clinic claim lines that year (figure 6). Its
share of the distribution was larger than the year before (31 percent). In 2019, encounter for immunization
was the second largest diagnostic category, at nine percent, whereas the second largest in 2018 had
been exposure to communicable diseases.
In 2019, ear infections and urinary tract infections kept the same share of the distribution as in 2018: six
percent and five percent, respectively. From 2018 to 2019, influenza and pneumonia increased from three
percent to six percent of the distribution. Viral infections and diseases entered the top diagnostic
categories in 2019, at two percent. That category included viral infection, unspecified; zoster without
complications (shingles); and viral warts (plantar included).
All Others
Encounter for 26%
Acute Respiratory
Screening
Diseases and
1%
Infections
37%
Viral Infections and
Diseases
2%
Eye Infections and
Issues
2%
Chronic Respiratory
Diseases
2%
Encounter for
General Signs and Immunization
Symptoms 9%
4%
Urinary Tract Ear Infections and
Infections Issues
5% 6%
Influenza and
Pneumonia
6%
Figure 6. Distribution of claim lines with retail clinic usage by diagnostic category, 2019
FH Healthcare Indicators and FH Medical Price Index 2021 12As in previous years, the type of procedure most commonly performed in retail clinics in 2019 was
established patient office or other outpatient services (figure 7). Its share of the distribution of retail clinic
claim lines rose from 25 percent in 2018 to 30 percent in 2019. In second place in both 2018 and 2019
was infectious agent antigen detection, but it grew from 14 percent in 2018 to 19 percent in 2019.
Psychiatric diagnostic procedures entered the top procedures at one percent of the distribution, indicating
an increase in mental healthcare in some retail clinics.
Immunology All Others
Procedures 12%
Psychiatric Diagnostic 1% Established Patient
Procedures Office or Other
1% Outpatient Services
30%
Patient History
1%
Urinalysis Procedures
2%
New Patient Office or
Other Outpatient
Services
11%
Immunization
Administration for
Vaccines/Toxoids
11% Infectious Agent
Antigen Detection
19%
Vaccines, Toxoids
12%
Figure 7. Distribution of claim lines with retail clinic usage by procedures, 2019
FH Healthcare Indicators and FH Medical Price Index 2021 13The average charges and allowed amounts for the most common procedures performed in retail clinics in
2019, as identified by CPT code, are shown in figure 8. The top eight codes by volume were similar to
2018, though the order differed slightly, with CPT 87804, the influenza test, moving from eighth to fourth
place. Also, CPT 90750 (shingles vaccine) joined the top eight while CPT 90686 (quadrivalent flu
vaccine) fell off the list. CPT 90750 (shingles vaccine) had the highest average charge ($190) and
allowed amount ($98) of the top eight. The lowest average charge was $35, for CPT 87880
(streptococcus test) and CPT 90471 (immunization administration). The lowest average allowed amount
was $12 for CPT 87880 (streptococcus test).
$200 $188 $190
$180 $167
$160
$144
$140
Average amount
$118
$120
$100 $98
$87
$80 $75 $71
$65
$60
$40
$40 $35 $35
$20 $12 $14 $13
$0
99213 87880 90471 87804 99214 99203 90750 99202
CPT code
Average Charge Amount Average Allowed Amount
CPT CPT
Code Description Code Description
99213 Office outpatient visit – 15 minutes 99214 Office outpatient visit – 25 minutes
87880 Streptococcus test 99203 Office outpatient – new – 30 minutes
90471 Immunization administration 90750 Zoster (shingles) vaccine (HZV)
87804 Influenza test 99202 Office outpatient – new – 20 minutes
Figure 8. Average charges and average allowed amounts for the most common procedures
performed in retail clinics, 2019
FH Healthcare Indicators and FH Medical Price Index 2021 14Urgent Care
The normalized share of claim lines for urgent care centers grew overall 425 percent from 2010 to 2019
(figure 9). This was a lower increase from that from 2009 to 2018 (523 percent). There was a decrease in
utilization of 11 percent from 2017 to 2018, but in the following year (2018 to 2019) there was an increase
of 47 percent overall. The increase was 47 percent in urban areas and 41 percent in rural areas.
The increase could be due, in part, to the longer flu season in 201911 and to the establishment of more
urgent care centers,12 with, reportedly, an almost 10 percent increase in the number of centers from 2018
to 2019.13
Growth in urgent care center usage from 2010 to 2019 was overall higher in rural (506 percent) than
urban areas (419 percent).
20%
18%
16%
Percent of claim lines
14%
12%
10%
8%
6%
4%
2%
0%
2010 2011 2012 2013 2014 2015 2016 2017 2018 2019
Year
Rural Urban Urgent Care Total
Figure 9. Percent of claim lines with urgent care center usage by rural, urban and national
settings, 2010-2019
11 Xiyan Xu et al., “Update: Influenza Activity in the United States during the 2018–19 Season and Composition of the
2019–20 Influenza Vaccine,” Morbidity and Mortality Weekly Report (MMWR) 68, no. 24 (June 21, 2019): 544-51,
https://www.cdc.gov/mmwr/volumes/68/wr/mm6824a3.htm?s_cid=mm6824a3_w.
12 Emily Rappleye, “Urgent Care Centers Multiply, Reaching 9,200+ in 2019,” Becker’s Hospital Review, December
12, 2019, https://www.beckershospitalreview.com/strategy/urgent-care-centers-multiply-reaching-9-200-in-
2019.html?oly_enc_id=8219H9599589B5S.
13 Joanne Finnegan, “Now More Than 9,000 Urgent Care Centers in the U.S., Industry Report Says,” Fierce
Healthcare, February 26, 2020, https://www.fiercehealthcare.com/practices/now-more-than-9-000-urgent-care-
centers-u-s-industry-report-
says#:~:text=The%20number%20of%20urgent%20care,jump%20from%20the%20previous%20year.
FH Healthcare Indicators and FH Medical Price Index 2021 15Figure 10 presents claim lines with urgent care center usage as a percentage of all medical claim lines by
rural, urban and national settings. In all three settings, the percentage of all medical claim lines attributed
to urgent care centers reached over 1 percent from 2016 to 2019.
From 2010 to 2019, rural urgent care center usage as a percentage of all rural medical claim lines grew
from 0.27 percent to 1.62 percent, while its urban counterpart grew from 0.30 percent to 1.55 percent.
Nationally, urgent care center usage as a percentage of total medical claim lines rose from 0.30 percent
in 2010 to 1.56 percent in 2019.
1.8%
Percent of all medical claim lines for that setting
1.6%
1.4%
1.2%
1.0%
0.8%
0.6%
0.4%
0.2%
0.0%
2010 2011 2012 2013 2014 2015 2016 2017 2018 2019
Year
Rural Urban Urgent Care Total
Figure 10. Claim lines with urgent care center usage as a percentage of all medical claim lines by
rural, urban and national settings, 2010-2019
FH Healthcare Indicators and FH Medical Price Index 2021 16In 2019, the same states as in 2018 ranked in the top five for claim lines with urgent care center usage as
a percentage of all medical claim lines by state, but their order was slightly different (figure 11). Hawaii,
Virginia and New Mexico, in that order, ranked from first to third place both years. Louisiana moved from
fourth to fifth place and Maryland moved from fifth to fourth place.
The five jurisdictions with the lowest urgent care center usage in 2019 were Washington, DC; Iowa; North
Dakota; Massachusetts; and Alaska. This list is similar to 2018, but with some changes in order—for
example, Washington, DC, had the lowest utilization rather than North Dakota—and with the addition of
Alaska and the removal of Montana.
Figure 11. Percent of claim lines with urgent care center usage compared to all medical claim lines
by state, 2019
FH Healthcare Indicators and FH Medical Price Index 2021 17As in previous years, the age group with the greatest share of claim lines for urgent care center usage in
2019 was that of individuals aged 31-40 (18 percent; figure 12). The age distribution generally remained
the same as in 2018.
20%
18%
16%
14%
Percent of claim lines
12%
10%
8%
6%
4%
2%
0%
0 to 10 11 to 18 19 to 22 23 to 30 31 to 40 41 to 50 51 to 60 61 to 70 71 to 80 Over 80
Age group
Figure 12. Percent of claim lines with urgent care center usage by age group, 2019
FH Healthcare Indicators and FH Medical Price Index 2021 18In 2019, as in previous years, urgent care center claim lines for females exceeded those for males in
every age group except 0-10 (figure 13). The age/gender distribution was generally similar to that of
2018. In both years, the greatest gender disparity was in the 19-22 age group, where females accounted
for 64 percent of claim lines and males for 36 percent.
Over 80
71 to 80
61 to 70
51 to 60
Age group
41 to 50
31 to 40
23 to 30
19 to 22
11 to 18
0 to 10
0% 10% 20% 30% 40% 50% 60% 70%
Percent of claim lines
Male Female
Figure 13. Percent of claim lines with urgent care center usage by age and gender, 2019
FH Healthcare Indicators and FH Medical Price Index 2021 19As in previous years, acute respiratory diseases and infections were the most common diagnostic
category in urgent care centers in 2019, accounting for 32 percent of the claim line distribution in that
place of service (figure 14). Unlike in 2018, influenza and pneumonia were the second most common
reason for individuals to seek care at urgent care centers, with seven percent of the distribution; by
contrast, influenza and pneumonia were in ninth place in 2018, with four percent. This change may be
due in part to the longer flu season in 2019.14 Chronic respiratory diseases (three percent) joined the list
of top diagnostic categories, while digestive system issues fell off.
All Others
27%
Acute Respiratory
Diseases and
Infections
32%
Chronic
Respiratory
Diseases
3%
Skin
Infections or
Issues
3% Influenza and
Pneumonia
Sprains, Strains, 7%
Breaks and
Fractures
4%
Injury to Body
General Signs 6%
and Symptoms Joint/Soft Tissue
4% Urinary Tract
Diseases and Ear Infections Infections
Issues and Issues 5%
4% 5%
Figure 14. Distribution of claim lines with urgent care center usage by diagnostic category, 2019
14Xu et al., “Update: Influenza Activity in the United States during the 2018–19 Season and Composition of the
2019–20 Influenza Vaccine.”
FH Healthcare Indicators and FH Medical Price Index 2021 20As in retail clinics (figure 7), and as in previous years in urgent care centers, established patient office or
other outpatient services were the most common procedure in urgent care centers in 2019, accounting for
24 percent of claim lines that year for that place of service (figure 15). There were few changes in top
procedure codes from 2018 to 2019. One such change was that urgent care visits (S-codes) rose from
fourth place at 10 percent to second place at 18 percent. S-codes comprise S9083 (global fee urgent care
centers) and S9088 (services provided in an urgent care).
Pulmonary Testing
Non-Chemo Injections and and Therapies
Injectable Infusions 2%
Drugs 3%
3% Diagnostic
Miscellaneous
Medicine Services Radiology Chest
3% 1%
Urinalysis
Procedures All Others
4% 16%
Infectious Agent
Antigen Detection
13%
New Patient Office or
Other Outpatient Established Patient
Services Office or Other
13% Outpatient Services
24%
Urgent Care Visits
18%
Figure 15. Distribution of claim lines with urgent care center usage by procedures, 2019
FH Healthcare Indicators and FH Medical Price Index 2021 21The most common codes being billed in urgent care centers did not change from 2018 to 2019, with two
exceptions: S9083, the global urgent care center fee, rose from fourth place to first place; and CPT
87804, the flu test, rose from seventh place to fifth place (figure 16). The highest average charge amount
in 2019 was $317 for CPT 99204, new office outpatient, 45-minute visit. The highest average allowed
amount was $147 for S9083, the global urgent care center fee. The lowest average charge amount ($18)
and average allowed amount ($2) were for CPT 81003, urinalysis procedures.
$350
$317
$300
$244 $242 $246
$250
Average amount
$194
$200
$150 $147 $143
$113 $119
$93
$100
$60
$43 $42 $49
$50
$21 $15 $18
$10 $9 $2
$0
S9083 99214 99213 99203 87804 87880 99204 96372 99051 81003
CPT/HCPCS code
Average Charge Amount Average Allowed Amount
CPT/HCPCS CPT/HCPCS
Code Description Code Description
S9083 Global fee urgent care centers 87880 Streptococcus test
Office outpatient visit – 25
99214 minutes 99204 Office outpatient – new – 45 minutes
Office outpatient visit – 15
99213 minutes 96372 Therapeutic, prophylactic or diagnostic injection
Office outpatient – new – 30 Regularly scheduled evening, weekend or holiday
99203 minutes 99051 office hours
87804 Flu test 81003 Urinalysis procedures
Figure 16. Average charges and average allowed amounts for the most common procedures
performed in urgent care centers, 2019
FH Healthcare Indicators and FH Medical Price Index 2021 22Retail Clinic, Urgent Care Center and Office: A Price Comparison
As in previous years, for a comparison of prices at retail clinics, urgent care centers and traditional offices,
FAIR Health analyzed claims data for new patient E&M codes. A new patient E&M visit includes a
detailed history for the patient, a detailed examination and medical decision making. Counseling and
coordination of care with other providers also may occur. The visits are coded by length of time: CPT
99202 is 20 minutes, CPT 99203 is 30, CPT 99204 is 45 and CPT 99205 is 60.
In 2019, the median charge amounts across offices, urgent care centers and retail clinics (figure 17)
showed relative differences similar to those seen in 2018. CPT 99202 ranged from $139 in a retail clinic
to $145 in an office to $174 in an urgent care center. CPT 99203 ranged from $150 in a retail clinic to
$217 in an office to $239 in an urgent care center.
$450 $425
$400
$400
$350 $333
$300
Median charge amount
$300
$250 $239
$231
$217
$200
$174
$145 $150
$150 $139
$100
$50
$0
99202 99203 99204 99205*
CPT code
Office Urgent Care Retail Clinic
CPT Code Description
99202 Office outpatient – new – 20 minutes
99203 Office outpatient – new – 30 minutes
99204 Office outpatient – new – 45 minutes
99205 Office outpatient – new – 60 minutes
* Retail clinics did not have enough volume to establish any values for CPT 99205.
Figure 17. Median charge amounts for offices, urgent care centers and retail clinics for new
patient E&M codes, 2019
FH Healthcare Indicators and FH Medical Price Index 2021 23In previous years, CPT 99204 was not billed frequently enough in retail clinics to have established values,
but in 2019 it was. The median charge amount range for CPT 99204 was from $231 in a retail clinic to
$300 in an urgent care center to $333 in an office. CPT 99205 was still not billed at sufficient volume in
retail clinics to establish values. As in 2018, the median charge amount for offices ($425) for that code in
2019 was higher than for urgent care centers ($400), but the spread was wider.
When the same comparisons among retail clinics, urgent care centers and offices were made on the
basis of median allowed amounts, the results (figure 18) were similar to those for charge amounts (figure
17). For CPT 99202, however, offices rather than retail clinics had the lowest median allowed amount
($78), with retail clinics in the middle ($89) and urgent care centers the highest ($120). Relative
differences for the other codes mirrored those of the median charge amounts in 2019 and were similar to
those of median allowed amounts in 2018.
$250
$228
$205
$200
$182
Median allowed amount
$164
$149
$150 $143
$120 $118
$97
$100 $89
$78
$50
$0
99202 99203 99204 99205*
CPT code
Office Urgent Care Retail Clinic
CPT Code Description
99202 Office outpatient – new – 20 minutes
99203 Office outpatient – new – 30 minutes
99204 Office outpatient – new – 45 minutes
99205 Office outpatient – new – 60 minutes
* Retail clinics did not have enough volume to establish any values for CPT 99205.
Figure 18. Median allowed amounts for offices, urgent care centers and retail clinics for new
patient codes, 2019
FH Healthcare Indicators and FH Medical Price Index 2021 24Telehealth
Telehealth usage increased nationally 1,019 percent from 2014 to 2019 (figure 19), a larger rate of growth
than in the period 2013-2018 reported last year (785 percent). The rural increase in the normalized share
of telehealth claim lines from 2014 to 2019 was 287 percent and the urban increase 1,112 percent. In the
last year of that period, from 2018 to 2019, rural areas increased 99 percent and urban areas 76 percent;
national growth was 73 percent. The rural/urban designation is based on where the patient was receiving
care.
40%
35%
30%
Percent of claim lines
25%
20%
15%
10%
5%
0%
2014 2015 2016 2017 2018 2019
Year
Rural Urban Telehealth Total
Figure 19. Percent of claim lines with telehealth usage by rural, urban and national settings, 2014-
2019
FH Healthcare Indicators and FH Medical Price Index 2021 25Figure 20 shows claim lines with telehealth usage as a percentage of all medical claim lines by rural,
urban and national settings. 2019 was the first year in this period (2014-2019) when urban and national
telehealth surpassed 0.20 percent of all medical claim lines for their respective settings—0.23 percent for
urban, 0.22 percent for national. Rural telehealth remained under that level, at 0.10 percent of all rural
medical claim lines.
0.25%
Percent of all medical claim lines for that setting
0.20%
0.15%
0.10%
0.05%
0.00%
2014 2015 2016 2017 2018 2019
Year
Rural Urban Telehealth Total
Figure 20. Claim lines with telehealth usage as a percentage of all medical claim lines by rural,
urban and national settings, 2014-2019
FH Healthcare Indicators and FH Medical Price Index 2021 26The top five states for telehealth claim lines as a percentage of all medical claim lines by state changed
almost completely from 2018 to 2019 (figure 21). In 2019, in order from most to least, they were Texas,
California, Alaska, Illinois and Florida. Only Texas persisted from the top five in 2018, and it shifted from
fifth place to first place. In general, a great deal of telehealth-related legislation was passed in 2018 and
2019, changing the telehealth landscape and expanding telehealth adoption. 15
None of the five states with the lowest telehealth use rates in 2018 (Minnesota, Rhode Island, Montana,
Massachusetts and South Dakota) could be found in the same list in 2019. In order from least to most,
that list in 2019 was Alabama, Utah, Mississippi, Connecticut and Idaho.
Figure 21. Percent of claim lines with telehealth usage compared to all medical claim lines by
state, 2019
15Jeff Lagasse, “Telehealth Laws and Regulations in 2019 Have Set the Stage for Increased Access and Use,”
Healthcare Finance, December 11, 2019, https://www.healthcarefinancenews.com/news/telehealth-laws-and-
regulations-2019-have-set-stage-increased-access-and-use.
FH Healthcare Indicators and FH Medical Price Index 2021 27As in 2018, the age group with the largest share of telehealth claim lines in 2019 was that of individuals
aged 31-40 (23 percent), and the second largest was that of individuals aged 41-50 (18 percent; figure
22). Two age groups that showed growth from 2018 to 2019 were 0-10 and 23-30, each of which had a
15 percent share of the distribution in 2019 (compared to, respectively, 9 percent and 12 percent in
2018).
25%
20%
Percent of claim lines
15%
10%
5%
0%
0 to 10 11 to 18 19 to 22 23 to 30 31 to 40 41 to 50 51 to 60 61 to 70 71 to 80 Over 80
Age group
Figure 22. Percent of claim lines with telehealth usage by age group, 2019
FH Healthcare Indicators and FH Medical Price Index 2021 28In previous years, claim lines with telehealth usage were submitted more for females than males in every
age group except children aged 0-10. That changed in 2019, when males accounted for more claim lines
than females in one adult age group: 71-80 (figure 23). The distribution in that age group was 55 percent
male, 45 percent female.
Over 80
71 to 80
61 to 70
51 to 60
Age group
41 to 50
31 to 40
23 to 30
19 to 22
11 to 18
0 to 10
0% 10% 20% 30% 40% 50% 60% 70% 80%
Percent of claim lines
Male Female
Figure 23. Percent of claim lines with telehealth usage by age and gender, 2019
FH Healthcare Indicators and FH Medical Price Index 2021 29In 2019, mental health conditions became the most common telehealth diagnostic category, moving into
first place with 35 percent of the distribution from fifth place in 2018 with 7 percent (figure 24). Acute
respiratory diseases and infections remained in second place with 21 percent in 2019 compared to 11
percent in 2018. Digestive system issues, which had been in first place in 2018, dropped off the list of
most common diagnostic categories.
Chronic Respiratory
Dermatitis All Others
Diseases
and Eczema 25%
Ear Infections 1%
1%
and Issues
2%
Joint/Soft Tissue
Diseases and
Issues
2%
Influenza and
Pneumonia
2% Eye Infections
and Issues Mental Health
3% Conditions
35%
Skin Infections or
Issues
3% Urinary Tract
Infections
5%
Acute Respiratory
Diseases and
Infections
21%
Figure 24. Distribution of claim lines with telehealth usage by diagnostic category, 2019
FH Healthcare Indicators and FH Medical Price Index 2021 30Ambulatory Surgery Center
The normalized share of claim lines for ASCs grew 60 percent overall from 2010 to 2019 (figure 25),
compared to 35 percent from 2009 to 2018. As in the period 2009-2018, growth from 2010 to 2019 was
greater in rural (84 percent) than urban areas (60 percent). After a decline from 2017 to 2018, ASC usage
increased 30 percent nationally and in urban areas in the single year from 2018 to 2019; the increase in
rural areas was 25 percent that year.
16%
14%
12%
Percent of claim lines
10%
8%
6%
4%
2%
0%
2010 2011 2012 2013 2014 2015 2016 2017 2018 2019
Year
Rural Urban ASC Total
Figure 25. Percent of claim lines with ASC usage by rural, urban and national settings, 2010-2019
FH Healthcare Indicators and FH Medical Price Index 2021 31In the period 2010 to 2018, ASCs accounted for less than one percent of all medical claim lines by rural,
urban and national settings (figure 26). But in 2019, ASCs surpassed one percent in urban (1.05 percent)
and national (1.04 percent) settings, though not in rural (0.93 percent) settings.
1.2%
Percent of all medical claim lines for that setting
1.0%
0.8%
0.6%
0.4%
0.2%
0.0%
2010 2011 2012 2013 2014 2015 2016 2017 2018 2019
Year
Rural Urban ASC Total
Figure 26. Claim lines with ASC usage as a percentage of all medical claim lines by rural, urban
and national settings, 2010-2019
FH Healthcare Indicators and FH Medical Price Index 2021 32As in previous years, more ASC claim lines in 2019 were submitted for females than males in almost
every age group (figure 27). The exceptions, as in previous years, were the age groups 0-10 (males 59
percent) and 11-18 (males 52 percent).
Over 80
71 to 80
61 to 70
51 to 60
Age group
41 to 50
31 to 40
23 to 30
19 to 22
11 to 18
0 to 10
0% 10% 20% 30% 40% 50% 60% 70%
Percent of claim lines
Male Female
Figure 27. Percent of claim lines with ASC usage by age and gender, 2019
FH Healthcare Indicators and FH Medical Price Index 2021 33Emergency Room
The normalized share of claim lines for ERs grew nationally 100 percent from 2010 to 2019 (figure 28), a
larger increase than that from 2009 to 2018 (94 percent). Urban growth from 2010 to 2019 (99 percent)
continued to be greater than rural growth (97 percent), as it had been in previous periods.
After a decline from 2017 to 2018, ER usage rose from 2018 to 2019 in national (33 percent), urban (34
percent) and rural (25 percent) settings.
16%
14%
12%
Percent of claim lines
10%
8%
6%
4%
2%
0%
2010 2011 2012 2013 2014 2015 2016 2017 2018 2019
Year
Rural Urban Emergency Room Total
Figure 28. Percent of claim lines with ER usage by rural, urban and national settings, 2010-2019
FH Healthcare Indicators and FH Medical Price Index 2021 34As in previous years, ERs accounted for a larger percentage of all medical claim lines than any of the
other places of service studied for that variable in this report (figure 29). Nationally, the ER percentage of
all medical claim lines grew from 1.47 percent in 2010 to 2.94 percent in 2019. In the rural setting, the ER
percentage of all medical claim lines for that setting grew from 1.69 percent in 2010 to 3.33 percent in
2019. In urban areas, the percentage grew from 1.45 percent to 2.89 percent.
4.5%
Percent of all medical claim lines for that setting
4.0%
3.5%
3.0%
2.5%
2.0%
1.5%
1.0%
0.5%
0.0%
2010 2011 2012 2013 2014 2015 2016 2017 2018 2019
Year
Rural Urban Emergency Room Total
Figure 29. Claim lines with ER usage as a percentage of all medical claim lines by rural, urban and
national settings, 2010-2019
FH Healthcare Indicators and FH Medical Price Index 2021 35As in 2017 and 2018, the age group with the greatest share of claim lines for ER usage in 2019 was 51-
60 (16 percent; figure 30). The age range 31-70, comprising the four age groups with the greatest share
of claim lines, collectively accounted for 56 percent of the distribution. Pediatric patients (ages 0-18)
accounted for the same percentage as in 2017 and 2018 (12 percent).
18%
16%
14%
Percent of claim lines
12%
10%
8%
6%
4%
2%
0%
0 to 10 11 to 18 19 to 22 23 to 30 31 to 40 41 to 50 51 to 60 61 to 70 71 to 80 Over 80
Age group
Figure 30. Percent of claim lines with ER usage by age group, 2019
FH Healthcare Indicators and FH Medical Price Index 2021 36As with all of the other places of service studied for gender, and as in 2018, more claim lines with ER
usage in 2019 were submitted for females than males in most age groups (figure 31). The sole exception
was the age group 0-10, in which claim lines for boys (55 percent) outnumbered those for girls (45
percent). In the age groups 11-18 and 61-70, the disparity between females (52 percent) and males (48
percent) was relatively small, but the gap was wider in the other age groups.
Over 80
71 to 80
61 to 70
51 to 60
Age group
41 to 50
31 to 40
23 to 30
19 to 22
11 to 18
0 to 10
0% 10% 20% 30% 40% 50% 60% 70%
Percent of claim lines
Male Female
Figure 31. Percent of claim lines with ER usage by age and gender, 2019
FH Healthcare Indicators and FH Medical Price Index 2021 37Figure 32 shows the 2019 distribution of claim lines with ER usage by diagnostic category for individuals
over the age of 22. The top 15 diagnostic categories remained fairly stable from 2018, with digestive
system issues still at number one, though with 12 percent rather than 15 percent of the distribution. There
were some changes in order, however, and chest pain was added to the list at number two (with 10
percent) while endocrine and metabolic disorders fell off the list. Overall, the diversity of conditions seen
in the ER expanded in 2019, with the category of “All Others” constituting 33 percent of the distribution in
2019 compared to 19 percent in 2018. “All Others” in 2019 included influenza and pneumonia, kidney and
bladder stones, and mental health issues, among other diagnostic categories.
35%
30%
Percent of claim lines
25%
20%
15%
10%
5%
0%
Diagnostic category
Figure 32. Distribution of claim lines with ER usage by diagnostic category for individuals over 22
years of age, 2019
FH Healthcare Indicators and FH Medical Price Index 2021 38The 2019 distribution of claim lines with ER usage by procedures for individuals in all age groups, not
including E&Ms (figure 33), was similar to that in 2018. Again, diagnostic radiology of the chest was the
most common procedure, with 12 percent of the 2019 distribution, and again cardiography procedures
were in second place (11 percent). Diagnostic radiology of the abdomen fell from third place to sixth
place, being displaced by chemistry procedures, hematology and coagulation procedures and diagnostic
radiology of the head and neck. There was more diversity in the 2019 distribution, in which “All Others”
accounted for 30 percent, than in the 2018 distribution, in which that category accounted for 21 percent.
Diagnostic
Radiology Chest
12%
All Others
30% Cardiography
Procedures
11%
Diagnostic Radiology
Upper Extremities
Chemistry
3%
Procedures
9%
Urinalysis
Procedures
3% Hematology and
Coagulation
Diagnostic Radiology Procedures
Lower Extremities 7%
3%
Diagnostic Radiology
Miscellaneous Head and Neck
Medicine Services Diagnostic Radiology 6%
Organ- or Disease-
4% Abdomen
Oriented Panels
6% 6%
Figure 33. Distribution of claim lines with ER usage by procedures for individuals in all age
groups, not including E&Ms, 2019
FH Healthcare Indicators and FH Medical Price Index 2021 39Figure 34 shows average charges and allowed amounts for the most common ER procedure codes in
2019. The most common ER codes remained the same from 2018 to 2019, except that two codes
changed places, with CPT 85025 (blood count; complete [CBC], automated) becoming seventh and CPT
70450 (CT head/brain without contrast material) becoming eighth. The highest average charge amount
($1,151) and average allowed amount ($500) were for CPT 99285 (emergency department visit—high
severity—life threatening). The lowest average charge amount ($36) and average allowed amount ($10)
were for CPT 85025 (blood count; complete [CBC], automated).
$1,400
$1,200 $1,151
$1,000
Average amount
$800
$708
$602
$600
$500
$441
$400
$308
$192
$200
$82
$44 $19 $41 $16 $46 $19 $36 $10
$0
99285 99284 99283 93010 71045 71046 85025 70450
CPT code
Average Charge Amount Average Allowed Amount
CPT CPT
Code Description Code Description
Emergency department visit – high
99285 severity – life threatening 71045 Single-view chest X-ray
Emergency department visit –
99284 high/urgent severity 71046 Two-view chest X-ray
Emergency department visit – moderate
99283 severity 85025 Blood count; complete (CBC), automated
70450 CT head/brain w/o contrast material
93010 Electrocardiogram
Figure 34. Average charges and allowed amounts for the most common procedures performed in
ERs, 2019
FH Healthcare Indicators and FH Medical Price Index 2021 40FH Medical Price Index
As stated in the Methodology section, FH Medical Price Index uses median charge amounts and median
imputed allowed amounts and calculates the changes in those amounts across the years. FH Medical
Price Index is based on FAIR Health’s benchmark products. Benchmark releases from 2020 did not show
changes that were different from past years. FAIR Health conducts rigorous testing and analysis on each
of its benchmark modules to ensure consistency and validity prior to release.
Professional E&M
The professional E&M indices include CPT codes in the AMA CPT code category Evaluation and
Management Services for procedures typically performed in a professional setting as opposed to a
hospital setting. This includes office visits such as CPT 99213 and consultations such as CPT 99241.
From November 2019 to November 2020, the professional E&M charge amount index continued the
steady upward trend seen since the base period of May 2012 (figure 35). The index increased from 1.34
in November 2019 to 1.38 in November 2020, a three percent increase.
1.38
1.4 1.36
1.34
1.31
1.28
1.3 1.26
1.23
1.21 1.22
1.18
1.2 1.16
1.13
1.11
1.08
1.1
1.05 1.06
1.03
1.00
1.0
0.9
Figure 35. Professional E&M charge amount index
FH Healthcare Indicators and FH Medical Price Index 2021 41The professional E&M allowed amount index saw similar steady growth (figure 36). The index increased
from 1.33 in November 2019 to 1.39 in November 2020, a five percent increase.
1.39
1.4 1.37
1.33
1.31
1.3 1.26 1.27
1.23
1.20 1.21
1.18
1.2 1.16
1.13
1.11
1.08
1.1 1.05 1.06
1.03
1.00
1.0
0.9
Figure 36. Professional E&M allowed amount index
FH Healthcare Indicators and FH Medical Price Index 2021 42You can also read