Climatic Summary Relevant to Wetlands and Landscape Condition in South-Eastern Australia - December 2019
←
→
Page content transcription
If your browser does not render page correctly, please read the page content below
Climatic Summary Relevant to
Wetlands and Landscape
Condition in South-Eastern
Australia
December 2019

                   Image provided by Sally Roberts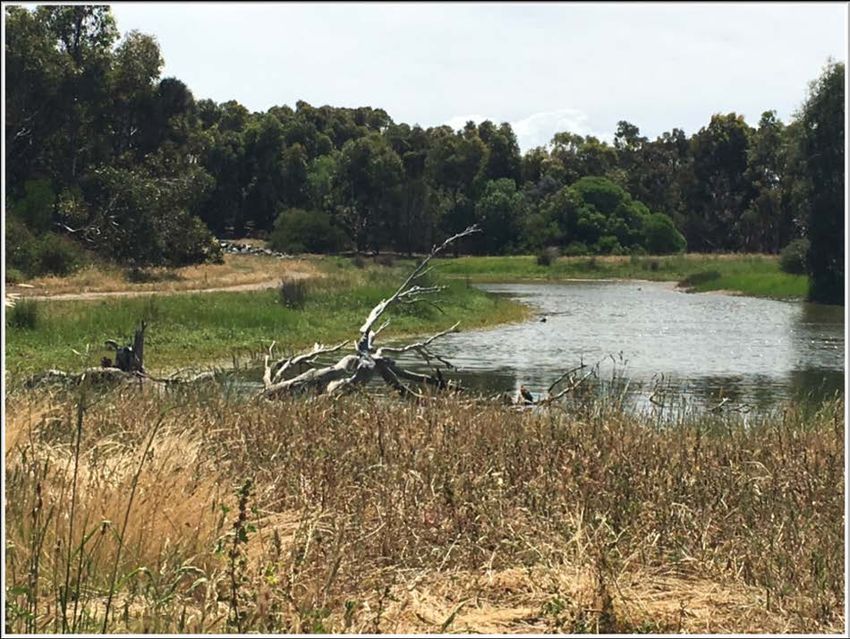
Contents
.....................................................................................................................................1
1.          Executive Summary ..........................................................................................4
2.          Introduction ......................................................................................................4
3.          Rainfall ..............................................................................................................4
  3.1.           Australia..................................................................................................................................................................................................................4
  3.2.           South Australia ................................................................................................................................................................................................. 10
     Seasonal rainfall summary across South Australia.......................................................................................................................................... 14
  3.3.           Victoria ................................................................................................................................................................................................................. 15
  3.4.           Murray-Darling Basin ..................................................................................................................................................................................... 17
     Monthly Inflows to the Murray-Darling Basin .................................................................................................................................................. 18
     Water Availability in the Murray-Darling Basin ................................................................................................................................................ 19

4.          Climate summaries and forecasts .................................................................20
  4.1.           Bureau of Meteorology Seasonal Climate Summary 2019 ............................................................................................................ 21
     Spring 2019 in South Australia: drier than average........................................................................................................................................ 21
     Winter in 2019: driest winter for more than a decade .................................................................................................................................. 21
     Autumn in 2019: drier than average with warm days ................................................................................................................................... 22
  4.2.           Current status of the ENSO cycle and the Indian Ocean Dipole (IOD) ..................................................................................... 22
  4.3.           Climate Outlook – Summer 2019/20 ...................................................................................................................................................... 23
     Drier than average summer likely for the east, wetter for the west coast ............................................................................................ 24
  4.4.           Flow Outlook - Murray-Darling Basin 2019-20 .................................................................................................................................. 24
     Flow outlook ................................................................................................................................................................................................................... 25
     Environmental water.................................................................................................................................................................................................... 26

5.          Landscape condition ......................................................................................26
  5.1.           Vegetation monitoring products derived from NOAA satellite data ........................................................................................ 26
  5.2.           Landscape modelling..................................................................................................................................................................................... 28
     AussieGRASS – Spatial ................................................................................................................................................................................................ 28
     Pasture Growth Rate (PGR) ....................................................................................................................................................................................... 30
  5.3.           Crop and pasture conditions and performance in South Australia ........................................................................................... 32

6.          References .......................................................................................................32

                                                                                                                                                                                                                                           2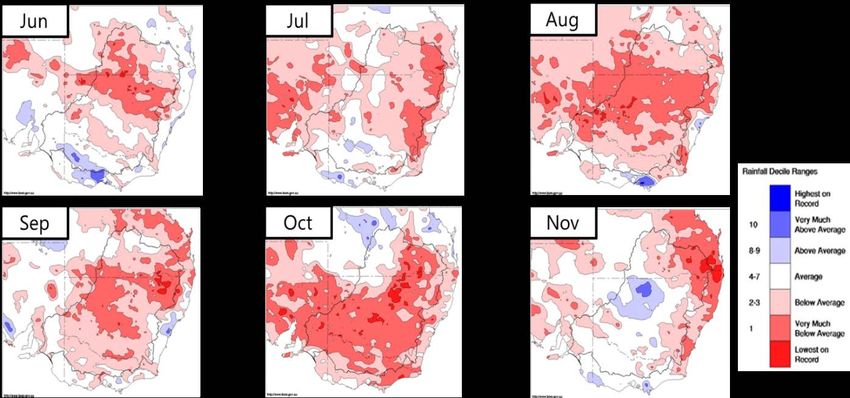
Figures
Figure 1 Australian rainfall deciles for the previous 12 months (December 2018 - November 2019) (BOM 2019). .......................5
Figure 2 Annual Australian rainfall deciles 2014 to 2019 (BOM 2019). ..............................................................................................................6
Figure 3 Inter-annual rainfall differences (Dec/Nov 2018/2019 - Dec/Nov 2017/18) (BOM 2019)........................................................7
Figure 4 Inter-annual rainfall difference (Dec/Nov 2017/2018 to Dec/Nov 2016/17) (BOM 2019). ......................................................7
Figure 5 Inter-annual rainfall difference (Dec/Nov 2016/2017 to Dec/Nov 2015/2016) (BOM 2019). .................................................8
Figure 6 Rainfall deficiencies - 6 months (1 June to 30 November 2019) (BOM 2019). .............................................................................9
Figure 7 Rainfall deficiencies - 12 months (1 December 2018 to 30 November 2019) (BOM 2019). ....................................................9
Figure 8 Rainfall deficiencies - 24 months (1 December 2017 to 30 November 2019) (BOM 2019). ................................................. 10
Figure 9 South Australian percent of mean rainfall (December 2018 – November 2019) (BOM 2019). ........................................... 11
Figure 10 South Australian rainfall deciles (Dec 2018 to Nov 2019) (BOM 2019). ..................................................................................... 12
Figure 11 South Australian inter-annual rainfall differences (Dec/Nov 2018/2019 – Dec/Nov 2017/2018) (BOM 2019). ........ 13
Figure 12 South Australian rainfall deficiencies (June to November 2019) (BOM 2019). ........................................................................ 13
Figure 13 South Australian rainfall deficiencies (December 2018 to November 2019) (BOM 2019). ................................................. 14
Figure 14 Victorian percentage of mean rainfall, Dec 2018 to Nov 2019 (BOM 2019). ........................................................................... 16
Figure 15 Victorian rainfall deciles, Dec 2018 to Nov 2019 (BOM 2019). ....................................................................................................... 17
Figure 16 Monthly rainfall deciles in the Murray–Darling Basin for June to November 2019 (BOM 2019). .................................... 17
Figure 17 Murray-Darling Basin (MDB) rainfall anomalies (Dec 2018 to Nov 2019) (BOM, 2019). ..................................................... 18
Figure 18 Murray system daily inflows compared to long term average flows (excluding Menindee Lakes & Snowy
Mountains Scheme) as of May 2019 (DEW 2019). ................................................................................................................................................... 19
Figure 19 Total storage volumes in the Northern and Southern Murray-Darling Basin 31 October 2019 (BOM 2019). ........... 20
Figure 20 National seasonal rainfall outlook, December 2019 to February 2020 (BOM, 2019). ........................................................... 23
Figure 21 National seasonal temperature outlook, October 2018 to December 2018 (BOM, 2019). ................................................ 24
Figure 22 Flow to South Australia outlook. ................................................................................................................................................................. 25
Figure 23 Normalised Difference Vegetation Index (NDVI) October 2019 (BOM, 2019). ........................................................................ 27
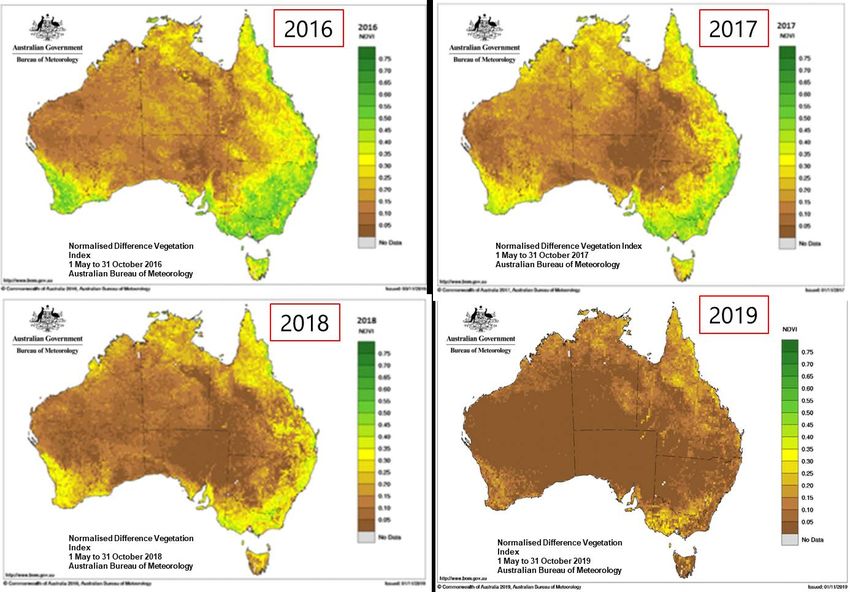
Figure 24 Normalised Difference Vegetation Index (NDVI) 2016-2019 (BOM 2019). ............................................................................... 27
Figure 25 SA pasture growth relative to historical records from 1957 for Dec 2017 to Nov 2018 (left) & Dec 2018 to Nov
2019 (right). .............................................................................................................................................................................................................................. 28
Figure 26 SA pasture growth relative to historical records from 1957 for Feb 2018 (left) & Dec 2016 to Nov 2017 (right). .. 29
Figure 27 SA pasture biomass relative to historical records from 1957, Dec 2015 to Nov 2016 (left) & Dec 2016 to Nov 2017
(right). .......................................................................................................................................................................................................................................... 29
Figure 28 SA pasture biomass relative to historical records from 1957, Dec 2013 to Nov 2014 (left) & December 2014 to
Nov 2015 (right)...................................................................................................................................................................................................................... 30
Figure 29 Monthly Pasture Growth Rates - Adelaide Hills, Mid Murray and Orroroo districts, 2019. ............................................... 30
Figure 30 Monthly Pasture Growth Rates - Adelaide Hills, Mid Murray and Orroroo districts, 2018. ............................................... 30
Figure 31 Monthly Pasture Growth Rates - Adelaide Hills, Mid Murray and Orroroo districts, 2017. ............................................... 31
Figure 32 Monthly Pasture Growth Rates - Adelaide Hills, Mid Murray and Orroroo districts............................................................. 31
Figure 33 Monthly Pasture Growth Rates - Adelaide Hills, Mid Murray and Orroroo districts, 2015. ............................................... 31
Figure 34 Monthly Pasture Growth Rates - Adelaide Hills, Mid Murray and Orroroo districts, 2014. ............................................... 32
Tables
Table 1 Seasonal rainfall summary across South Australia, 1 November 2018 to 30 November 2019 (BOM 2019). .................. 14
3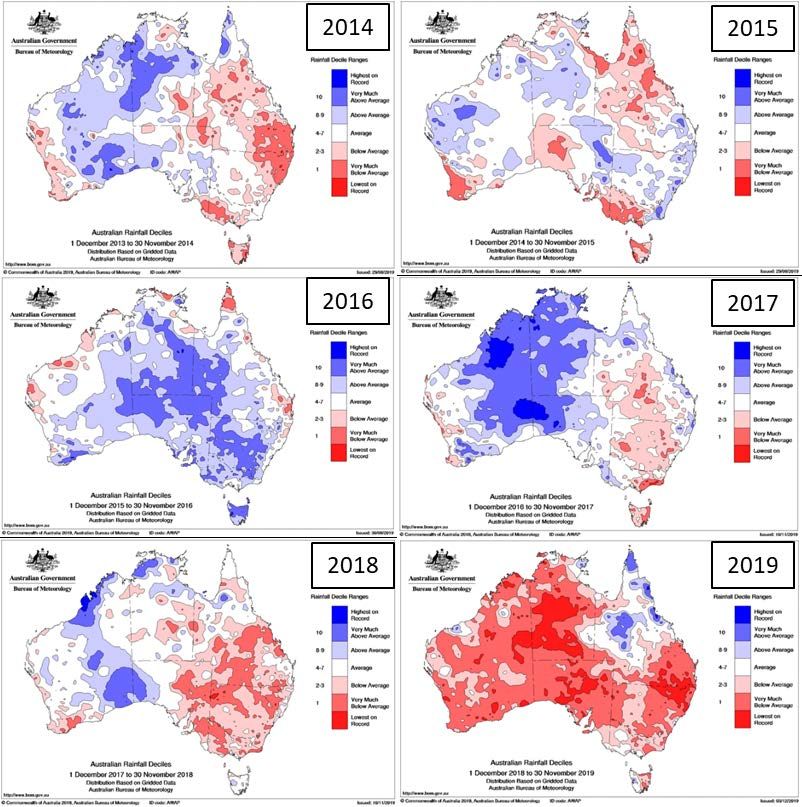
1. Executive Summary
The Department for Environment and Water (DEW) prepares this Climatic Summary Relevant to Wetlands and Landscape
Condition in South-Eastern Australia report and the Assessment of Waterfowl Abundance and Wetland Condition in South-
Eastern South Australia report annually. Together these reports provide a comprehensive snapshot of wetland conditions
and how that influences the conservation status of waterfowl in South Australia, as well as at a continental scale.

    2. Introduction
Significant rainfall events promote wetland vigour and expand waterfowl habitat, but most importantly, they stimulate
waterbird breeding. The Eastern Australian Aerial Waterbird Survey (EAAWS) monitors changes in the abundance and
distribution indices of waterbird species in Eastern Australia and has shown over a succession of years that there is a strong
positive correlation between waterfowl abundance, wetland condition and rainfall.

Waterfowl have the ability to anticipate climatic changes before their effects are felt, often migrating under the cover of
darkness to areas where water is expected. This behaviour is triggered by the need to find productive feeding habitat but
also by their instinctive will to breed if water levels and habitat condition permit. Waterfowl lead a tenuous existence; their
distribution and abundance is controlled by the availability of shallow wetland habitats, often in the interior, which are
spatially and temporally highly variable. They must also compete with humankind for water resources that are becoming
increasingly regulated and less commonly allocated as environmental flows.

Climatic conditions regulate waterfowl population sizes in an unforgiving and often ruthless manner. Functionally, boom
and bust changes in waterfowl abundance correlate with climatic extremes. Were it not for their opportunistic ability to
breed, in some cases instantaneously, waterfowl populations would not be able to benefit from the short duration but high
productivity of many of Australia’s ephemeral wetland systems. To appreciate changes to waterfowl population dynamics,
we must be aware of the likely effects of climate on their activity cycle. This paper examines recent rainfall statistics, discusses
similarities between rainfall and wetland condition and compares it with NDVI satellite images and landscape models which
show the density and vigour of green vegetation growth across the Australian continent and more closely within regional
SA.

Quail lead a nomadic existence; their movements are thought to be dictated by the availability of food resources and ground
cover. Anthropogenic activities such as cropping play some role in co-determining the suitability of habitat for quail.
However, true abundance is thought to be regulated by climatic influences and landscape condition. Quail are difficult
subjects to monitor and it is not completely understood what their behavioural response to dry climatic conditions is, other
than the vague notion that population densities decrease. This paper uses the AussieGRASS Pasture Model (CSIRO) and
wheat yield data to explain the condition of natural and anthropogenic landscapes in South Australia.

    3. Rainfall
    3.1. Australia
For the year to date, rainfall has been below to very much below average over much of Australia, as is reflected in the 12
month rainfall deficiencies. For Australia as a whole, it was the second-driest January–October on record, coming in behind
January–October 1902. It was the driest January–October on record for South Australia, and amongst the five driest on record
for New South Wales, Western Australia, and the Northern Territory.

                                                                                                                                  4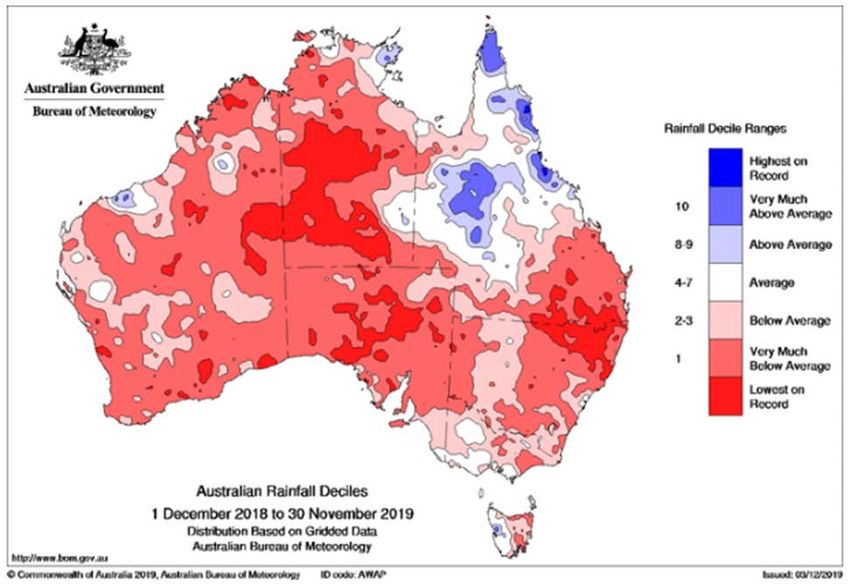
Widespread rain and scattered thunderstorms associated with a slow-moving trough and cold front in the first days of
November brought some rainfall across large areas of eastern Australia. This event brought the first significant rainfall since
early May through some areas of inland Queensland and central to western New South Wales. However, existing
accumulated rainfall anomalies are very deep due to the prolonged nature of the current dry period, with below average
rainfall over most months since early 2017. Parts of southwest Australia and southeast and eastern Australia including parts
of southeast Queensland and southern and eastern New South Wales have seen substantial declines in cool season rainfall
in recent decades.

Figure 1 Australian rainfall deciles for the previous 12 months (December 2018 - November 2019) (BOM 2019).

For the year to date, rainfall has been below to very much below average over most of Australia except central to northern
Queensland. Rainfall for January–November was above average across parts of Queensland's northwest and northern tropics,
mostly as a result of very much above average rainfall during the first quarter of the year. The year commenced with
significant rainfall deficiencies in place across large areas of eastern Australia, and low rainfall during the year has resulted
in an increase in the severity of rainfall deficiencies and an expansion of the area affected (Figure 1).

As well as the significant deficiencies affecting New South Wales, southern Queensland, eastern Victoria, and eastern South
Australia, rainfall deficiencies intensified throughout the year in Western Australia - including across the South West Land
Division. Several active tropical systems, including severe tropical cyclone Trevor, brought above average rainfall to parts of
northern and western Queensland during the first months of 2019. Significant flooding resulted in and around Townsville
during late January to early February. In the Gulf Country and western Queensland extensive and long-lived flooding lasted
from February into April, spread at its peak across an area some 70 km wide and an estimated 15 000 sq. km. in total area.
Floodwaters from these events eventually made their way to Lake Eyre / Kati Thanda in South Australia, for the most
significant filling event for Lake Eyre / Kati Thanda since 2010–11. In Western Australia, severe tropical cyclone Veronica
caused major flooding in the coastal Pilbara during March. Although March and April were wetter than average for some
parts of eastern Australia, April was very much drier than average for eastern New South Wales and most of Victoria. For the
remainder of the year rainfall was generally below average over large areas, with conditions turning especially dry from July
onwards across continental southern Australia. July–November rainfall was the lowest on record for the southern half of
Australia. In addition to the very dry second half of the year, parts of Queensland and New South Wales have had significantly

                                                                                                                               5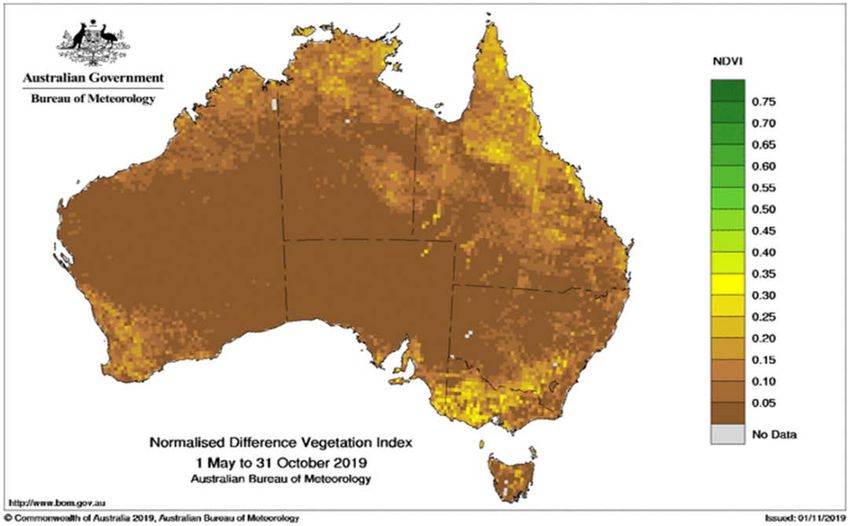
below average rainfall for several years. Extremely dry conditions and very much above average temperatures led to
increased fire risk across New South Wales and Queensland during spring (Figure 1).

The annual trend in rainfall deciles since 2014-2019 are shown in Figure 2. The blue shaded areas indicate above average
conditions while red shading denotes rainfall level below average conditions. A moderately below average rainfall trend
develops in south eastern Australia in 2014 -15 but the trend reverses as with increased rainfalls to above average to very
much above average rainfalls in 2016 and 2017 period. However, in 2018 and 2019, on a continental scale, beginning from
the south eastern and eastern Australia, the rainfall decile has regressed trending towards drier conditions from very much
below average to the lowest on record rainfalls (Figure 2).

Figure 2 Annual Australian rainfall deciles 2014 to 2019 (BOM 2019).

The inter-annual rainfall differences for 2018/19 compared with 2017/18 (Figure 3) show areas of relative decline in rainfall
across the majority of Western Australia, Northern Territory (except the south-western section), north-west and southern-

                                                                                                                           6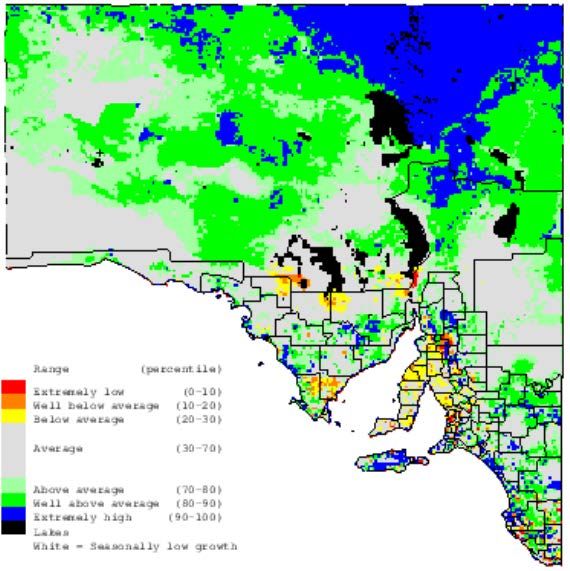
eastern parts of Queensland, western and eastern parts of South Australia and Tasmania, as well as in smaller pockets in
Victoria and New South Wales. Figures 4 and 5 are comparisons over two and three years each.

Figure 3 Inter-annual rainfall differences (Dec/Nov 2018/2019 - Dec/Nov 2017/18) (BOM 2019).

Figure 4 Inter-annual rainfall difference (Dec/Nov 2017/2018 to Dec/Nov 2016/17) (BOM 2019).

                                                                                                                      7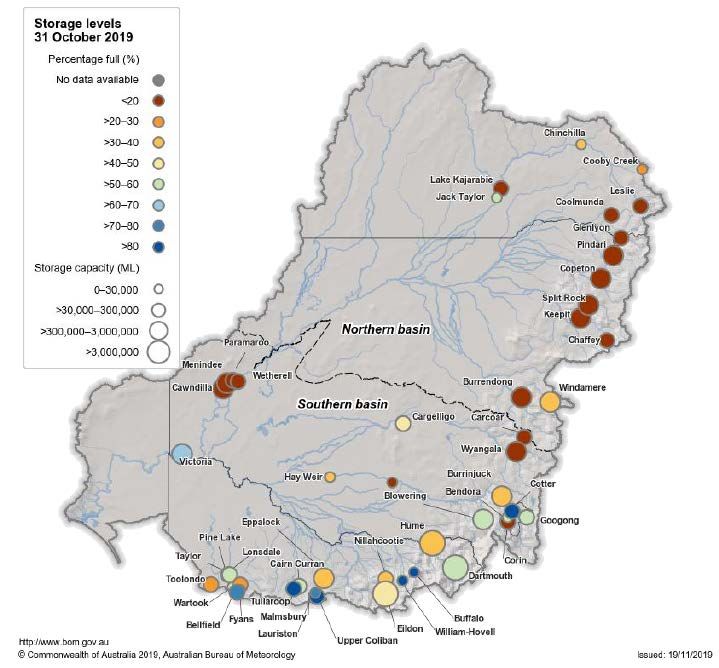
Figure 5 Inter-annual rainfall difference (Dec/Nov 2016/2017 to Dec/Nov 2015/2016) (BOM 2019).

Rainfall deficiencies are a key indicator of drought conditions and assumed to provide a surrogate of wetland area. Rainfall
deficiencies for the year to date have increased slightly across the south of Western Australia and South Australia, south
eastern New South Wales, and central and eastern Victoria. In New South Wales, serious to severe rainfall deficiencies extend
across most of the North West Slopes and Northern Tablelands, along with coastal areas from the Hunter northwards. Areas
of deficiencies also exist across the southern coast of New South Wales, and between the New South Wales Tablelands and
Central District in Victoria, as well as in inland to coastal central Gippsland (Figs. 6, 7 and 8)

In Queensland, serious to severe rainfall deficiencies affect the greater southeast, the eastern Maranoa, and the Capricornia
District. Areas of record low rainfall cover an area extending from the Southern Downs in Queensland to the New South
Wales' central Northern Tablelands, Northwest Plains, and part of the Mid-North Coast district. In some areas, particularly in
the Northern Tablelands and North West Slopes and Plains in New South Wales and the Southern Downs in Queensland,
rainfall for January–October 2019 is more than 20% below previous record lows (Fig. 7).

Serious to severe rainfall deficiencies are also evident across much of the central and southern Northern Territory away from
the Queensland border; most of South Australia except parts of the southeast, western Eyre Peninsula, and far northeast;
across western New South Wales and the Mallee in Victoria. In Western Australia serious to severe rainfall deficiencies affect
most of the interior of that state, nearly all areas along the south coast and most of the Southwest Land Division, and parts
of the Pilbara and Kimberley. A large area has observed lowest on record rainfall for January–September, particularly in the
central Northern Territory, and around the Alice Springs District, pastoral South Australia, and central eastern Western
Australia (Figs. 7 and 8).

                                                                                                                            8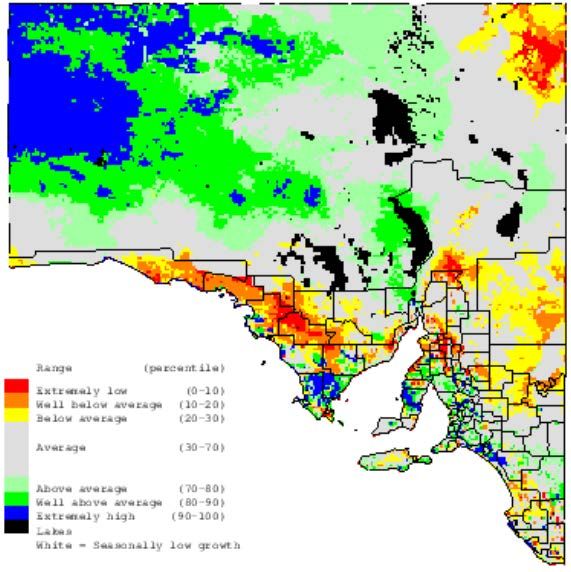
Figure 6 Rainfall deficiencies - 6 months (1 June to 30 November 2019) (BOM 2019).

Figure 7 Rainfall deficiencies - 12 months (1 December 2018 to 30 November 2019) (BOM 2019).

                                                                                               9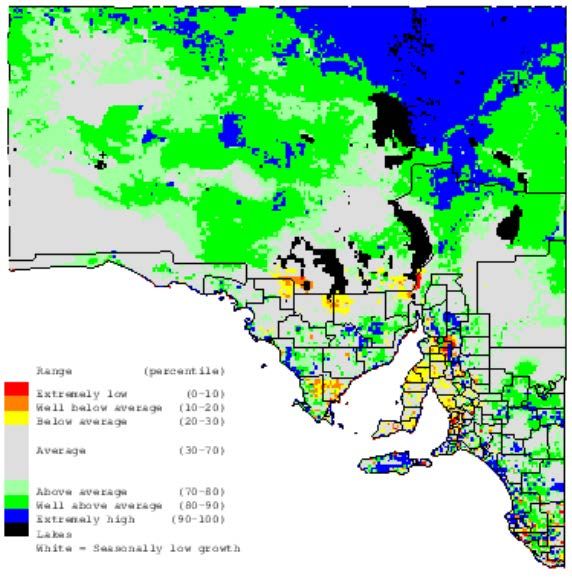
Figure 8 Rainfall deficiencies - 24 months (1 December 2017 to 30 November 2019) (BOM 2019).

    3.2. South Australia
Summer 2018/19: Rainfall in summer was below average to very much below average in most central and north-eastern
districts, making it South Australia's driest summer since 1985–86. Heatwaves in December and January resulted in numerous
sites setting new high temperature records during summer 2018–19. For mean maximum temperature, it was South
Australia's hottest summer on record and third-warmest for mean minimum temperature.

Autumn 2019: Rainfall in autumn was below average in most areas of South Australia away from some southern coastal
fringes and in the northeast. Daytime temperatures in autumn were very much above average across large areas of the state
and night-time temperatures were near-average or warmer than average.

Winter 2019: Rainfall in winter was below to very much below average across most of the state, making it South Australia's
tenth-driest winter on record and driest since 2007. Daytime temperatures were warmer than average for the northern two
thirds of the state, but nights were cooler than average in many central and northern areas.

Figure 9 shows the South Australian rainfall percentile from December 2018 to November 2019. During this period,
approximately 95% of South Australia had rainfall percentiles of between 0%-80% while the remaining parts of the state
(parts of South East and Eyre Peninsula) were in the 80%-100% range, which describes below the average to very much
below average rainfalls that the state experienced between summer (2018/9) and autumn 2019.

                                                                                                                       10
Figure 9 South Australian percent of mean rainfall (December 2018 – November 2019) (BOM 2019).
Figure 10, similar to Figure 9 also depicts (approx.) 95% of South Australia falling in the rainfall decile categories of between
below average to lowest on record while the remaining 5% (the South East region) showing average rainfalls over the 12
month period.
11Figure 10 South Australian rainfall deciles (Dec 2018 to Nov 2019) (BOM 2019).
The inter-annual rainfall difference (Figure 11) for Dec/Nov 2018/19 relative to 2017/18 shows a decreasing trend in the
inter-annual rainfalls from the eastern part of the state towards the western part demonstrating that rainfalls greatly
decreased relatively compared to the previous year with reduction of between -100 to -400mm. Small pockets in the range
of -100mm to -200mm were noted in Kangaroo Island, Fleurieu Peninsula and at the north western corner of the state.
Figures 12 and 13 show rainfall deficiencies for 6 months and 12 month periods for South Australia as comparison.
12Figure 11 South Australian inter-annual rainfall differences (Dec/Nov 2018/2019 – Dec/Nov 2017/2018) (BOM 2019).
Figure 12 South Australian rainfall deficiencies (June to November 2019) (BOM 2019).
13Figure 13 South Australian rainfall deficiencies (December 2018 to November 2019) (BOM 2019).
Seasonal rainfall summary across South Australia
Table 1 Seasonal rainfall summary across South Australia, 1 November 2018 to 30 November 2019 (BOM 2019).
Season Rainfall Summary
Summer • Rainfall in summer was 64% below average for South Australia, the state's driest summer
2018/19 since 1985–86
• Summer was drier than average across most of South Australia, with areas of near-average
rainfall in the west, South East districts and on Kangaroo Island
• In the Lower South East agricultural district, despite a drier than average January and
February, a wetter than average start to the season in December lifted summer rainfall totals
close to average
• South Australia's mean maximum temperature for summer was 3.09 °C warmer than average,
making it the highest on record (previous highest was +2.87 °C in summer 2000–01).
Autumn 2019 • Rainfall in autumn was 50% below average for the state as a whole, a very dry first five
months of the year
• March and April were drier than average for South Australia and May was drier than average
across large areas of the state's north
• Rainfall was below average in many eastern Agricultural districts and throughout much of the
state's west
14• Daytime temperatures in autumn were very much above average across large areas of the
state and night-time temperatures were near-average or warmer than average.
Winter 2019 • Rainfall in winter was 56% below average, making it South Australia's driest winter since 2007
• Rainfall was very much below average across large areas of the state
• All winter months of June, July, and August were drier than average
• The very dry winter has significantly expanded the areas experiencing serious and severe
rainfall deficiency from the first five months of the year and they now cover most of the state
except the far northeast and the southeast for the January to August period
• Daytime temperatures for winter were warmer than average across the northern two thirds of
South Australia
• Night-time temperatures were cooler than average in the Northeast and some areas of the
central and western districts, but average to warmer than average in the South East
agricultural districts.
Spring 2019 • Rainfall for South Australia was 70% below average, the state's third-driest spring on record
and lowest spring total since 1967
• Daytime temperatures in spring were warmer that average, particularly in the west, with the
state's mean maximum temperature the sixth-highest on record for spring.
• Night-time temperatures were generally closer to average, though above average in the west
and some areas of below average mean minimum temperatures in the Riverland, Mid North,
and South East districts
• The highest totals were in the Mount Lofty Ranges and Lower South East district, where
208.2 mm was recorded at Mount Schank (Jethia)
• The pastoral districts had less than 25 mm for the season and large areas of the north had
totals that were more than 80% below average.
• More than 99% of South Australia by area had below median spring rainfall, including more
than half the state with very much below average rainfall
3.3. Victoria
The seasonal rainfall summary over a 12 month period from Dec 2018 to Nov 2019 is presented below which correlates to
the graphical presentations as rainfall percentages and deciles in Figures 14 and 15:
Summer 2019/2019: Rainfall during summer 2018–2019 was below average for Victoria as a whole. Mean daytime and
night-time temperatures were warmer than average across the state. Overall, it was Victoria's warmest summer on record.
State-wide, summer rainfall was 12% below the long-term summer mean of 120 mm. Rainfall during summer was above
average in parts of Victoria's north, while in parts of the state's south and southeast it was below average.
Autumn 2019: Parts of the state recorded close to average rainfall for autumn, but most of western Victoria and parts of
North Central, Upper North, East Central and West Gippsland had below average rainfall. Above average autumn rainfall was
recorded in parts of the Northeast and Western Plains districts. Parts of the far northwest Victoria received less than 40% of
the mean autumn rainfall. Averaged across the state, rainfall was 21% below the autumn average of 157 mm, continuing a
run of five consecutive seasons of drier than average conditions in Victoria.
Winter 2019: Winter rainfall in Victoria was below average across much of the north and east of the state, while in parts of
the south it was above average. Winter rainfall in Victoria was below average across much of the north and east of the state.
Parts of the southern Victoria had wetter than average winter. State-wide, rainfall was about 11% below the winter average
of 203 mm.
Spring 2019: Victoria in spring 2019 was drier than average, with areas of very much below average rainfall totals across the
state's north. Total rainfall for spring was below average in most of Victoria, and very much below average in large areas
15across the state's north; rainfall was below average in September, well below average in October and close to average in
November. State-wide, average rainfall was 39% below the long-term spring mean of 181 mm.
Figure 14 shows the Victorian rainfall percentile distribution over the past 12 months. An increasing trend is observed in the
precentage of mean from the the north-western parts of Victoria towards the south and south south-eastern parts with the
mean percentages in the ranges of between 0% to 125%. Lower mean percentages indicate drier conditions (low rainfall)
whilst higher mean percentages indicates wetter conditions or higher rainfall.
Figure 14 Victorian percentage of mean rainfall, Dec 2018 to Nov 2019 (BOM 2019).
The average rainfall deciles depited in Figure 15 indicates the higher rainfalls which occurred in the the southern, south east
and a little pocket in the north east part of Victoria. The regions marked as below average to the very much below average
rainfall deciles indicates declining rainfalls across the state.
16Figure 15 Victorian rainfall deciles, Dec 2018 to Nov 2019 (BOM 2019).
3.4. Murray-Darling Basin
The Murray-Darling Basin is a region supporting many aquatic ecosystems and is an important region for waterfowl breeding.
2019 has been very hot and dry in the Murray Darling Basin and across Australia. Figure 16 shows the rainfall deciles ranging
from the highest on record to the lowest on record. Ninety percent (90%) of Murray Darling Basin recorded rainfall percentile
of below average to the lowest on record in August, whilst July, September and October were in the 60% region. The highest
average rainfall decile was recorded in the month of November 2019.
Figure 16 Monthly rainfall deciles in the Murray–Darling Basin for June to November 2019 (BOM 2019).
17Figure 17 depicts the rainfall anomalies across the Murray-Darling Basin, illuminating the cumulative effect of the lower
rainfalls in the east of the Basin along the Great Dividing Range and Victorian Tributaries. The figure also highlights the
average rainfall anomaly (-100mm to 100 mm) occurring in the south western part of the basin for the corresponding 12
month period.
Figure 17 Murray-Darling Basin (MDB) rainfall anomalies (Dec 2018 to Nov 2019) (BOM, 2019).
Monthly Inflows to the Murray-Darling Basin
The flow at the South Australian border is approximately 6.3 GL/day and will increase to around 7.5 GL/day during the
coming week (1-7 Dec 2019). It comprises:
• reduced November entitlement flow of 5.5 GL/day;
• water for the environment; and
• inter-state trade adjustments.
Due to the dry water resource conditions across the Murray-Darling Basin, South Australia is currently receiving reduced
monthly entitlement flow. During November 2019, South Australia will receive a reduced entitlement flow of 163.7 GL,
compared to the full November entitlement flow of 180 GL. It is likely that reduced entitlement flow will continue during
2019-20 unless the water resource conditions improve enough to provide South Australia with close to its full entitlement
flow. In addition to the reduced entitlement flow, South Australia will receive water for the environment. The flow over Lock
1 is approximately 2.5 GL/day and will increase to around 4 GL/day during the coming week (1-7 Dec 2019)., depending on
weather conditions and extractions (DEW 2019). Figure 18 shows the Murray system daily inflows compared to long term
average flows as of May 2019.
18Figure 18 Murray system daily inflows compared to long term average flows (excluding Menindee Lakes & Snowy Mountains
Scheme) as of May 2019 (DEW 2019).
Water Availability in the Murray-Darling Basin
Storages
Storage volumes in the northern Murray–Darling Basin continue to decline, reaching a combined volume in mid-November
of 6.7 per cent of capacity (Figure 19). This is 1.6 per cent lower than at any point during the Millennium Drought (2001–
2009). Rainfall in the Northern Basin is generally summer-dominant and the last three summers have failed to deliver any
significant inflows. If the Northern Basin experiences below average rainfall again during the 2019–20 summer, water
storages still containing water will continue to decline through water releases and evaporation. Many towns in the region
have raised their water restriction levels and are investigating alternative water sources, such as groundwater, to augment
their water supply.
Storage volumes in the Southern Basin are much higher relative to the northern volumes and have not reached the lows
seen in the Millennium Drought (Figure 19). Total storage volume was at 47 percent at the end of the winter filling season
but has now started to drop. This follows the start of the southern irrigation season and reduced inflows to the major storages
due to dry catchments and limited rain. The 2019 Southern Basin winter filling season marks the third season in a row that
did not replenish water used during the summer draw down period (October–April). The current storage levels are 11 per
cent lower than at the same time in 2018 and 40 per cent lower than November 2016.
19Figure 19 Total storage volumes in the Northern and Southern Murray-Darling Basin 31 October 2019 (BOM 2019).
4. Climate summaries and forecasts
Australia has experienced a wide range of weather extremes during 2019, driven by a variety of climate influences. The sub-
tropical ridge has been stronger and further south than usual this year. This high pressure has reduced the number of cold
fronts reaching southern Australia and weakened the ones that have made it. Adding to the dry has been a lack of tropical
moisture spilling over the continent from oceans to our north. As a result, large parts of Australia have experienced less
rainfall, clearer skies, warmer than usual days and locally frosty conditions.
204.1. Bureau of Meteorology Seasonal Climate Summary
2019
Spring 2019 in South Australia: drier than average
Rainfall in spring was below average over most of South Australia, making it the State's third-driest spring on record and
lowest spring rainfall total since 1967. Daytime temperatures in spring were warmer that average, particularly in the west,
with the state's mean maximum temperature the sixth-highest on record for spring. Night-time temperatures were generally
closer to average, though above average in the west and some areas of below average mean minimum temperatures in the
Riverland, Mid North, and South East districts.
Third driest spring on record
• Rainfall in spring was below average over most of South Australia, with only small, isolated patches of near-average
rainfall scattered across the state
• Rainfall for South Australia was 70% below average, the state's third-driest spring on record and lowest spring total
since 1967
• The highest totals were in the Mount Lofty Ranges and Lower South East district
• The pastoral districts had less than 25 mm for the season and large areas of the north had totals that were more
than 80% below average
• More than 99% of South Australia by area had below median spring rainfall, including more than half the state with
very much below average rainfall
• The state's wettest days of the season were on 20 and 21 September, with widespread totals of more than 10 mm
across the agricultural districts and 56.4 mm recorded at Ungarra on the Eyre Peninsula
Sixth warmest daytime temperature
• Days were warmer than average, especially in the west
• The mean maximum temperature was 2.46 °C warmer than average for spring
• Night-time temperatures were cooler than average in parts of the Riverland, Mid North, and South East districts
• The mean minimum temperature was 0.30 °C warmer than average for spring.
Winter in 2019: driest winter for more than a decade
Rainfall in winter was below to very much below average across most of the state, making it South Australia's tenth-driest
winter on record and driest since 2007. Daytime temperatures were warmer than average for the northern two thirds of the
state, but nights were cooler than average in many central and northern areas.
Driest winter since 2007
• Rainfall in winter was 56% below average, making it South Australia's tenth-driest winter on record and driest since
2007
• Rainfall was very much below average across large areas of the state
• All winter months of June, July, and August were drier than average
• Winter rainfall was near-average in some central and south-eastern Agricultural districts
• The very dry winter has significantly expanded the areas experiencing serious and severe rainfall deficiency from
the first five months of the year and they now cover most of the state except the far north-east and the southeast
for the January to August period
• A very dry first eight months of the year, with rainfall very much below average in most areas
• Second-driest year-to-date (January to August) on record; the driest since 1929.
Warm days and cool nights across the north
• Daytime temperatures for winter were warmer than average across the northern two thirds of South Australia
• The mean maximum temperature for South Australia as a whole was 1.06 °C above average
• Night-time temperatures were cooler than average in the Northeast and some areas of the central and western
districts, but average to warmer than average in the South East Agricultural districts
• The mean minimum temperature for South Australia as a whole was 0.45 °C below average, the lowest for winter
since 2012
• A very warm first eight months of the year, with most of the state very much warmer than average
21• South Australia's mean temperature for January to August was 1.14 °C above average; the fourth-highest on record.
Autumn in 2019: drier than average with warm days
Rainfall in autumn was below average in most areas of South Australia away from some southern coastal fringes and in the
northeast. Daytime temperatures in autumn were very much above average across large areas of the state and night-time
temperatures were near-average or warmer than average.
Drier than average in most areas
• Rainfall in autumn was 50% below average for the state as a whole
• March and April were drier than average for South Australia and May was drier than average across large areas of
the state's north
• Rainfall was below average in many eastern Agricultural districts and throughout much of the state's west
• Rainfall was near average to above average in the northeast and in some southern coastal areas
• On 1 May, Flinders Chase had its highest autumn daily rainfall on record
• A very dry first five months of the year, with rainfall very much below average in many areas
• Driest first five months of the year since 2008.
Warm days
• A very warm autumn for much of the state
• Daytime temperatures were particularly warm, with mean maximum temperatures above to very much above
average across most of the state
• The season began with a hot day on 1 March and many sites had their highest autumn temperature on record
• On 1 March, daily maximum temperatures were more than 12 °C above average across the state's south and 45.3 °C
was recorded at Nullarbor
• Later in the season on 9 May, several sites had their coldest autumn day on record
• Despite May having temperatures closer to average, the state's mean maximum temperature for autumn was fifth-
warmest on record, 1.80 °C above average
• Night-time temperatures were warmer than average though not as extreme, with the state's mean minimum
temperature 0.59 °C above average
• Mean minimum temperatures were above average in most areas, particularly in the northwest
• On 2 March, many sites had their warmest autumn night on record
• The lowest minimum temperature recorded for the month was -1.1 °C at Yunta Airstrip on 16 May
• On 30 May, Minnipa and Wudinna had their lowest autumn temperature on record
• A very warm first five months of the year, with most of the state very much warmer than average and the mean
maximum temperature for January to May highest on record.
4.2. Current status of the ENSO cycle and the Indian Ocean Dipole
(IOD)
Australia’s climate is influenced by temperature patterns in the Pacific and Indian Oceans at certain times of year, indicated
by the presence of the El Niño/Southern Oscillation (ENSO) cycle and the Indian Ocean Dipole (IOD). The Southern Oscillation
Index, or SOI, gives an indication of the development and intensity of El Niño or La Niña events in the Pacific Ocean. The El
Niño–Southern Oscillation (ENSO) is the major climate driver in the Pacific Ocean and can have a strong impact on Australia's
climate. El Niño years are typically warmer and drier over eastern Australia and La Niña years tend to be cooler and wetter
over much of the country.
A strong positive IOD (Indian Ocean Dipole) continues and is forecast to remain strong until the end of 2019. IOD events
break down when the monsoon trough transitions into the southern hemisphere, which typically occurs in early December.
However, the monsoon trough is likely to be delayed this year, likely due to the strength of the current positive IOD event.
As a result, the prolonged and widespread dry conditions experienced over much of Australia during 2019 (related to this
event) are likely to persist into December, before easing later in summer.
The El Niño–Southern Oscillation (ENSO) is currently neutral. The latest outlooks from the surveyed models suggest that an
ENSO-neutral state is the most likely scenario for the remainder of 2019 and the first quarter of 2020.
22In the tropical Pacific Ocean, the El Niño–Southern Oscillation (ENSO) remains neutral, while in the Indian Ocean the strong
positive Indian Ocean Dipole (IOD) event continues. IOD values remain strongly positive but have weakened slightly over
the past fortnight. Waters are warmer than average near the Horn of Africa, and cooler than average waters persist in the
eastern Indian Ocean, south of Indonesia. International climate models surveyed by the Bureau indicate the positive IOD is
likely to be slower to decline than usual, and may persist into mid-summer. Typically, a positive IOD brings below average
rainfall to southern and central Australia with warmer days for the southern two-thirds of the country. Positive IOD events
are often associated with a more severe fire season for southeast Australia.
In the tropical Pacific Ocean, the El Niño–Southern Oscillation (ENSO) remains neutral. While tropical Pacific Ocean sea
surface temperatures are slightly warmer than average, atmospheric indicators are generally neutral. Trade winds have
recently weakened temporarily in the western Pacific region in line with severe tropical cyclone Rita. This may mean there is
some warming of surface waters in the coming few weeks. However, most climate models forecast ENSO-neutral conditions
for the rest of 2019 and into the first quarter of 2020. When ENSO is neutral, it has little effect on Australian and global
climate, meaning other influences are more likely to dominate.
4.3. Climate Outlook – Summer 2019/20
• Drier than average summer likely for eastern Australia, but wetter for parts of the west coast.
• Summer daytime temperatures are very likely to be above average across Australia.
• Summer nights very likely to be warmer than average except in the southeast.
• Climate influences—a strong positive Indian Ocean Dipole (IOD) and negative Southern Annular Mode (SAM)
continue to influence the outlook. Both influences are expected to progressively weaken, then dissipate during the
first half of the season.
Figure 20 National seasonal rainfall outlook, December 2019 to February 2020 (BOM, 2019).
23Drier than average summer likely for the east, wetter for the west coast
The outlook for December 2019 shows much of the country is forecast to be drier than average for the month, with parts of
northern Queensland and the top end of the Northern Territory most likely to be dry. Parts of the Gascoyne and Pilbara in
Western Australia have a slightly increased chance of being wetter than average. Figure 20 shows that there is around 40-
60% probability of the Lower Darling catchment receiving above average rainfall during the December 2019 to February
2020 period.
For summer as a whole (December 2019 to February 2020), the dry signal contracts to the eastern states. Conversely, much
of the western-Western Australian coastline has a slightly increased chance of above average rainfall in summer. While
outlooks for drier than average conditions may ease for some areas heading into 2020, several months of above average
rainfall would be needed to see a recovery from current long-term rainfall deficiencies (Figure 20). Figure 21 (Oct-Dec 2018)
is presented in this report as a comparison to the current forecast (Figure 20) to show the median rainfall trend over the past
year.
Figure 21 National seasonal temperature outlook, October 2018 to December 2018 (BOM, 2019).
4.4. Flow Outlook - Murray-Darling Basin 2019-20
Based on the starting water resources and other assumptions in the River Murray System Annual Operating Plan 2019-20,
the full South Australian entitlement of 1,850 GL (696 GL Dilution and Loss (conveyance) + 1,154 GL entitlement volume
from which allocations are made) is not expected in the ‘extreme dry’, ‘very dry’, ‘dry’ and ‘moderate’ scenarios. However, in
all cases the 696 GL of dilution and loss conveyance volume is delivered. However, in all cases the 696 GL of dilution and
loss conveyance volume is delivered. The diversion entitlement volume in each scenario is assumed to be:
• ‘extreme dry’ – 470 GL
24• ‘very dry’ – 600 GL
• ‘dry’ – 970 GL ‘moderate’ – 1,000 GL
• ‘near average’ – 1,154 GL (full diversion entitlement)
• ‘wet’ – 1,154 GL (full diversion entitlement)
Figure 22 Flow to South Australia outlook.
Figure 22 shows that across all scenarios, anticipated June and July monthly flows are higher than base entitlement flow as
environmental water is delivered in addition to full monthly entitlement. Beyond July, in the ‘extreme dry’ to ‘moderate’
scenario, it is assumed that South Australia does not take full monthly entitlement. The reduction in entitlement increases
with reduced inflow scenario.
Despite below entitlement in the ‘very dry’ to ‘moderate’ cases, during late winter and spring flow across the border is
expected to be greater than normal entitlement due to delivery of environmental return flows from upstream environmental
watering actions. The delivery of this water will help to provide mitigation against the environmental impacts that would
otherwise result from the expected reduction in entitlement flows, particularly under the drier case scenarios. In this outlook,
unregulated flow is assumed in the ‘near average’ case with prolonged periods of unregulated flows possible in the ‘wet’
case. Unregulated flow to South Australia is highly dependent on the timing of upstream inflow events and may occur in any
scenario, even in the drier cases. In the drier scenarios there is less opportunity to deliver large volumes of environmental
water to South Australia due to overall reduced water availability.
Flow outlook
Report # 46/2019 as at 29 November 2019
The flow at the South Australian border is approximately 6.3 GL/day and will increase to around 7.5 GL/day during the
coming week. It comprises:
25• reduced November entitlement flow of 5.5 GL/day;
• water for the environment
• inter-state trade adjustments.
Due to the dry water resource conditions across the Murray-Darling Basin, South Australia is currently receiving reduced
monthly entitlement flow. During November 2019, South Australia will receive a reduced entitlement flow of 163.7 GL,
compared to the full November entitlement flow of 180 GL. It is likely that reduced entitlement flow will continue during
2019-20 unless the water resource conditions improve enough to provide South Australia with close to its full entitlement
flow. In addition to the reduced entitlement flow, South Australia will receive water for the environment. The flow over Lock
1 is approximately 2.5 GL/day and will increase to around 4 GL/day during the coming week, depending on weather
conditions and extractions. It is important to note that flow forecasts in this advice are based on the information available
at the time of preparation. Advice may change as new gauging information becomes available, or due to rainfall events or
changed operations upstream.
Environmental water
Water for the environment is being used in the River Murray to promote conditions that favour native plants and animals.
In South Australia, this water is being used to:
• maintain flowing water habitat in the River Murray channel to benefit native fish, animals and plants that have
adapted to a riverine environment;
• enhance productivity and deliver food resources from upstream and wetlands to support native fish in the River
Murray channel, including golden perch and Murray cod;
• provide for barrage releases to the Coorong to support a productive, food-rich environment for fish and birds;
• maintain good connections from the Coorong to the upstream areas of the River Murray, and its tributaries, to
enable fish movement and migration;
• improve salinity and water quality in the River Murray channel, Lower Lakes and Coorong; and
• deliver a range of outcomes to wetlands in the Riverland via arrangements with South Australian Murray-Darling
Basin Natural Resource Management Board, Renmark Irrigation Trust and Nature Foundation South Australia.
5. Landscape condition
5.1. Vegetation monitoring products derived from NOAA
satellite data
Normalised Difference Vegetation Index (NDVI) products are produced by the Bureau of Meteorology for the Australian
region using measurements from the Advanced Very High Resolution Radiometer (AVHRR) on board the USA's NOAA polar
orbiting meteorological satellites.
The differential reflectances in selected bands provide a means of monitoring density and vigour of green vegetation growth
using the spectral reflectivity of solar radiation. Green leaves commonly have larger reflectances in the near infrared than in
the visible range. As the leaves come under water stress, become diseased or die back, they become more yellow and reflect
significantly less in the near infrared range. Clouds, water, and snow have larger reflectances in the visible than in the near
infrared, while the difference is almost zero for rock and bare soil. Vegetation NDVI typically ranges from 0.1 up to 0.6, with
higher values associated with greater density and greenness of the plant canopy. Surrounding soil and rock values are close
to zero while the differential for water bodies such as rivers and dams have the opposite trend to vegetation and the index
is negative.
Figure 23 illustrates a decrease in the density and abundance of vegetation right across Australia on a continental scale. The
decrease in abundance of vegetation is mainly due to decreasing rainfalls and increasing ambient temperatures across
Australia (Figure 24).
26Figure 23 Normalised Difference Vegetation Index (NDVI) October 2019 (BOM, 2019).
Figure 24 Normalised Difference Vegetation Index (NDVI) 2016-2019 (BOM 2019).
275.2. Landscape modelling
The Australian Government operate a National Agricultural Monitoring Service (NAMS) that contains a range of climatic and
production information, initially for dry-land/broad-acre industries, for over 600 regions throughout Australia. Landscape
models are widely used to infer condition based on a range of data sources. Importantly, the interpretation of these models
requires an understanding that the values are relative not absolute. They are indicative spatial interpretations.
AussieGRASS – Spatial
This model shows relative growth percentiles across Australia, averaged over 12 months. The South Australian data is sourced
from the AussieGRASS pasture model; it considers the effects of pasture communities, climate, tree density, soil-attributes,
stock and other herbivore numbers on growth. The legend defines relative growth percentiles. The spatial distribution of the
actual growth percentiles is compared to the historical median, based on over 115 years of modelled data. Some model
inputs, such as plant available water capacity, are estimated from other data.
Figures 25-28 shows the pasture growth percentile trends relative to historical records from 1957 for a 12 month period
from 2013 -2019 in South Australia. Figure 25 shows a decreasing trend in the relative pasture growth over a two 12 month
periods from December 2017 (left) to November 2019 (right). The latest pasture growth percentile for the November 2018
to November 2019 (Fig. 25) shows that almost 70% of South Australia was found to have extremely low pasture growth and
with the coming drier and hotter summer, further decline is expected. The December 2018 to November 2019 (Figure 25 –
right) is the worst on record since 2013. Figures 26-28 also show the various trends in pasture growth over a 4 year period.
Figure 25 SA pasture growth relative to historical records from 1957 for Dec 2017 to Nov 2018 (left) & Dec 2018 to Nov
2019 (right).
28Figure 26 SA pasture growth relative to historical records from 1957 for Feb 2018 (left) & Dec 2016 to Nov 2017 (right).
Figure 27 SA pasture biomass relative to historical records from 1957, Dec 2015 to Nov 2016 (left) & Dec 2016 to Nov 2017
(right).
29Figure 28 SA pasture biomass relative to historical records from 1957, Dec 2013 to Nov 2014 (left) & December 2014 to Nov
2015 (right).
Pasture Growth Rate (PGR)
The Pastures from Space program is a joint venture between the Department of Agriculture of Western Australia, Western
Australia Land Information Authority (Landgate) and the CSIRO. The program combines pasture biomass and feed on offer
estimates obtained from satellite data, with climate and soil information to produce an estimate of Pasture Growth Rate
(PGR) that can be used for regional agricultural monitoring.
2019 graph currently TBA
Figure 29 Monthly Pasture Growth Rates - Adelaide Hills, Mid Murray and Orroroo districts, 2019.
Figure 30 Monthly Pasture Growth Rates - Adelaide Hills, Mid Murray and Orroroo districts, 2018.
30You can also read