2019 Actual Costs and Intended 2021 Unit Rates of Air Navigation Services in Ireland
←
→
Page content transcription
If your browser does not render page correctly, please read the page content below
Consultation on

    2019 Actual Costs and Intended 2021 Unit Rates of
              Air Navigation Services in Ireland
under the Performance and Charging Scheme of the Single European Sky

                    Commission Paper 6/2020
                             6 July 2020

                  Commission for Aviation Regulation
                      3rd Floor, Alexandra House
                           Earlsfort Terrace
                               Dublin 2
                                Ireland
                        Tel: +353 1 6611700
                      E-mail: info@aviationreg.ie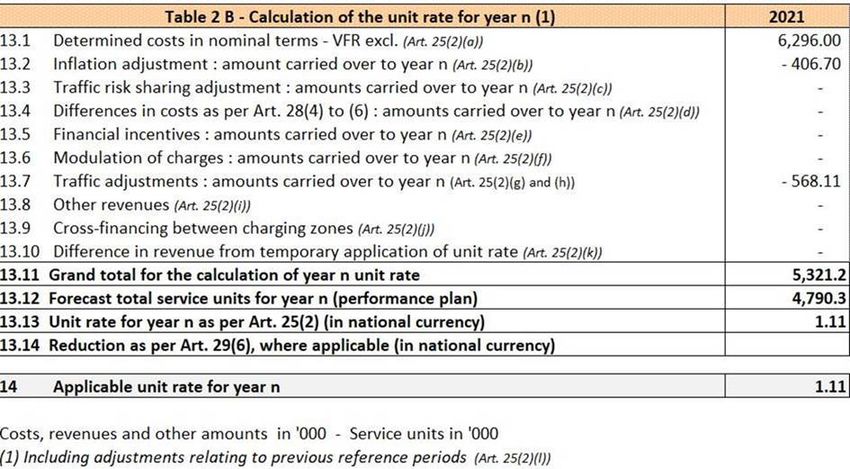
Consultation on 2019 Actual Costs and 2021 Unit Rates under the Single European Sky Charging Scheme

Table of Contents

1. About this Consultation ....................................................................................................... 3

2. Summary of Actual Costs Incurred in 2019 ......................................................................... 5

3. Summary of the Calculation of Intended 2021 Unit Rates.................................................. 7

4. Draft Report on the Cost Risk Sharing Mechanism ........................................................... 11

5. Appendix 1: IAA ANSP Consultation Document ................................................................ 13

6. Appendix 2: IAA SRD Consultation Document .................................................................. 20

7. Appendix 3: Met Éireann Consultation Document ........................................................... 36

8. Appendix 4: Tables of 2019 actual costs and 2021 unit rates ........................................... 57

Commission for Aviation Regulation                               2
Consultation on 2019 Actual Costs and 2021 Unit Rates under the Single European Sky Charging Scheme

1.      About this Consultation

        The Commission for Aviation Regulation is Ireland’s independent economic aviation
        regulator and was established in 2001.

        From 1 January 2020, we have been designated as a National Supervisory Authority
        (NSA) in Ireland for economic regulation under the performance and charging schemes
        of the Single European Sky.

        In this document, we are consulting with airspace users on three aspects required
        under Implementing Regulation (EU) 317/2019 (“the Regulation”) laying down the
        current performance and charging scheme. The three aspects that we are consulting
        airspace users on are:

           -   the actual costs incurred in 2019 associated with the provision of en route and
               terminal air navigation services in Ireland;
           -   the intended unit rates for 2021 of en route and terminal services;
           -   the costs exempt from the cost risk sharing mechanism for reference period 2
               (RP2) for 2015-2019 that will be returned to users in 2021.

        The consultation consists of two steps. First, we are inviting airspace users, or
        their representatives, to attend a video conference meeting on 20 July 2020 from
        10:00 – 12:30. At this meeting, we will summarise the contents of Sections 2 to
        4 of this document, and the following parties will give a presentation of their 2019
        actual costs and intended 2021 unit rates:

           -   The Irish Aviation Authority - Air Navigation Service Provider (IAA ANSP),
           -   The Irish Aviation Authority - Safety Regulation Division (IAA SRD)1, and
           -   The Irish Meteorological Service (Met Éireann - Aviation Services).

        Second, we are seeking written feedback from airspace users in relation to the 2019
        actual costs, intended 2021 unit rates and/or RP2 costs exempt by 31 July 2020. 2
        Written feedback should be sent to info@aviationreg.ie. We may correspond with
        airspace users who make submissions, seeking clarification or explanation of their
        submissions.

        Respondents should be aware that we are subject to the provisions of the Freedom of
        Information legislation. Ordinarily we place all submissions received on our website.3
        If a submission contains confidential material, it should be clearly marked as

1
 The Safety Regulation Division of the Irish Aviation Authority (IAA SRD) was the NSA for economic regulation up
to 2019 and remains as the NSA for all other non-economic regulatory and oversight tasks under the performance
scheme. Therefore, the IAA SRD costs are the relevant NSA costs for this annual consultation.
2
  The Regulation requires we consult airspace users on the intended 2021 unit rates before 1 August 2020 and
on the RP2 costs exempt before 1 September 2020 with information circulated to airspace users at least three
weeks beforehand.
3
  While we endeavour to ensure that information on our website is up to date and accurate, we accept no
responsibility in relation to the accuracy or completeness of our website and expressly exclude any warranty or
representations as to its accuracy or completeness.

Commission for Aviation Regulation                     3
Consultation on 2019 Actual Costs and 2021 Unit Rates under the Single European Sky Charging Scheme

        confidential and a redacted version suitable for publication should also be provided.

        We do not ordinarily edit submissions. Any party making a submission has sole
        responsibility for its contents and indemnifies us in relation to any loss or damage of
        whatever nature and howsoever arising suffered by us as a result of publishing or
        disseminating the information contained within the submission.

        We will use the feedback received from airspace users to:

          -    inform our thinking on advice to the European Commission about the outcome
               of the consultation.
          -    finalise the report on the costs exempt for RP2 before 1 September 2020 and,
          -    update, if needed, the 2021 unit rates before 1 November 2020.

        We must finalise the unit rates by 20 December 2020, after the rates have been verified
        by the European Commission.

        The European Commission is in the process of addressing the impact of the COVID-19
        crisis on air navigation service provision, including revisions to the performance and
        charging scheme implementation in RP3. Once clarity is available on any revisions to
        RP3 we will engage with airspace users on the next steps.

        In preparing this consultation, we:

          -    obtained from all relevant parties the actual 2019 detail cost data necessary for
               ensuring the proper implementation and oversight of this Regulation.
          -    assessed whether the 2019 actual costs where below the determined costs in the
               reference period 2 (RP2) plan.
          -    verified the correct calculation of the intended 2021 unit rates for all parties
               based on the determined costs in the draft RP3 plan and the adjustments carried
               over from 2019.
          -    verified the correct application of the cost risk sharing mechanism during RP2.
          -    submitted, on behalf of Ireland, the 2019 actual costs, intended 2021 unit rates
               and RP2 costs exempt from the risk sharing mechanism to the European
               Commission before the deadline of 1 June 2020 as per the Regulation, including
               the information in Annex VII and Annex IX that is consulted in this paper.

        This document is organised as follows. We consult on 2019 actual costs in Section 2,
        on intended 2021 unit rates in Section 3 and on the draft report on the cost risk sharing
        mechanism in Section 4. Appendices 1, 2 and 3 present the consultation documents of
        the IAA ANSP, IAA SRD and Met Éireann. Appendix 4 shows the relevant tables as per
        the Annexes VII and IX of the Regulation.

        Along with this document, we are sending airspace users the presentation slides
        that will be used at the video conference meeting to be held on 20 July 2020.

Commission for Aviation Regulation                  4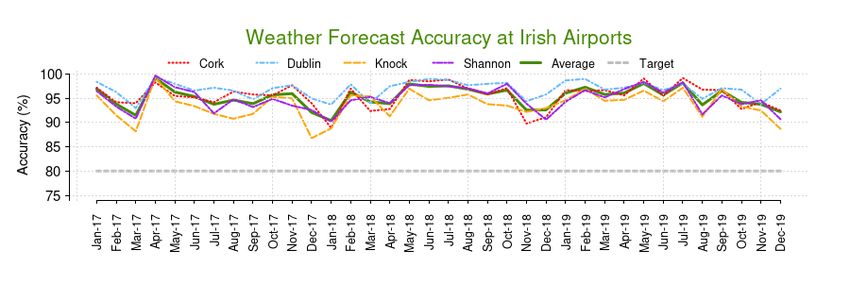
Consultation on 2019 Actual Costs and 2021 Unit Rates under the Single European Sky Charging Scheme

2.        Summary of Actual Costs Incurred in 2019

          In this section we consult on the actual costs of air navigation services incurred in 2019
          and the difference between the actual and the determined costs contained in the RP2
          performance plan. 4 This is required under Article 24 (3) of the Regulation.

          We have verified the eligibility of the cost categories included for en route and terminal
          services. En route services cover air navigation in the Shannon Flight Information and
          Upper Information Regions (FIR/UIR) and exclude the Shanwick Oceanic airspace.
          Terminal services cover air navigation during approach, landing, take-off and
          departure provided at Dublin, Cork and Shannon airports. We verified the costs wholly
          allocated to en route and terminal services as well as the percentages used by the IAA
          ANSP and SRD to allocate joint costs. We also verified the cost allocation used by Met
          Éireann.

          In real terms (2009 prices), the total actual costs in 2019 were 7.5% lower for en route
          services and 5.5% lower for terminal services than the determined costs in the RP2
          plan.5 Actual unit costs were below the determined unit costs by 15% for en route and
          21% for terminal. Below, we show the en route and terminal costs by entity.

En route Costs

          In real terms, total en route costs in 2019 were €109.9m, which is €8.8m below the
          RP2 determined costs of €118.8m. The actual ANSP costs (€91.5m) represent 83% of
          the total actual costs and were 9.7% lower than determined costs. Met Éireann
          actual costs (€6.4m) represent 6% of total actual costs and were 5% lower than
          determined costs. The actual NSA costs (€12.1m) represent 11% of the total actual
          costs and were 12% (€1.3m) higher than determined costs due to higher staff and
          operating costs. As per the cost risk sharing mechanism discussed in Section 4,
          Member States shall cover the difference if actual NSA costs are above determined
          costs over the whole period. Chart 2.1 shows the total actual and determined real
          en route costs for each party in 2019.

          Actual 2019 unit costs, in real terms, were €23.69, which is €4.18 lower than
          determined unit costs of €27.87. Unit costs fell partly because actual service units
          (4.6m) were 8.9% higher than the forecast service units in the RP2 plan (4.3m). Chart
          2.2 shows the real actual and determined en route unit costs for each party in 2019.

4
  Article 2 of the Regulation defines actual cost as “a cost actually incurred in a calendar year for the provision of air navigation
services which are subject to certified accounts or, in the absence of such certified accounts, subject to a final audit”.
Determined costs are the cost base for en route and terminal charges established according to the Regulation prior to the
start of each reference period, as part of the performance plans.
5
  The European Commission uses 2009 prices for comparison purposes between the RP1 and RP2 costs.

Commission for Aviation Regulation                               5
Consultation on 2019 Actual Costs and 2021 Unit Rates under the Single European Sky Charging Scheme

Chart 2.1: 2019 Actual and Determined En route Total                   Chart 2.2: 2019 Actual and Determined En route
Costs                                                                  Unit Costs
 €101.3m                                                                    €23.76
        €91.5m
                                                                                     €19.71

                          €10.8m €12.1m            €6.7m €6.4m                                     €2.54 €2.61           €1.58 €1.38

     IAA ANSP              NSA (IAA SRD)            Met Eireann                IAA ANSP           NSA (IAA SRD)          Met Eireann
                     2019-RP2        2019 actuals                                             2019-RP2      2019 actuals

          Source: Reported costs in real terms (2009 prices) based on audited financial data from ANSP, IAA SRD and Met Éireann.

Terminal Costs

          In real terms, total terminal costs in 2019 were €25m which is €3m lower than the RP2
          determined costs of €28m. The actual ANSP costs (€22.6m) represent 90% of the total
          actual costs and were 11% lower than the determined costs. The actual costs of Met
          Éireann (€1.7m) represent 7% of total actual costs and were 10% lower than
          determined costs. The actual NSA costs (€0.8m) represent 3% of the terminal costs and
          were €0.1m higher than the determined costs due to higher staff and operating costs.
          Member States shall cover the difference if actual NSA costs are above determined
          costs over the whole period. Chart 2.3 shows the real actual and determined terminal
          total costs for each party in 2019.

          Actual 2019 unit costs, in real terms, (€128.08) were 21% lower than the RP2 plan
          (€162.16). The reduction in actual terminal unit costs is partly due to the 19.6%
          increase in actual terminal service units compared to the forecast. Chart 2.4 shows the
          real actual and determined terminal unit costs for each party in 2019.

Chart 2.3: 2019 actual and determined terminal total                   Chart 2.4: 2019 actual and determined terminal unit
costs                                                                  costs

 €25.4m
          €22.6m                                                        €147.30
                                                                                 €115.53

                         €0.7m €0.8m             €1.8m €1.7m                                    €4.15 €4.05         €10.71 €8.51

    IAA ANSP             NSA (IAA SRD)             Met Eireann              IAA ANSP           NSA (IAA SRD)          Met Eireann

                    2019-RP2        2019 actuals                                         2019-RP2        2019 actuals

          Source: Reported costs in real terms (2009 prices) based on audited financial data from ANSP, IAA SRD and Met Éireann

          For details on the cost categories of en route and terminal services of each party (such
          as staff costs, other operating costs, depreciation, cost of capital and cost of
          supervision) see the consultation documents and tables in the Appendices of this
          document.

Commission for Aviation Regulation                                 6
Consultation on 2019 Actual Costs and 2021 Unit Rates under the Single European Sky Charging Scheme
3. Summary of the Calculation of Intended 2021 Unit Rates
In this section we consult on the intended 2021 unit rates. This is required under Article
30 of the Regulation.
En route
The intended 2021 unit rate for en route services is €27.58. This rate is €3.38 lower
per unit than the draft RP3 plan, due to the application of the rate adjustments set out
in the Regulation which reduce the nominal determined costs by €16.2m. Below we
explain the calculation of the unit rate.
Row 8 of Table 3.1 shows that the total costs applicable for the en route unit rate
calculation are €132.1m after adjustments. They are 11% lower than the determined
costs in the RP3 plan as shown in Row 1 (€148.3m). Rows 2 to 7 show the applicable
adjustments. The first three adjustments in Rows 2-4 explain 96.5% of the reduction in
the intended en route rate. We explain the calculation of all the adjustments below.
Table 3.1: Applicable En route Unit Rate for 2021
Total ANSP NSA MET
(SRD)
1 Determined costs in nominal terms – Visual Flight €148.3m €125.m €17.m €6.3m
Rules (VFR) flights excluded (Art. 25(2)(a))
2 Inflation adjustment: amount carried over to 2021 -€7.2m -€6.1m -€0.7m -€0.4m
(Art. 25(2)(b))
3 Traffic risk sharing adjustment: amounts carried -€5.4m -€5.4m
over to 2021 (Art. 25(2)(c))
4 Differences in costs as per Art. 28(4) to (6): -€3.1m -€3.1m
amounts carried over to 2021 (Art. 25(2)(d))
5 Financial incentives: amounts carried over to 2021 €1.1m €1.1m
(Art. 25(2)(e))
6 Traffic adjustments: amounts carried over to 2021 -€0.8m €0.7m -€0.9m -€0.6m
(Art. 25(2)(g) and (h))
7 Other revenues (Art. 25(2)(i)) -€0.8m -€0.8m
8 Total for the calculation of 2021 unit rate €132.1m €114.4m €12.3m €5.3m
9 Forecast total service units for 2021 (performance €4.8m
plan)
10 Applicable unit rate for 2021 €27.58 €23.89 €2.58 €1.11
11 Unit rate before adjustments €30.96 €26.09 €3.55 €1.31
Source: Reported en route tables based on costs as per audited financial data from ANSP, IAA SRD and Met Éireann.
The inflation adjustment carried over from 2019 (Row 2).
- 2019 Actual inflation (0.9%) is lower than forecast inflation (1.7%) in the RP2
plan. The inflation adjustment applies to the 2019 total en route determined
costs in nominal terms for all parties which are €130.9m. Those costs are shown
in Row 1.6 of Table 8.1 in Appendix 4. The adjustment is calculated using the
price index used in the RP2 plans as €130.9m x ( 104 / 110.1 -1). 6
The traffic risk sharing adjustment (Row 3).
- The actual en route traffic growth in 2019 was 8.9% higher than the forecast. In
this case, the ANSP returns to users €5.4m which is equivalent to 70% of the
6
Eurostat Harmonised index of consumer prices, base 100 in 2009.
Commission for Aviation Regulation 7Consultation on 2019 Actual Costs and 2021 Unit Rates under the Single European Sky Charging Scheme
share of its nominal determined costs in 2019 (€111.6m) proportional to the
actual traffic growth above 2% and below 10% (or 70% x 6.9% x €111.6m). The
2019 nominal determined costs of the ANSP are shown in Appendix 4, Table 8.1
Row 1.6.
Differences in Eurocontrol membership costs of the NSA during RP2 (Row 4).
- The €3.1m difference between determined and actual costs of the Eurocontrol
membership from 2015-2019 will be returned to airspace users in 2021, as
detailed in Table 3.2 below.
Table 3.2: Differences in Eurocontrol costs during RP2 to be returned in 2021
2015 2016 2017 2018 2019 Total difference to
be returned in
2021
RP2 Plan €6.8m €7.1m €7.4m €7.7m €7.9m
Actual €6.6m €6.6m €6.4m €6.9m €7.4m
Difference -€0.2m -€0.5m -€1m -€0.8m -€0.5m -€3.1m
Source: RP2 Plan, Eurocontrol.
We report the Eurocontrol membership costs as required under Article 28 (3) of the
Regulation laying down the cost risk sharing mechanism. These are the only costs
exempt from the mechanism. We consult on the draft report on the cost risk sharing
mechanism in the next section.
The remaining three adjustments are:
Financial Incentive (Row 5)
- The ANSP earned a capacity bonus of 1% of its payable income in 2019 (€1.1m)
due to its achievement of zero en route Air Traffic Flow Management (ATFM)
delay per flight in the same year. This incentive was defined in the RP2 Plan.
Traffic Adjustment (Row 6)
- The traffic adjustment is the multiplication of actual traffic growth above forecast
(8.9%) times the sum of applicable costs for each party, as shown in Table 3.3.
The traffic adjustment is positive for the ANSP (€0.7m) and negative for the NSA
and Met Éireann (-€0.9m and -€0.6m). Overall, €0.8m will be returned to users
in 2021.
Table 3.3: Costs For En Route Traffic Adjustment by Entity
ANSP NSA (SRD) MET
Determined costs in 2019 after applicable n/a €10.6m €6.3m
adjustments carried over to 2019
Inflation adjustment carried over to 2019 -€4.0m n/a n/a
Traffic adjustment carried over to 2019 €0.2m n/a n/a
Traffic risk adjustment carried to 2019 -€4.8m n/a n/a
Performance bonus in 2019 €1.1m n/a n/a
Source: Reported en route tables based on costs as per audited financial data from ANSP, IAA SRD and Met Éireann.
Other Revenues (Row 7)
- Other revenues in 2021 consist of ANSP revenues of €0.2m from Union assistance
programmes and €0.6m from commercial activities, which reduce the unit rate.
Commission for Aviation Regulation 8Consultation on 2019 Actual Costs and 2021 Unit Rates under the Single European Sky Charging Scheme
Terminal
The intended 2021 unit rate for terminal services is €162.45. This rate is €27.66 lower
per unit than the draft RP3 plan, due to the application of the adjustments set out in
the Regulation which reduce the nominal determined costs by €5.1m. Below we
explain the calculation of the unit rate.
Row F in Table 3.4 shows that the total costs applicable for the terminal unit rate
calculation are €31.8m, after adjustments. They are 14.5% lower than the determined
costs in the RP3 plan (€37.2m) shown in Row A. The adjustments are shown in Rows B-
E and explained below. The largest adjustment is the traffic risk sharing of ANSP
revenues.
Table 3.4: Applicable Terminal Unit Rate for 2021
Total ANSP NSA MET
(SRD)
A Determined costs in nominal terms - Visual Flight €37.2m €34.5m €1.1m €1.6m
Rules (VFR) flights excluded (Art. 25(2)(a))
B Inflation adjustment: amount carried over to 2021 -€1.5m -€1.4m -€39.4k -€0.1m
(Art. 25(2)(b))
C Traffic risk sharing adjustment: amounts carried -€3.9m -€3.9m
over to 2021 (Art. 25(2)(c))
D Traffic adjustments: amounts carried over to 2021 €0.3m €0.7m -€0.1m -€0.3m
(Art. 25(2)(g) and (h))
E Other revenues (Art. 25(2)(i)) -€0.3m -€0.3m
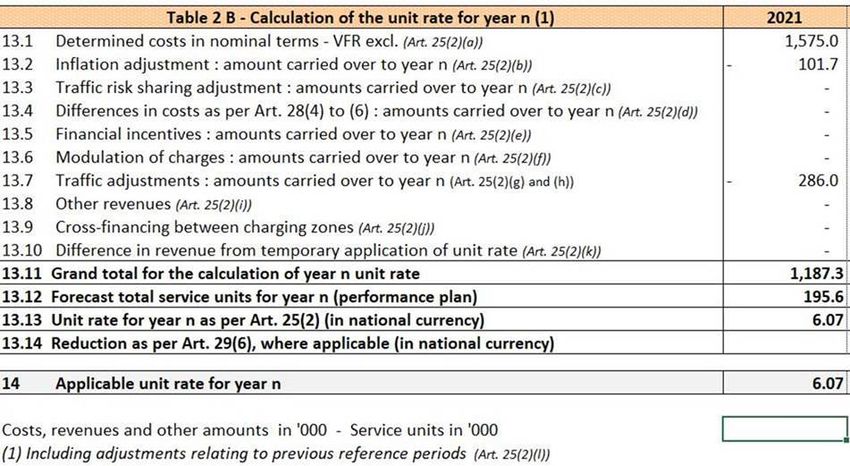
F Total for the calculation of 2021 unit rate €31.8m €29.6m €1.m €1.2m
G Forecast total service units for 2021 (performance 195.6k
plan)
H Applicable unit rate for 2021 €162.45 €151.40 €4.98 €6.07
I Unit rate before adjustments €190.11 €176.28 €5.78 €8.06
Source: Reported terminal tables based on costs as per audited financial data from ANSP, IAA SRD and Met Éireann.
Inflation adjustment (Row B)
The inflation adjustment results from actual 2019 inflation (0.9%) being lower than
forecast inflation (1.7%) in the RP2 plan. The inflation adjustment applies to the 2019
total terminal determined costs in nominal terms for all parties which are €28m. Those
costs are shown in Row 1.6 of Table 8.2 in Appendix 4. It is calculated using the price
index used in the RP2 plans as €28m x ( 104 / 110.1 -1).
Traffic risk sharing adjustment (Row C)
The actual terminal traffic growth in 2019 was 19.6% higher than forecast. In this case,
the ANSP returns to users €3.9m which is equivalent to 70% of the share of its nominal
determined costs in 2019 proportional to the actual traffic growth above 2% but below
10% plus 100% of the share of determined costs proportional to the growth above
10%. That is (70% x 8% x €25.4m) + (9.6% x €25.4m). The 2019 nominal determined
costs of the ANSP are shown in Appendix 4, Table 8.2, Row 1.6.
Traffic adjustment (Row D)
The traffic adjustment is the multiplication of actual traffic growth above forecast
(19.6%) times the sum of applicable costs for each party, as shown in Table 3.5. It is
positive for the ANSP (€0.7m) and negative for the NSA (-€0.1m) and Met Éireann (-
€0.3m). Overall, €0.3m is added to Row F.
Commission for Aviation Regulation 9Consultation on 2019 Actual Costs and 2021 Unit Rates under the Single European Sky Charging Scheme
Table 3.5: Costs for Traffic Adjustment of Terminal Costs by Entity
ANSP NSA (SRD) MET
Determined costs in 2019 after adjustments n/a €0.6m €1.4m
Inflation adjustment carried over to 2019 -€0.9m n/a n/a
Traffic adjustment carried over to 2019 €0.2m n/a n/a
Traffic risk adjustment carried to 2019 -€2.7m n/a n/a
Source: Reported terminal tables based on costs as per audited financial data from ANSP, IAA SRD and Met Éireann.
Other Revenues (Row B)
Other revenues in 2021 consist of ANSP revenues of €66,000 from national public
funding and €0.2m from commercial activities, which reduce the unit rate.
For details on the intended 2021 unit rates of each party see the Appendices in this
document.
Commission for Aviation Regulation 10Consultation on 2019 Actual Costs and 2021 Unit Rates under the Single European Sky Charging Scheme
4. Draft Report on the Cost Risk Sharing Mechanism
In this section, we are consulting airspace users on our draft report on the cost risk
sharing mechanism. Under Article 28 (7) of the Regulation, we shall draw up a report
by 1 September 2020 on the changes in costs exempt from this mechanism during RP2
(2015-2019). In the previous section, we showed that the change in these costs reduce
the 2021 unit rate.
In this draft report we verify the correct application of the provisions of Article 28 by:
- Identifying and categorising the determined costs in the RP2 plan relating to the
costs that are exempt from the cost risk sharing mechanism.
- Identifying and explaining the differences between determined and actual costs
exempt from the mechanism during RP2 which affect the 2021 unit rate.
The Cost Risk Sharing Mechanism
Under the cost risk sharing mechanism, differences between determined costs
included in the performance plan and actual costs shall be shared between air
navigation service providers and airspace users as follows:
- where, over the whole reference period, actual costs fall below the determined
costs, the air navigation service provider or the Member State concerned shall
retain in full the resulting difference.
- where, over the whole reference period, actual costs exceed the determined
costs, the air navigation service provider or Member State concerned shall cover
in full the resulting difference.
Costs Exempt from the Cost Risk Sharing Mechanism
The cost risk sharing mechanism does not apply if the differences between determined
and actual costs result from at least one of the following unforeseen changes in costs
defined in the Regulation:
- costs of new and existing investments (this will apply starting from 2020 actual
costs).
- costs incurred by National Supervisory Authorities or stemming from the
Eurocontrol International Convention relating to cooperation for the safety of air
navigation, as per Article 22(1).
- pension costs established in accordance with Article 22(4).
- interest rates on loans that finance the provision of air navigation services, which
are out of the control of the ANSP.
- costs required by law, for example taxation law.
We confirm that the only determined costs identified and categorised in the RP2 plan
relating to the costs exempt from the cost risk sharing mechanism are the Eurocontrol
membership costs as defined in Article 22 (1) of the Regulation.
Commission for Aviation Regulation 11Consultation on 2019 Actual Costs and 2021 Unit Rates under the Single European Sky Charging Scheme
Differences between Determined and Actual Costs Exempt
The determined costs approved in the RP2 plan for 2015-2019 were based on the
budget estimated by Eurocontrol. Actual costs were then calculated by Eurocontrol
based on the international agreement in place. The variance between determined and
actual costs is due to changes in the Eurocontrol budget.
There is a €3.1m difference between determined and actual costs of the Eurocontrol
membership from 2015-2019, as detailed in Table 4.1 below.
Table 4.1: Differences in Eurocontrol costs during RP2 to be returned in 2021
Eurocontrol 2015 2016 2017 2018 2019 Total difference to
costs be returned in
2021
RP2 Plan €6.8m €7.1m €7.4m €7.7m €7.9m
Actual €6.6m €6.6m €6.4m €6.9m €7.4m
Difference -€0.2m -€0.5m -€1m -€0.8m -€0.5m -€3.1m
Source: RP2 Plan, Eurocontrol.
This amount will be returned to airspace users as a reduced 2021 en route unit rate.
The cost difference in RP2 is returned to airspace users in RP3 as required under Article
14(2)(d) of Regulation 391/2013 laying down the RP2 performance and charging
scheme. During RP3, the differences in the costs exempt will be returned to users two
years later (n+2) rather than in RP4, as per Article 28 (4) of Regulation 317/2019.
Commission for Aviation Regulation 12Consultation on 2019 Actual Costs and 2021 Unit Rates under the Single European Sky Charging Scheme 5. Appendix 1: IAA ANSP Consultation Document Commission for Aviation Regulation 13
Consultation Document on En Route and
Terminal Unit Rates in 2019 and 2021

22nd June 2020
Published by the Air Navigation Service Provider of the Irish Aviation Authority

                                              14
Contents
1. Introduction ....................................................................................................................................... 3
2. En Route Traffic in 2019 – Total Service Units (TSU) ......................................................................... 3
3. Key Milestones in 2019 ...................................................................................................................... 3
4. En Route Unit Rate 2019 .................................................................................................................... 4
5. En Route Costs in 2019....................................................................................................................... 5
6. Impact on En Route Unit Rate in 2021 ............................................................................................... 5
7. Terminal Traffic in 2019 – Total Service Units (TSU) .......................................................................... 6
8. Terminal Costs in 2019 ....................................................................................................................... 6
9. Impact on Terminal Unit Rate in 2021 ............................................................................................... 6
Figures
Figure 1 Planned v Actual Traffic 2014-2019 .......................................................................................... 3
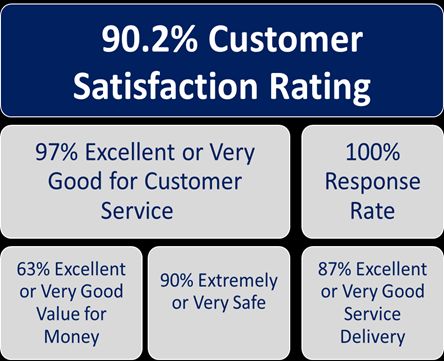
Figure 2 2019 Customer Survey Headlines ............................................................................................. 4
Figure 3 EUROCONTROL En Route Unit Rates 2019 ............................................................................... 4
Figure 4 En Route Unit Costs 2015-2019 ................................................................................................ 5
Figure 5 Terminal Determined v Actual Traffic in 2019 (Service Units) .................................................. 6
2
151. Introduction
This consultation document has been prepared in line with Articles 24(3) and 30(1) of
European Commission Implementing Regulation 317/2019 (‘the Regulation’). With respect to
the costs of the Irish Aviation Authority’s Air Navigation Service Provider (‘ANSP’), it sets out
the relevant actual en route and terminal costs in 2019 compared to what was planned in the
second reference period 2015-2019 (RP2). This document also specifies the respective
technical adjustments that impact the planned ANSP component of the Unit Rate in 2021, in
line with the Regulation.
2. En Route Traffic in 2019 – Total Service Units (TSU)
In 2019, traffic increased by 2.0%. The RP2 Plan envisaged traffic growth by 1.8%, albeit from
a lower base. Traffic was 8.8% higher than planned in 2019. The RP2 Plan envisaged 8.7%
growth (i.e. 4,262 in 2019 compared to 3,922 in 2014). Actual traffic increased by 18.3% over
the period 2014-2019. The original RP3 forecasts (Feb 2019) maintained a relatively
consistent rate of growth to 2021.
Figure 1 Planned v Actual Traffic 2014-2019
3. Key Milestones in 2019
The ANSP safely handled record traffic levels in 2019. A safe and efficient air navigation
service for strong growth in traffic was possible due to appropriate investment in people and
infrastructure.
The ANSP continues to be one of the top performers in Europe with almost zero ANSP
attributable En Route and Terminal Air Traffic Flow Management (ATFM) delays in 2019. In
3
16addition, the ANSP also met its safety, capacity, environment and cost efficiency SES targets
for 2019.
Significant procedural changes in Irish airspace were initiated in 2019 to facilitate reduced
fuel burn and emissions for aircraft in Shanwick airspace. Cross border arrival management
(XMAN) to London Gatwick was expanded by extending the streaming of aircraft in Irish
airspace, thereby reducing holding times and cutting fuel burn and emissions for aircraft
arrivals to that airport.
Figure 2 2019 Customer Survey Headlines
4. En Route Unit Rate 2019
Ireland’s En Route Unit Rate in 2019 was €28.12 (seventh lowest in the EUROCONTROL area)
compared to €27.69 in 2018, representing an increase of 1.6%. The ANSP component of the
En Route Unit Rate was €24.12, representing 85.8% of the overall rate.
Figure 3 EUROCONTROL En Route Unit Rates 2019
4
17In real terms (2009 prices), the planned En Route unit cost for 2019 was €27.87 while the
actual En Route unit cost in real terms (2009 prices) was €23.69. In real terms (2009 prices),
the actual ANSP component of the En Route unit cost for 2019 was €19.71.
Figure 4 En Route Unit Costs 2015-2019
5. En Route Costs in 2019
Actual En Route ANSP Costs amounted to €95.3m in 2019 compared to determined costs of
€111.6m. Staff costs were €7.3m lower than what was determined for 2019. Other operating
costs were €2.8m lower than what was determined for 2019. Depreciation and the cost of
capital were €4.7m and €1.5m lower than what was determined for 2019 respectively.
6. Impact on En Route Unit Rate in 2021
Total ANSP Costs amount to almost €125m in 2021, up 6.6% on 2020. Following the relevant
adjustments, the unit rate is calculated based on a total of €114.4m. The planned En Route
unit cost for the ANSP in 2021 is €23.89 (nominal). This reflects €5.4m returned to airspace
users as a result of traffic risk sharing in 2019. It also reflects €6.1m returned to airspace users
as a result of the inflation adjustment. The 2021 unit rate is adjusted to reflect a financial
incentive of €1.1m realised in 2019. A further adjustment, €0.8m returned, is made to reflect
Union assistance and commercial revenue.
5
187. Terminal Traffic in 2019 – Total Service Units (TSU)
In 2019, actual terminal traffic was 187,709 TSU, which was 19.6% higher than planned.
Figure 5 Terminal Determined v Actual Traffic in 2019 (Service Units)
8. Terminal Costs in 2019
Actual Terminal ANSP Costs amounted to €22.56m in 2019 compared to determined costs of
€25.44m. This represents an 11% reduction on actual versus determined. Staff costs were
€2.35m lower than what was determined in 2019. This represents a 19% reduction on actual
compared to determined. Other operating costs were €2.57m higher than what was
determined in 2019 which equates to a 49% increase on determined costs. Depreciation and
the cost of capital were €2.41m and €0.68m lower than what was determined in the Plan for
2019 respectively.
9. Impact on Terminal Unit Rate in 2021
ANSP Costs amount to €34.48m in 2021, up 14.5% on 2020. Following the relevant
adjustments, the unit rate is calculated based on a total of €29.61m. The planned Terminal
unit cost for the ANSP in 2021 is €151.40 (nominal). This reflects €3.9m returned to airspace
users as a result of traffic risk sharing in 2019 (€19.82 rate reduction). This also reflects €1.4m
returned to airspace users as a result of the inflation adjustment (€7.15 rate reduction). A
further adjustment, €0.3m returned (€1.40 rate reduction), is made to reflect Union
assistance and commercial revenue.
6
19Consultation on 2019 Actual Costs and 2021 Unit Rates under the Single European Sky Charging Scheme 6. Appendix 2: IAA SRD Consultation Document Commission for Aviation Regulation 20 13
Consultation Slides on State/NSA En Route Unit Rate in 2019 and 2021
This presentation provides an overview of the State/NSA component of both the en route unit rate in place in 2019 and
summarises the relevant technical adjustments for the planned unit rates in 2021.
The State/NSA component of the ENR unit rate includes NSA costs, Other State costs and EUROCONTROL costs (Slides 2-4)
The following technical adjustments are detailed as follows in the context of the RP2 Plan:
Inflation Adjustment (Slide 5)
Traffic Adjustment (Slide 6)
Costs Exempt (Slide 7)
Other relevant components of the unit rates are detailed including the EUROCONTROL costs (Slide 7)
An overview of the NSA component of the en route unit rate in 2021 is provided (Slide 8)
21
1Consultation Slides on State/NSA Unit Rate in 2019 and 2021
Total State/NSA Costs (€12.58m nominal) remained largely unchanged in 2019 compared to 2018 as an
increase in staff costs was offset by a reduction in other operating costs.
In real terms, total costs reduced by 0.9% year-on-year to €12.09m in 2019.
In nominal terms, staff costs increased by 7.3%, from €1.62m to €1.74m in 2019.
In nominal terms, other operating costs reduced by 1.1% from €10.87m to €10.75m in 2019.
Supervisory costs accounted for 13% of total costs in 2019 and reduced on 2018 by 1.5% to €1.65m
Other State costs accounted for 86.9% of total costs in 2019 and increased on 2018 by 0.2% to €10.93m
22
2Consultation Slides on State/NSA Unit Rate in 2019 and 2021
State/NSA Actual Costs in Nominal Terms (2015-2019)
12,582
11,697 12,579
11,021
10,670 10,927
10,904
10,085
9,120 9,295
1,550 1,726 1,612 1,678 1,652
2015 2016 2017 2018 2019
Supervision Other State 23
Total 3Consultation Slides on State/NSA Unit Rate in 2019 and 2021
State/NSA Unit Cost (real)
2.68
2.61
2.56
2.49
2.42
2015 2016 2017 24 2018 2019
4Consultation Slides on State/NSA Unit Rate in 2019 and 2021
State/NSA inflation adjustment to en route unit rate in 2021
RP2 Forecast Inflation versus Actual Inflation €0.14 Inflation Adjustment
€0.20 TRS Adjustment
€0.64
2015 2016 2017 2018 2019 ECTRL Adjustment
Actual Inflation 0.0% -0.2% 0.3% 0.7% 0.9%
RP2 Price Index (F) 103.7 105.0 106.4 108.2 110.1 €2.58
Residual
Component of
State/NSA Rate
RP2 Price Index (A) 102.3 102.1 102.4 103.1 104.0
• Cumulative inflation in 2019 was below what had been forecast in the RP2 Plan
• This will result in an adjustment of €0.65m in 2021
• The State/NSA inflation adjustment in 2021 (based on 2019 outturn) will result in a €0.14 reduction in the 2021 unit
rate (nominal terms)
25
5Consultation Slides on State/NSA Unit Rate in 2019 and 2021
State/NSA traffic sharing adjustment to en route unit rate in 2019
€0.14 Inflation Adjustment
€0.20 TRS Adjustment
Traffic in 2019 (total service units) was 8.9% higher than planned
€0.64 ECTRL Adjustment
Specific to the State/NSA component of the en route unit rate,
there was an over recovery of €0.94m in 2019 as a result of traffic
being higher than planned
€2.58
Residual
Component of
This will be returned to airspace users in 2021 and will result in a State/NSA Rate
€0.20 reduction in the 2021 en route unit rate (nominal terms)
26
6Consultation Slides on State/NSA Unit Rate in 2019 and 2021
€0.14 Inflation Adjustment
Costs exempted from the cost sharing arrangements €0.20 TRS Adjustment
€0.64
Other operating costs in 2019: €0.468m ECTRL Adjustment
This corresponds to the variation in EUROCONTROL costs
€2.58
2015-2019 to be returned to airspace users in 2021 (€3.1m in total) Residual
Component of
State/NSA Rate
EUROCONTROL Costs
2015 2016 2017 2018 2019
EUROCONTROL Determined (€'000) 6,836 7,148 7,411 7,653 7,900
EUROCONTROL Actual (€'000) 6,583 6,569 6,425 6,875 7,432
Difference -253 -579 -986 -778 -468
EUROCONTROL accounted for 67%/ €1.74 of the €2.61 State/NSA component of the en route unit rate in 2019
27
7Consultation Slides on State/NSA Unit Rate in 2019 and 2021
State/NSA component of En Route Unit Rate in 2021
Total Costs in Real Terms: €17.0m (Staff €2.77m / Other Operating Costs €14.24m)
Traffic (service units) for 2021 based on STATFOR Feb 2019: 4,790,288
State/NSA component of En Route Unit Rate in 2021: €2.58 (down 22% on 2020)
Cost increases in RP3 period reflect increased headcount to take account of current and anticipated
Regulatory oversight requirements
Reduction in State/NSA component of En Route Unit Rate in 2021 driven by EUROCONTROL adjustment
(€3.1m returned to airspace users covering the period 2015-2019)
28
8Consultation Slides on State/NSA En Route Unit Rate in 2019 and 2021
Questions for IAA NSA on Actual 2019 costs versus Planned 2019 costs?
Questions for IAA NSA on technical adjustments feeding through to planned unit rate in 2021?
29
9Consultation Slides on State/NSA Terminal Unit Rate in 2019 and 2021
This presentation provides an overview of the State/NSA component of terminal unit rate in place in 2019 and
summarises the relevant technical adjustments for the planned unit rates in 2021.
The State/NSA component of the Terminal unit rate includes NSA costs and Other State costs (Slide 11)
The following technical adjustments are detailed as follows in the context of the RP2 Plan:
Inflation Adjustment (Slide 12)
Traffic Adjustment (Slide 13)
An overview of the NSA component of the terminal unit rate in 2021 is provided (Slide 14)
30
10Consultation Slides on State/NSA Unit Rate in 2019 and 2021
Total State/NSA Costs were €0.79m in 2019 down 6.3% on 2018
This decline was driven by other operating costs falling by almost 14% from €0.53m to €0.46m.
Staff costs increased by 7.1%, from €0.29m to €0.31m in 2019.
Supervisory costs accounted for 42% of total costs in 2019 and reduced on 2018 by 1.5% to €0.33m
Other State costs accounted for 86.9% of total costs in 2019 and reduced on 2018 by 9.4% to €0.46m
31
11Consultation Slides on State/NSA Unit Rate in 2019 and 2021
State/NSA inflation adjustment to terminal unit rate in 2021
€0.20 Inflation Adjustment
€0.59 TRS Adjustment
• Cumulative inflation in 2019 was below what had been forecast in the RP2
Plan
• This will result in an adjustment of €0.04m in 2021
€4.98
Residual
• The State/NSA inflation adjustment in 2021 (based on 2019 outturn) will result Component of
in a €0.20 reduction in the 2021 unit rate (nominal terms) State/NSA Rate
32
12Consultation Slides on State/NSA Unit Rate in 2019 and 2021
State/NSA traffic sharing adjustment to terminal unit rate in 2019
€0.20 Inflation Adjustment
Traffic in 2019 was almost 20% higher than forecast in the Plan for RP2 €0.59 TRS Adjustment
Specific to the State/NSA component of the terminal unit rate, there
was an over recovery of €0.12m in 2019 as a result of traffic being
Residual
higher than planned €4.98
Component of
State/NSA Rate
This will be returned to airspace users in 2021 and will result in a
€0.59 reduction in the 2021 en route unit rate (nominal terms)
33
13Consultation Slides on State/NSA Unit Rate in 2019 and 2021
State/NSA component of Terminal Unit Rate in 2021
Total Costs: €1.13m split by 44% and 56% for staff and other operating costs respectively
Traffic for 2021 based on STATFOR Feb 2019: 195,600 (i.e. 4.2% higher than 2019)
State/NSA component of Terminal Unit Rate in 2021: €4.98 (down 1% on 2020)
34
14Consultation Slides on State/NSA Terminal Unit Rate in 2019 and 2021
Questions for IAA NSA on Actual 2019 costs versus Planned 2019 costs?
Questions for IAA NSA on technical adjustments feeding through to planned unit rate in 2021?
35
15Consultation on 2019 Actual Costs and 2021 Unit Rates under the Single European Sky Charging Scheme 7. Appendix 3: Met Éireann Consultation Document Commission for Aviation Regulation 36 14
SES Annual Report 2019

                     Aviation Services Division

 SES Annual Report 2019/M.11

 Document purpose:

 The purpose of this document is to report the Aviation Service Division’s activities during 2019,
 required under COMMISSION IMPLEMENTING REGULATION (EU) No 2017/373 of 1st March
 2017 laying down common requirements for providers of air traffic management/air navigation
 services and other air traffic management network functions and their oversight, repealing
 Regulation (EC) No 482/2008, Implementing Regulations (EU) No 1034/2011, (EU) No
 1035/2011 and (EU) 2016/1377 and amending Regulation (EU) No 677/2011.

 This report also comprehends the requirements detailed in Annex VII and ANNEX IX of
 COMMISSION IMPLEMENTING REGULATION (EU) 2019/317 of 11 February 2019 laying
 down a performance and charging scheme in the single European sky and repealing
 Implementing Regulations (EU) No 390/2013 and (EU) No 391/2013

 Report approved by:              Tony Tighe, Head Aviation Services

17/06/2020                                                                          page 1 of 20
                                                37
SES Annual Report 2019
SINGLE EUROPEAN SKY
ANNUAL REPORT 2019
AVIATION SERVICES DIVISION
MET ÉIREANN
Business Name Aviation Services Division,
Met Éireann
Shannon Airport
Co Clare
IRELAND
17/06/2020 page 2 of 20
38SES Annual Report 2019
Table of Contents
Chapter page
Acronyms and Abbreviations 4
1. Introduction 5
2. An assessment of the level of performance of 6
meteorological air navigation services provided
3. Explanation for variation between actual and determined cost 11
targets
4. Developments in operations and infrastructure and HR 11
policy
5. Information about the formal consultation process with 13
external stakeholders and service users
6. RP3 2021 Projections and Comment 14
17/06/2020 page 3 of 20
39SES Annual Report 2019
Acronyms and Abbreviations
ASD Aviation Services Division, Met Éireann
ATC Air Traffic Control
ATS Air Traffic Services
CAeM Commission for Aeronautical Meteorology (WMO)
CAR Commission for Aviation Regulation
HIRLAM High Resolution Limited Area Model (Numerical)
HR Human Resources
IATA International Air Transport Association
ICAO International Civil Aviation Organisation
ISO International Standards Organisation
KPI Key Performance Indicator
ManCom Management Committee of Met Éireann
MG-ASD Management Group – Aviation Services Division
NSA (SES) National Supervisory Authority
PMDS Performance Management and Development System
QMS Quality Management System
RPF Role Profile Form
SES Single European Sky
SLA Service Level Agreement
SMS Safety Management System
SyMS Security Management System
WMO World Meteorological Organisation
17/06/2020 page 4 of 20
40SES Annual Report 2019
1. Introduction
1.1 This annual performance report is prepared in compliance COMMISSION IMPLEMENTING
REGULATION (EU) No 2017/373 of 1st March 2017 laying down common requirements for
providers of air traffic management/air navigation services and other air traffic
management network functions and their oversight, repealing Regulation (EC) No
482/2008, Implementing Regulations (EU) No 1034/2011, (EU) No 1035/2011 and (EU)
2016/1377 and amending Regulation (EU) No 677/2011. This report also comprehends
the requirements detailed in Annex VII and ANNEX IX of COMMISSION IMPLEMENTING
REGULATION (EU) 2019/317 of 11 February 2019 laying down a performance and
charging scheme in the single European sky and repealing Implementing Regulations (EU)
No 390/2013 and (EU) No 391/2013. The report describes the Division’s activities in 2019
and how it performed against its annual target under the Performance Plan for RP2 2015-
2019. It is noted that only the cost efficiency target is applicable to meteorological air
navigation service providers.
1.2 MET determined costs for 2019 under RP2 are allocated 80% to enroute activities and
20% to terminal activities by the IAA in line with recommendations of the Commission for
Aviation Regulation.
1.3 In arriving at the determined costs applicable to Met Éireann, the direct costs of providing
meteorological services to civil aviation were established. These comprise the costs
incurred in the immediate provision and delivery of these services. Met Éireann’s Internal
Accounts System (IAS) recognises 10 categories of such costs: METAR reports, Reports for
ATS, Flight folders, Briefing & Consultation, TAFs, SIGMET, TREND, Aerodrome Warnings
& Enquiries, Significant Weather Charts & Tabular Winds and General expenses.
1.4 All direct services to end users, including services to aviation, also depend on the use of
Core products and services. Core costs include the costs of Surface Synoptic observations,
Upper-Air observations, Radar, Satellite, Numerical Weather Prediction (NWP),
Climatology, and ICT. A proportion of Core costs is allocated to aviation charges in line
with ICAO recommendations, World Meteorological Organisation guidelines and
EUROCONTROL charging principles. The proportion allocated depends on the use made
of Core products for aviation purposes as compared with their use for other purposes.
The methodology used in estimating core costs for the purposes of RP2 is described in the
Report of the Working Group on Met Éireann Aviation-Related Costs (2002).
1.5 Agreement was reached in 2014 with the NSA on the Cost Efficiency targets for RP2 for
the UK/Ireland FAB Performance Plan. The plan considered the impact of the AMAP
project to modernise and automate Met Éireann’s aviation observations. This project was
to be the key enabler for Met Éireann to meet EC technical and performance targets
through RP2.
1.6 The report outlines ASD’s non-financial performance targets, which are aligned with the
Divisional QMS. These include accuracy and timeliness of operational outputs along with
17/06/2020 page 5 of 20
41SES Annual Report 2019
outcomes of external audit processes such as the NSAI surveillance audits against the ISO
9001:2015 standard.
1.7 The Annual Plan for 2019 was prepared and issued in Q4 of 2018 as part of Met Éireann’s
internal business planning process and the wider Departmental Guidelines of the
Department of Housing Planning and Local Government.
1.8 The report includes a look ahead to the determined costs for 2021 as previously
submitted for approval and inclusion in the RP3 Performance Plan.
2 An assessment of the level of performance of air navigation services provided
2.1 Cost efficiency performance
With respect to the 4 Key Performance Areas of Safety, Capacity, Environment and Cost
Efficiency comprehended by the SES Performance Scheme for RP2, only the Cost
Efficiency KPA is applicable to Meteorological Air Navigation Service Providers. Met
Éireann has agreed its determined costs with the NSA and the 2019 determined costs
submitted were those agreed under the RP2 plan.
The total MET Cost (enroute + terminal) invoiced over 2019 was less than the determined
costs detailed in the RP2 Performance Plan. Summarised as follows:
RP2 Determined MET Costs 2019 = €9,247,000
Total Invoiced MET Cost 2019 = €8,306,000
RP2 Determined MET Unit Rate cost =12.29
Actual MET contribution to 2019 Unit Rate = €9.89
The tables on the following 2 pages provide further detail
17/06/2020 page 6 of 20
42SES Annual Report 2019
Table 1 - Total Costs and Unit Costs ENROUTE
Ireland
Currency: Euro
MET
Determined costs - Performance Plan RP2 Actual costs - RP2
Cost details 2015 2016 2017 2018 2019 2015 2016 2017 2018 2019
1. Detail by nature (in nominal terms)
1.1 Sta ff 4,551 4,783 5,004 4,383 3,993 4,338 4,499 4,638 3,999 3,586
1.2 Other opera ti ng cos ts (1) 2,259 2,795 2,902 2,973 2,882 2,154 3,099 3,158 3,182 3,059
1.3 Depreci a ti on 0 499 507 515 523 0 0 0 0
1.4 Cos t of ca pi ta l
1.5 Excepti ona l i tems
1.6 Tota l cos ts 6,810 8,077 8,413 7,871 7,398 6,492 7,598 7,796 7,181 6,645
Tota l % n/n-1 0.1% 18.6% 4.2% -6.4% -6.0% 0.2% 17.0% 2.6% -7.9% -7.5%
Sta ff % n/n-1 2.8% 5.1% 4.6% -12.4% -8.9% -0.9% 3.7% 3.1% -13.8% -10.3%
Other op. % n/n-1 -4.8% 23.7% 3.8% 2.4% -3.1% 2.6% 43.9% 1.9% 0.8% -3.9%
2. Detail by service (in nominal terms)
2.1 Ai r Tra ffi c Ma na gement
2.2 Communi ca ti on (2)
2.3 Na vi ga ti on (2)
2.4 Survei l l a nce (2)
2.5 Sea rch a nd res cue
2.6 Aerona uti ca l Informa ti on (2)
2.7 Meteorol ogi ca l s ervi ces (2) 6,810 8,077 8,413 7,871 7,398 6,492 7,598 7,796 7,181 6,645
2.8 Supervi s i on cos ts
2.9 Other Sta te cos ts (1)
2.10 Tota l cos ts 6,810 8,077 8,413 7,871 7,398 6,492 7,598 7,796 7,181 6,645
Tota l % n/n-1 18.6% 4.2% -6.4% -6.0% 0.2% 17.0% 2.6% -7.9% -7.5%
ATM % n/n-1
CNS % n/n-1
3. Complementary information (in nominal terms)
Average asset base
3.1 Net book va l . fi xed a s s ets
3.2 Adjus tments tota l a s s ets
3.3 Net current a s s ets
3.4 Tota l a s s et ba s e
Cost of capital %
3.5 Cos t of ca pi ta l pre ta x ra te
3.6 Return on equi ty
3.7 Avera ge i nteres t on debts
Cost of common projects
3.8 Tota l cos ts of common projects 0 0 0 0 0 0 0 0 0 0
Costs exempted from cost sharing (Article 14(2)(b))
3.9 Tota l cos ts exempted from cos t 0 0 0 0 0
4. Total costs after deduction of costs for services to exempted flights (in nominal terms)
4.1 Cos ts for exempted VFR fl i ghts 0 0 0 0 0 0 0 0 0 0
4.2 Tota l determi ned/a ctua l cos ts 6,810 8,077 8,413 7,871 7,398 6,492 7,598 7,796 7,181 6,645
5. Cost-efficiency KPI - Determined/Actual Unit Cost (in real terms)
5.1 Infl a ti on % (3) 1.10% 1.20% 1.40% 1.70% 1.70% 0.00% -0.20% 0.30% 0.70% 0.90%
5.2 Pri ce i ndex (ba s e 100 i n 2009) (4) 103.7 105.0 106.4 108.2 110.1 102.3 102.1 102.4 103.1 104.0
5.3 Total costs real terms (5) 6,566 7,695 7,904 7,272 6,720 6,347 7,443 7,614 6,965 6,387
Tota l % n/n-1 17.2% 2.7% -8.0% -7.6% 0.2% 17.3% 2.3% -8.5% -8.3%
5.4 Total Service Units 4,000.0 4,049.6 4,113.3 4,184.9 4,262.1 4,182.5 4,467.6 4,465.3 4,549.9 4,640.9
Tota l % n/n-1 -0.1% 1.2% 1.6% 1.7% 1.8% 6.6% 6.8% -0.1% 1.9% 2.0%
5.5 Unit cost at 2009 prices 1.64 1.90 1.92 1.74 1.58 1.52 1.67 1.71 1.53 1.38
Tota l % n/n-1 15.8% 1.1% -9.6% -9.3% -6.0% 9.8% 2.4% -10.2% -10.1%
17/06/2020 page 7 of 20
43SES Annual Report 2019
Table 1 - Total Costs and Unit Costs- TERMINAL
Ireland
Euro
MET
Determined costs - Performance Plan RP2 Actual costs - RP2
Cost details 2015 2016 2017 2018 2019 2015 2016 2017 2018 2019
1. Detail by nature (in nominal terms)
1.1 Sta ff 1,138 1,196 1,251 1,096 998 1,084 1,125 1,159 1,000 896
1.2 Other opera ti ng cos ts 565 699 725 743 720 539 774 790 795 765
1.3 Depreci a ti on 0 125 127 129 131 0 0 0 0
1.4 Cos t of ca pi ta l
1.5 Excepti ona l i tems
1.6 Tota l cos ts 1,702 2,019 2,103 1,968 1,849 1,623 1,899 1,949 1,795 1,661
Tota l % n/n-1 18.6% 4.2% -6.4% -6.0% 17.0% 2.6% -7.9% -7.5%
Sta ff % n/n-1 5.1% 4.6% -12.4% -8.9% 3.8% 3.0% -13.7% -10.4%
Other op. % n/n-1 23.7% 3.8% 2.5% -3.1% 43.6% 2.1% 0.6% -3.8%
2. Detail by service (in nominal terms)
2.1 Ai r Tra ffi c Ma na gement
2.2 Communi ca ti on (1)
2.3 Na vi ga ti on (1)
2.4 Survei l l a nce (1)
2.5 Sea rch a nd res cue
2.6 Aerona uti ca l Informa ti on (1)
2.7 Meteorol ogi ca l s ervi ces (1) 1,702 2,019 2,103 1,968 1,849 1,623 1,899 1,949 1,795 1,661
2.8 Supervi s i on cos ts
2.9 Other Sta te cos ts
2.10 Tota l cos ts 1,702 2,019 2,103 1,968 1,849 1,623 1,899 1,949 1,795 1,661
Tota l % n/n-1 18.6% 4.2% -6.4% -6.0% 17.0% 2.6% -7.9% -7.5%
ATM % n/n-1
CNS % n/n-1
3. Complementary information (in nominal terms)
Average asset base
3.1 Net book va l . fi xed a s s ets
3.2 Adjus tments tota l a s s ets
3.3 Net current a s s ets
3.4 Tota l a s s et ba s e 0 0 0 0 0 0 0 0 0 0
Cost of capital %
3.5 Cos t of ca pi ta l pre ta x ra te
3.6 Return on equi ty
3.7 Avera ge i nteres t on debts
Cost of common projects
3.8 Tota l cos ts of common projects 0 0 0 0 0
Costs exempted from cost sharing (Article 14(2)(b))
3.9 Tota l cos ts ex. from cos t s ha ri ng 0 0 0 0 0
4. Total costs after deduction of costs for services to exempted flights (in nominal terms)
4.1 Cos ts for exempted VFR fl i ghts
4.2 Total determined/actual costs 1,702 2,019 2,103 1,968 1,849 1,623 1,899 1,949 1,795 1,661
5. Cost-efficiency KPI - Determined /Actual Unit Cost (in real terms)
5.1 Infl a ti on % (2) 1.10% 1.20% 1.40% 1.70% 1.70% 0.00% -0.20% 0.30% 0.70% 0.90%
5.2 Pri ce i ndex (ba s e 100 i n 2009) (3) 103.7 105.0 106.4 108.2 110.1 102.3 102.1 102.4 103.1 104.0
5.3 Total costs real terms (4) 1,641 1,924 1,976 1,818 1,680 1,587 1,860 1,904 1,741 1,597
Tota l % n/n-1 17.2% 2.7% -8.0% -7.6% 17.2% 2.3% -8.5% -8.3%
5.4 Total Service Units 141.2 144.4 148.2 152.9 156.9 149.9 163.3 171.7 182.7 187.7
Tota l % n/n-1 2.3% 2.6% 3.2% 2.6% 9.0% 5.1% 6.4% 2.7%
5.5 Unit cost at 2009 prices 11.62 13.32 13.33 11.89 10.71 10.59 11.39 11.09 9.53 8.51
Tota l % n/n-1 14.6% 0.1% -10.8% -10.0% 7.6% -2.7% -14.1% -10.7%
17/06/2020 page 8 of 20
44SES Annual Report 2019
2.2 Non-financial performance
In addition to the cost efficiency targets mentioned above, Met Éireann’s Aviation
Services Division set internal performance metrics. These relate to both the timeliness
and accuracy of operational outputs, targets for calibration and maintenance of
instruments and technical equipment and organisational KPIs for personal performance
management and business planning. Additional product verification processes are used
to verify warnings accuracy and graphical forecast product verification. Examples of some
performance metrics in these areas are provided here:
a) Timeliness Trends
The KPI’s for service timeliness is set by the divisional QMS and the following graphic
represents the most recent rolling 12 month trends
METAR Timeliness for year 2019
KP Target 95%
100
95
90 EID
W
85 EIN
N
% on Time
80
EIC
75 K
EIK
70
N
65
60
55
50
Dec-18Jan-19Feb-19Mar-19Apr-19May-19Jun-19Jul-19Aug-19Sep-19Oct-19Nov-19Dec-19
17/06/2020 page 9 of 20
45SES Annual Report 2019
FT TAF Timeliness Dec. 2018 - Dec. 2019
KP Target 95%
100
95
90 EID
W
85 EIN
N
80
% on Time
EIC
K
75 EIK
N
70 ALL
65
60
55
50
Dec-18Jan-19Feb-19Mar-19Apr-19May-19Jun-19Jul-19Aug-19Sep-19Oct-19Nov-19Dec-19
b) Forecast accuracy
Met Éireann participates in the Met Alliance TAF verification project and routinely
receives detailed data relating to accuracy of TAF produced and disseminated by ASD for
Irish State airports. TAFs produced by Met Éireann compare very well in terms of accuracy
compared with those produced by other members of the Met Alliance project 1. The
following graphics present the general trend in forecast accuracy over the past 3 years.
The targets set are aligned with ICAO Annex 3 Attachment B - Desirable Levels of Forecast
Accuracy.
1
Met Alliance members include KNMI (Netherlands), DWD (Germany), MeteoFrance, BelgoControl,
AustroControl, MeteoLux, Met Éireann, MeteoSwiss.
17/06/2020 page 10 of 20
46You can also read