Delivering Value. Kinross Gold Corporation - January 2020
←
→
Page content transcription
If your browser does not render page correctly, please read the page content below
January 2020

Delivering Value.
Kinross Gold Corporation
Cautionary Statement on Forward-Looking
Information
All statements, other than statements of historical fact, contained or incorporated by reference in or made in giving this presentation and responses to questions, including
but not limited to any information as to the future performance of Kinross, constitute “forward looking statements” within the meaning of applicable securities laws, including
the provisions of the Securities Act (Ontario) and the provisions for “safe harbor” under the United States Private Securities Litigation Reform Act of 1995 and are based on
expectations, estimates and projections as of the date of this presentation. Forward-looking statements contained in this presentation include those statements on slides
with, and statements made under, the headings “Kinross Value Proposition”, “Diversified Portfolio of Assets”, “On Track to Meet Guidance Targets”, “2019E Outlook”,
“Achieving Performance Improvements at Paracatu”, “Continued Strong Performance at Tasiast”, “Strong Performance at Kupol-Dvoinoye”, “Tasiast 24k Project Feasibility
Study Results”, “Advancing the Tasiast 24k Project”, “Tasiast Project Financing Update”, “Chulbatkan On Track to Close Early 2020”, “Significant Upside Opportunities at
Chulbatkan”, “Chulbatkan Regional Exploration Upside”, “Nevada Projects Now Complete”, “Fort Knox Gilmore”, “Gilmore Feasibility Study Results”, “Chile Projects”,
“Kupol-Dvoinoye Exploration Highlights”, “Another 1-Year Mine Life Extension in Russia”, “Chirano Exploration Highlights”, and “Compelling Relative Value”, and include
without limitation statements with respect to our guidance for production, production costs of sales, all-in sustaining cost and capital expenditures, permit applications and
conversions, continuous improvement and other cost savings opportunities, as well as references to other possible events include, without limitation, possible events;
opportunities; statements with respect to possible events or opportunities; estimates (including, without limitation, gold / mineral resources, gold / mineral reserves and mine
life) and the realization of such estimates; future development, mining activities, production and growth, including but not limited to cost and timing; success of exploration
or development of operations; the future price of gold and silver; currency fluctuations; expected capital requirements; government regulation; and environmental risks. The
words “2019E”, “2020E”, “assumption”, “encouraging”, “estimate”, “expect”, “feasibility study”, “focus”, “forecast”, “future”, “growth”, “guidance”, “objective”, “on budget”,
“on schedule”, “on track”, “opportunity”, “optimize”, “outlook”, “plan”, “potential”, “progressing”, “project”, “promising”, “prospective”, “risk”, “upside” or “target”, or variations of
or similar such words and phrases or statements that certain actions, events or results may, can, could, would, should, might, indicates, or will be taken, and similar
expressions identify forward looking statements. Forward-looking statements are necessarily based upon a number of estimates and assumptions that, while considered
reasonable by Kinross as of the date of such statements, are inherently subject to significant business, economic, legislative and competitive uncertainties and
contingencies. Statements representing management’s financial and other outlook have been prepared solely for purposes of expressing their current views regarding the
Company’s financial and other outlook and may not be appropriate for any other purpose. Many of these uncertainties and contingencies can affect, and could cause,
Kinross’ actual results to differ materially from those expressed or implied in any forward looking statements made by, or on behalf of, Kinross. There can be no assurance
that forward looking statements will prove to be accurate, as actual results and future events could differ materially from those anticipated in such statements. All of the
forward looking statements made in this presentation are qualified by these cautionary statements, and those made in our filings with the securities regulators of Canada
and the U.S., including but not limited to those cautionary statements made in the “Risk Factors” section of our most recently filed Annual Information Form, the “Risk
Analysis” section of our FYE 2018 Management’s Discussion and Analysis, and the “Cautionary Statement on Forward-Looking Information” in our news release dated July
31, 2019, to which readers are referred and which are incorporated by reference in this presentation, all of which qualify any and all forward‐looking statements made in this
presentation. These factors are not intended to represent a complete list of the factors that could affect Kinross. Kinross disclaims any intention or obligation to update or
revise any forward‐looking statements or to explain any material difference between subsequent actual events and such forward‐looking statements, except to the extent
required by applicable law.
Other information
Where we say "we", "us", "our", the "Company", or "Kinross" in this presentation, we mean Kinross Gold Corporation and/or one or more or all of its subsidiaries, as may be
applicable.
The technical information about the Company’s mineral properties contained in this presentation has been prepared under the supervision of Mr. John Sims, an officer of
the Company who is a “qualified person” within the meaning of National Instrument 43-101.

                                                                                                                                                                                        2
Kinross Value Proposition
Operational Excellence                                            Financial Strength & Flexibility
Diverse portfolio of operating mines consistently                 Leveraging our financial strength to invest in our
meeting or outperforming operational targets                      development pipeline

                                                                  Repaid over $1.0 billion of debt

      7
   Consecutive
                        Met or
                      exceeded
                      guidance
                                                                  over past 6 years

                                                                  ~$1.8 billion of liquidity
                                                                                                                               $1.8
                                                                                                                               billion

                                                                  No debt maturities prior to
      Years                                                       September 2021                                            Cash     Available credit

Development Projects                                                               Compelling Relative Value
Diverse portfolio of major projects and additional                                 Attractive value opportunity relative to peers
development opportunities
                                                                                                           EV / 2020E EBITDA
                                                                                     15.4
    Relatively low-risk brownfields projects
                                                                                               10.6
                                                                                                          9.5
    Located at or near existing operations                                                                      6.6   6.4     5.8        5.6
                                                                                                                                                    4.8
    Benefits of existing infrastructure

    Well-known mining jurisdictions

                                                                                                                AU
                                                                                                NEM

                                                                                                                      AUY

                                                                                                                                          GFI

                                                                                                                                                    IAG
                                                                                       AEM

                                                                                                          ABX

                                                                                                                               KGC
                                     Figures for cash and available credit are as at September 30, 2019
                                          EV/2020E EBITDA – Source: FactSet (January 24, 2020)                                                  3
Operational
Excellence
We remain focused on operational
excellence, building a culture of
continuous improvement, innovation and
disciplined cost management

                                         4
Operational Excellence                                                                                           January 2020

Diversified Portfolio of Assets
~60% of 2019E gold equivalent production expected from mines located in the Americas

      Dvoinoye,
         Russia    Kupol,                 Fort Knox, USA
                   Russia
     Chulbatkan,
     Russia
                                                           Bald Mountain, USA
                                                           Round Mountain, USA

                                                                                                       Tasiast, Mauritania
2019E Gold Equivalent Production(1,2)

         20%                                                                                               Chirano, Ghana

            2.5M
           ounces (+/- 5%) 58%                                                      Paracatu, Brazil
     22%
                                                               La Coipa, Chile
                                                                Lobo-Marte, Chile
                                                                                           Operations
    Americas   West Africa      Russia
                                                                                           Development Projects

                     (1) Refer to endnote #1.
                     (2) Refer to endnote #2.                                                                                5
Operational Excellence January 2020
On Track to Meet 2019 Guidance Targets
Continued track record of meeting or outperforming our operational targets
• Strong production and excellent cost performance from the portfolio
• On track to meet 2019 guidance targets for production, cost of sales,
all-in sustaining cost and capital expenditures
Tracking towards the low-end of cost of sales range
Tracking towards the high-end of capital expenditures range
2019 Guidance(3) First Nine Months of 2019
Gold equivalent production (oz.)(2) 2.5 million (+/-5%) 1,862,315
Production cost of sales ($/oz.)(1,2) $730 (+/-5%) $692
All-in sustaining cost ($/oz.)(1,2) $995 (+/-5%) $958
Capital expenditures ($M) $1,050 (+/-5%) $807
(1) Refer to endnote #1.
(2) Refer to endnote #2. 6
(3) Refer to endnote #3.
Operational Excellence                                                                                                                           January 2020

2019E Outlook(2)
                                            Kinross Total(1) Regional Guidance                                       2019E Unit Costs
                                                                                                                 ($ per gold equivalent ounce)(2,3)
                                                                                                   Tracking towards the low end of cost of sales guidance
                                              2.5 million                      Americas
                                                (+/- 5%)
                                                                              1.44 million         Cost of sales                             $730/oz. (+/- 5%)
2019E Gold Equivalent Production (ounces)

                                                                                      (+/- 5%)

                                                                                                   All-in sustaining cost                    $995/oz. (+/- 5%)

                                                                                                              2019E Capital Expenditures
                                                                                                                              ($ millions)

                                                                                                       Tracking towards the high end of capital guidance

                                                                           West Africa(1)         Capital expenditures                       $1,050 (+/- 5%)
                                                                             560,000
                                                                                      (+/- 10%)   Reflects decisions to take advantage of value-enhancing
                                                                                                  opportunities in 2019, including:

                                                                                 Russia           • The Tasiast 24k project
                                                                                 500,000          • Purchasing additional mining fleet at Paracatu to
                                                                                      (+/- 3%)
                                                                                                    accelerate the mining rate and enhance the mine plan
                                                           (1) Refer to endnote #1.
                                                           (2) Refer to endnote #2.                                                                         7
                                                           (3) Refer to endnote #3.
Operational Excellence                                                                           January 2020

Third Quarter 2019 Operational Highlights
In the first nine months of 2019, our three largest operations produced over 60%
of total production with an average cost of sales of $619/oz.(3)
 Operation                                     First nine Months 2019               Highlights
                                                   Performance(3)
 Kupol-Dvoinoye, Russia                       Production
                                                              395,334   • Continues to be a steady
                                              (Au. eq. oz.)
                                                                          performer, with strong production
                                              Cost of Sales    $590
                                              ($/oz.)
                                                                          and margins

 Tasiast, Mauritania                          Production                • Production and cost performance
                                              (Au. eq. oz.)   288,124     remain strong
                                              Cost of Sales    $641     • Highlights benefits of the Phase
                                              ($/oz.)
                                                                          One expansion
 Paracatu, Brazil                             Production
                                              (Au. eq. oz.)   479,339   • Throughput and recovery
                                              Cost of Sales    $629       continue to outperform as a result
                                              ($/oz.)                     of asset optimization program

                   (3) Refer to endnote #3.                                                                8
Operational Excellence January 2020
Achieving Performance Improvements at Paracatu
Realizing the benefits of asset optimization and continuous improvement efforts
through strong performance and cost reduction
Strong performance year-to-date driven by:
• Asset optimization program, resulting in
better ability to predict grade, ore
hardness, recovery, and throughput
Throughput and recovery have
outperformed for the past 3 quarters
• Continuous improvement efforts,
resulting in increased mine and mill Paracatu Results
efficiencies First nine First nine
months of 2019 months of 2018
• Investments in site infrastructure Production
479,339 375,941
(Au Eq. oz.)
Production cost of sales(3)
($ per Au Eq. oz.) $629 $846
(3) Refer to endnote #3.
9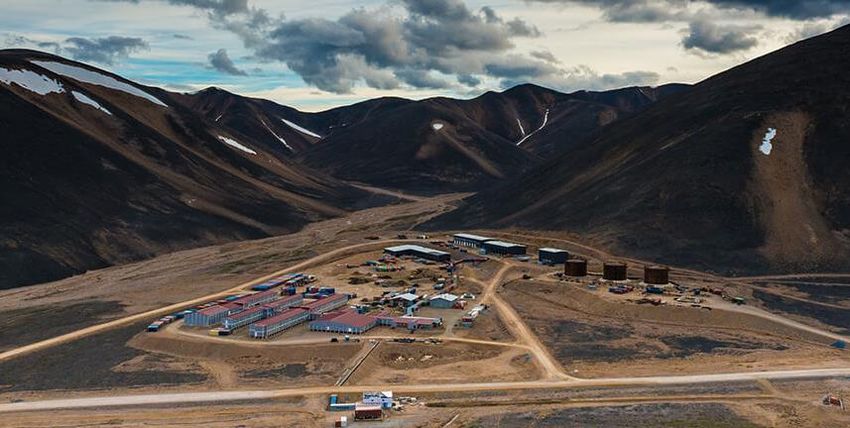
Operational Excellence                                                                  January 2020

Continued Strong Performance at Tasiast
Strong performance year-to-date highlights the benefits of the Phase One
expansion, resulting in higher production and improved costs

• Significant improvement in Tasiast’s
  performance following completion of the
  Phase One expansion

• Operational performance exceeding
  feasibility study estimates

• Production increased in Q3 2019, a result
  of planned higher grades and strong
  recoveries                                Tasiast Results
                                                                              First nine       First nine
                                                                            months of 2019   months of 2018

                                              Production
                                                                              288,124           159,417
                                              (Au Eq. oz.)
                                              Production cost of sales(3)
                                              ($ per Au Eq. oz.)                $641            $1,052

                   (3) Refer to endnote #3.
                                                                                                 10
Operational Excellence January 2020
Strong Performance at Kupol-Dvoinoye
Consistent, low-cost operations
Q3 highlights
• Achieved the lowest cost of sales per ounce
in the portfolio in Q3 2019
• Production increased compared with Q2
2019, a result of higher grades
Russia Results
First nine 2019
months of 2019 Guidance(2)
Production
395,334 500k (+/- 3%)
(Au Eq. oz.)
Production cost
$590 $600 (+/- 3%)
of sales(3) ($/oz.)
(2) Refer to endnote #2.
(3) Refer to endnote #3. 11Financial Strength &
Flexibility
With strong cash flow and no debt
maturities until 2021, we have the
financial strength and flexibility to fund
our pipeline of development projects
12Financial Strength & Flexibility January 2020
Third Quarter 2019 Financial Highlights
Capturing the benefits of higher gold prices and improved cost performance
Year-over-year improvements Third quarter 2019 performance
21% Average realized gold price Increased revenue, cash flow and
increase ($ per Au oz.) earnings year-over-year
Adjusted operating cash flow
$42/oz. more than doubled year-over-year
Cost of sales(2,3)
lower ($ per Au eq. oz.)
Positive revision to ratings
outlook from Moody’s
70% Attributable margin(3) Tasiast project financing
increase ($ per Au eq. oz. sold) approved by the Board of the
IFC, and the definitive agreement
was signed in December
(1) Refer to endnote #1.
(2) Refer to endnote #2. 13Financial Strength & Flexibility January 2020
Share Price Reaction to Third Quarter Results
2019 Performance Third Quarter 2019 Consensus
Kinross Gold GDX Analyst
Actual
Consensus
170
EPS $0.08 $0.08 Met
160 CFPS $0.24 $0.24 Met
Sell-Side Commentary
150 • “From an operational standpoint, Q3/19 was a
largely in-line quarter, notwithstanding the
140
13% sell-off on the day.”
Rebased to 100
Carey McRurey, Canaccord Genuity
• “We believe this under performance in share
130
price to be overdone. We are forecasting K to
return to positive FCF in Q4 and onwards
120 based on spot commodity prices.”
Tanya Jakusconek, Scotiabank
110
• “Kinross reported a generally in-line quarter,
and we expect FCF to pick up in 2020 as the
various capital projects are completed.”
100 Richard Gray, Cormark
• “KGC posted an in-line operating quarter in
90 3Q19 with slightly better production offsetting
Jan Feb Mar Apr May Jun Jul Aug Sep Oct Nov Dec higher than expected costs.”
Farooq Hamed, Raymond James
14Financial Strength & Flexibility January 2020
Strong Liquidity Position
Strong position to finance organic development projects with existing liquidity
and cash flow generation
• Manageable debt schedule with no debt maturities Liquidity Position
prior to September 2021 ($ billion)
• 1-year extension of revolving credit facility
Now matures in 2024
• Signed definitive loan agreement for up to $300
As at
million for the Tasiast operation in December September 30, 2019
• Non-core portfolio sales:
$1.8B
Gross processed of CAD$150 million from sale
of Lundin Gold shares
Divested royalty portfolio to Maverix Metals for
total consideration of $74 million
• Portfolio of mines generating robust cash flow Cash & cash equivalents Available credit
15Financial Strength & Flexibility January 2020
Manageable Debt Profile
No debt maturities prior to 2021
Debt Schedule Debt Ratings
Revolving credit facility (drawn amounts) Senior notes Agency Rating
S&P BBB- (Stable)
(i)
$120 Moody’s Ba1 (Positive)
Fitch BBB- (Stable)
$500 $500 $500
Interest Rates
$ millions
Senior Notes (due 2021) 5.125%
Revolving credit facility
$250 LIBOR + 1.625%
(matures 2024)
Senior Notes (due 2024) 5.950%
Senior Notes (due 2027) 4.500%
Through
$0 2021 2022
$0 2023 2024 2025
$0 to 2027 2028 to 2041 Senior Notes (due 2041) 6.875%
2020 2026 2040
(i) Reflects cash amounts drawn on the Company’s $1.5 billion revolving credit facility as at September 30, 2019.
16Development Projects &
Exploration Highlights
We have a portfolio of development projects that
we are progressing, and we are also focused on
advancing a pipeline of future opportunities and
high potential exploration targets
17Development Projects January 2020
Tasiast 24k Project Feasibility Study Results
Proceeding with value-enhancing Tasiast 24k project, which offers attractive
returns, increased production and lower costs
Operating Estimates
Throughput capacity 24,000 t/d
Average annual production (2022 – 2028) 563,000 gold ounces
Production cost of sales (2022 – 2028)(3) $485 per gold ounce
All-in sustaining cost (2022 – 2028)(3) $560 per gold ounce
Mine life 2033
Economics (assuming $1,200 per ounce gold price and $55 per barrel oil price)
Initial capital expenditures $150 million
Internal rate of return(i) 60%
(incremental)
Net present value $1.7 billion
(after tax, 5% discount rate)
(3) Refer to endnote #3. (i) Incremental to the current forecasted operational estimates based on
15,500 t/d throughput. 18Development Projects January 2020
Low-Capital Continuous Improvement Approach
Increase to throughput through debottlenecking initiatives, plant upgrades and
optimization of the mine plan and processing circuit
Building off success of Phase One and Project Overview
continued outperformance of the SAG mill
• Addition of a new larger ball mill no • Modification to existing grinding circuit
longer required as 24k project optimizes • Additional leaching and thickening
the grinding circuit capacity
• Incorporates operational efficiencies • Incremental additions to on-site power
identified in areas of maintenance, generation and water supply
mining, supply chain and processing
Phase One Tasiast 24k Project
Gyratory Ore SAG Additional Existing CIL plant & New tails
crusher stockpile mill Existing leaching refinery thickening
ball mills capacity
Tasiast 24k includes incremental additions to the capacity of the associated power, sondage (raw water) and tailings management
infrastructure.
19Development Projects January 2020
Advancing the Tasiast 24k Project
Well-positioned to execute the 24k project
Low relative execution risk
• Project plan leverages Kinross’ experience
successfully building and operating Phase
One
• Less infrastructure requirements
• Permits in place for the 24k project
Detailed engineering now 65% complete
• Filed updated technical report in October Expected Project Milestones
• Commenced initial works, mobilized
Throughput expected to ramp
construction contractors and advanced End of 2021
up to 21,000 t/d
procurement activities
• Ramping up stripping to position us well Throughput expected to reach
Mid-2023
for 2020 and beyond 24,000 t/d
20Development Projects January 2020
Tasiast Project Financing
Signed definitive loan agreement for up to $300 million for Tasiast
• Participation from IFC, a member of the
World Bank Group, Export Development
Canada (EDC) and two commercial banks
• Agreement was signed following a
comprehensive due diligence process with
the lenders, including:
Tasiast Asset Recourse Financing Details
Site visits
Amount Up to $300 million
Meetings with the Government of 8 years, maturing in
Mauritania Term
December 2027
Significant technical and environmental Interest rate LIBOR plus 4.38%
reviews and evaluations
Expected early 2020
First drawn down (subject to satisfaction of customary
conditions precedent)
21Development Projects January 2020
Positive Momentum in Mauritania
Successfully operated in Mauritania for over 10 years
Cumulative production of over 2 million gold equivalent ounces
Established $300M political risk insurance policy with MIGA,
member of the World Bank
Constructed Phase One
~$800M project successfully commissioned on time and on budget
Operation outperforming expectations
Strong throughput and recovery, highlighting benefits of Phase One
New 3-year labour agreement
Approved the capital efficient Tasiast 24k project
Offers attractive returns, increased production and lower costs
$300M asset recourse financing
Signed definitive loan agreement with the IFC, EDC, and two commercial banks,
the largest ever in Mauritania
Frequent and constructive dialogue with the new administration
22Development Projects January 2020
Chulbatkan: Strong Base Case with Upside Potential
Expected to be a substantial open pit gold mine with a low all-in sustaining cost
• Preliminary estimates; scope of project may change following planned extensive drill program
and technical studies and trade-offs
Excellent fit for Kinross
Metric Estimate(4)
Initial mine life 6 years Quality asset with upside
Total life of mine production 1.8Moz. recovered
potential
Strip ratio 1.5 Leverages operating expertise
Average all-in sustaining cost In the range of $550/oz.
Builds on existing regional
Initial capital expenditures(i) $500M
platform
Chulbatkan Mineral Resource Estimates(5)
Aligns with project development
Tonnes Grade Ounces and capital priorities
(Mt) (g/t) (koz.)
Indicated 87 1.4 3,910 Maintains solid liquidity position
Inferred 3 1.0 80
(4) Refer to endnote #4.
(5) Refer to endnote #5. (i) The $500 million estimate for initial capital expenditures includes $40 million for 23
exploration and pre-feasibility and feasibility studies.Development Projects January 2020
Overview of the Chulbatkan Resource
Near-surface, high-grade, open-pit, heap leachable deposit with large estimated
resource
• Near surface, highly continuous • Significant drilling ends in mineralization; current
mineralization resource extends to ~375m depth
• Mineralization currently open along strike as • Current resource estimate limited to geographical
well as at depth extents of drilling completed to date
Plan view looking down at the surface(6) Cross section looking northeast
0.35 g/t cutoff 0.35 g/t cutoff
A
N
Kinross A’
preliminary
A
block model(i)
Kinross Kinross
$1,400 pit shell $1,400
RKC-4 pit shell Kinross
RKC-3
preliminary
RKC-1 block model(i)
RKC-2
RKC-6
Au (g/t)
RKC-5 Au (g/t)
RKC-8 RKC-7
A’
Existing Resource drilling
RKC confirmation drilling
(6) Refer to endnote #6. (i) Kinross preliminary block model does not include results from
RKC confirmation drilling 24Development Projects January 2020
Significant Upside Opportunities at Chulbatkan
Kinross plans to undertake a robust exploration program with a focus of defining
and further extending the resource
• Confirmatory drill program(6) encountered a • Drill planning and execution to grow
high-grade structure within the existing resource resource underway targeting key minex
(hole RKC-4) areas
• Infill drilling and studies planned to update high-
grade portion of resource
High grade portion of resource Plan view looking down at the surface
3D oblique view to the northeast 0.35 g/t cutoff
Kinross
preliminary
block model(i)
N
RKC-4
RKC-4
RKC-4 drilled after block
RKC-3 Kinross
model estimate Au (g/t)
RKC-1
$1,400
129g/t over 52m(ii) RKC-2 pit shell
RKC-6
Kinross
RKC-5
$1,400
pit shell
RKC-8 RKC-7
Au (g/t)
Existing Resource drilling
Kinross preliminary
RKC confirmation drilling
block model(i)
>4g/t HG blocks shown
Immediate extension drilling targets
(i) Kinross preliminary block model does not include results from
(6) Refer to endnote #6. 25
RKC confirmation drilling
(ii) Down-hole intercepts.Development Projects January 2020
Chulbatkan Regional Exploration Upside
Numerous untested potential targets within the ~120km2 exploration license
• Multiple structural environments
analogous to Chulbatkan deposit
• Multiple downstream placer gold
occurrences indicate hard rock sources
within license area
• Numerous >1g/t surface rock samples
outside of defined resource area
Chulbatkan
• Footprint of resource estimate(4) Current
Resource
represents less than 1% of the
under-explored license area
Granites / granodiorites
Cretaceous
Jurassic
Sediment cover
Chulbatkan License Area
Prospective Target Area
Grab Sample (>1 g/t Au)
Grab Sample (Development Projects January 2020
Nevada Projects Now Complete
Construction and commissioning of the Bald Mountain Vantage Complex and
Round Mountain Phase W complete
Bald Mountain Round Mountain
• Severe weather and poor vendor • During Q3, fleet prioritized to mitigate wall
performance earlier this year impacted failure which occurred late last year
production ramp-up Stacked fewer tonnes on the heap
• Heap leach completed and fully operational leach pad as a result
late in Q3 Mitigation work now complete and
Since early September, daily ounce stacking rates have increased
production has steadily increased • Expect increased production in Q4 2019
• Expect improved production and costs in
Q4 2019
27Development Projects January 2020
Fort Knox Gilmore
Gilmore project expected to extend mine life to 2030 and strengthen long-term
U.S. production profile
28Development Projects January 2020
Gilmore Feasibility Study Results
Project expected to generate a 17% IRR at an assumed gold price of $1,200 per
ounce
Current mine plan + Gilmore estimates
Average annual production (2018-2027) 245,000 gold ounces
Production cost of sales (2018-2027)(3) $735 per gold equivalent ounce
All-in sustaining cost (2018-2027)(3) $1,015 per gold equivalent ounce
Milling - 2020
Mine life Mining – 2027
Residual leach – 2030
Incremental Gilmore estimates
Total ounces recovered 1.5 million ounces
Initial capital expenditures (2018-2020) $100 million
Capitalized stripping (non-sustaining) (2018-2020) $60 million
Internal rate of return(i) 17%
Net present value(i) (ii) $130 million
(3) Refer to endnote #3. Note: figures on this slide reflect at $1,200 per ounce gold price assumption.
(i) July 1, 2018 forward. 29
(ii) After tax, 5% discount rate.Development Projects January 2020
Fort Knox Gilmore
Initial production from Gilmore is expected in early 2020
• Advancing on budget and on schedule
• Heap leach construction and dewatering
activities planned for 2019 are now complete
Will recommence in the spring of 2020
• Stripping commenced in Q3 2019
Have now begun to encounter initial
Gilmore ore
30Development Projects January 2020
Chile Projects
We are evaluating the potential for a return to production in Chile
La Coipa Restart Project N
• Feasibility study results expected to be released in
February 2020 La Coipa Restart
project
Lobo-Marte Project
• Scoping study completed in Q1 2019 with
encouraging results, including:
Total estimated production: 4.1M Au oz. at 1.2 g/t
Lobo-Marte
Mine life: 10+ years project
Processing: heap leach with SART
Initial capital: $750M (+/- 20%)
Maricunga mine
• Pre-feasibility study on schedule to be completed in
mid-2020 33 km
31Exploration Highlights January 2020
Kupol-Dvoinoye Exploration Highlights
2019 exploration program continues to Kupol West Licence
N
progress well NE-EXT
• Kupol exploration program focused on Kupol Mining
Licence
high potential targets
NE
NU
Kupol main and hanging wall zones:
Kupol Mine NZ
results continue to be positive
CZ
Big Bend: drilling continued to BB
East Wedge
intercept significant grade (Far Hanging Wall)
Kupol Main Ore Body
SZ
North Extension: encountering Moroshka
SZ HW
grades higher than previously Mining
Licence
modeled
• Encouraging results at Dvoinoye SE
Zone 37W Z650
0 km 0.5 km 1 km
32Exploration Highlights January 2020
Another 1-Year Mine Life Extension in Russia
Continuing our track record of adding reserves to offset depletion at Kupol and
Dvoinoye (4)
Cumulative Production (Au eq.) Proven and Probable Reserves (Au eq.)
7.4 2.1 2018
• Estimated mill production extended to 6.9 2.3 2017
late 2023, another 1-year addition
6.3 2.6 2016
5.6 3.1
Result of mine plan optimization 2015
and exploration additions 4.8 3.6 2014
Year(i)
4.1 3.9 2013
• Continue to be encouraged by potential
for future resource additions through 3.5 4.1 2012
exploration 3.0 5.1 2011
2.3 4.0 2010
1.6 4.1 2009
0.6 5.0 2008
Gold equivalent ounces
(millions)
(7) Refer to endnote 7. (i) Kinross acquired the Dvoinoye deposit in 2010, which added 1.1 million 33
ounces of gold proven and probable reserves as at December 31, 2011.Exploration Highlights January 2020
Chirano Exploration Highlights
Production at Chirano is expected to extend to 2021, a 1-year extension
• 2018 exploration focus continued to be adding incremental ounces to mine life
Focused on infill drilling the depth potential at Akwaaba and Paboase
• Following success of 2018 program, increased budget for 2019 to drill depth
extensions at Akwaaba and Paboase
• Started an exploration drift from Paboase underground to Tano, where economic
gold mineralization was encountered at depth
34Compelling
Relative Value
Attractive value opportunity relative to peers,
considering Kinross’ annual production, cost
structure, track record and growth opportunities
35Compelling Relative Value January 2020
2018A Production & All-In Sustaining Cost
2018A Production 2018A All-In Sustaining Cost
(million ounces) ($ per ounce)
$1,200
5.0
$1,000
4.0
$800
3.0
$600
2.0
$400
1.0 $200
0.0 $0
Newmont
Barrick
Newmont
Barrick
Yamana
Yamana
AngloGold
Gold Fields
Gold Fields
AngloGold
Kinross
Newcrest
Iamgold
Iamgold
Kinross
Newcrest
Agnico
Agnico
Source: Company reports. 36Compelling Relative Value January 2020
2020E Metrics
Attractive value opportunity relative to peers, considering Kinross’ annual
production, cost structure, track record and growth opportunities
EV / 2020E EBITDA 16.6
P / 2020E Operating CF
15.4
11.4
10.8
10.6
9.5
7.8 7.7
6.6 6.4 5.9
5.8 5.8 5.6
5.6
4.8
Newmont
Barrick
Yamana
AngloGold
Gold Fields
IAMGold
Kinross
Agnico
Newmont
Barrick
Yamana
AngloGold
Gold Fields
Kinross
IAMGold
Agnico
Source: FactSet analyst consensus – January 24, 2020. 37Appendix
38Appendix January 2020
Responsible & Safe Tailings Management
All of our tailings facilities are designed and constructed to the highest engineering standards
and meet or exceed regulatory and international requirements and standards of best practice
• Tailings management programs incorporate Paracatu Tailings Management
best-in-class tailings management Construction Design
standards(i)
• Constructed using a centerline design (not upstream) and
• Rigorous maintenance, monitoring and are engineered compacted zoned earth fill dams
Starter
emergency response procedures and plans dyke 1.
in place, including: Tailings
Daily inspections
Monthly instrumentation monitoring and 2.
data analysis
A comprehensive tailings scorecard,
which is reviewed by members of the 3.
Board of Directors, including in-camera
Inspections & Monitoring
• All facilities are inspected annually by the
• Independent assessment of Paracatu’s tailings facilities
engineer of record are conducted annually
• An independent expert reviews our facilities Rigorous maintenance, monitoring and emergency
at a minimum of every three years response procedures and plans are in place,
including daily inspections
(i) Standards aligned with the Canadian Dam Association, the Mining Association of Canada, and the International Commission on Large Dams 39Appendix January 2020
2019E Capital Expenditures(2)
• 2019 capital expenditures are expected to be $1,050 million (+/- 5%), including
estimated capitalized interest of $65 million
2019E 2019E Total 2019E Capital
Region
Sustaining Capital Non-Sustaining Capital (+/- 5%)
Americas $375 $295 $670
West Africa $35 $240 $275
Russia $30 $5 $35
Corporate $5 - $5
Sub-Total $445 $540 $985
Capitalized interest $65
Kinross Total $1,050
2019E Other Expenditures(2) $ million
Exploration $75
Overhead (G&A and business development) $165
Other operating costs $100
(2) Refer to endnote #2. 40Appendix January 2020
Currency & Oil Sensitivities
2019 Budget Assumptions(2) 2019 Sensitivities (net of hedges)(2)
Change
from Estimated impact
2019 Budget Current Spot(i) Assumptions to cost of sales
Gold US$1,200 US$1,571 FX 10% US$18/oz.
(per ounce)
Russian rouble 10% US$19/oz.(ii)
Oil US$65 US$54
(per barrel)
Brazilian real 10% US$46/oz.(iii)
Russian rouble 60 62
Oil $10/bbl. US$3/oz.
Brazilian real 3.50 4.18 Gold price $100/oz. US$5/oz.
(i) Source: FactSet – January 24, 2020.
(2) Refer to endnote #2. (ii) Impact to production cost of sales of the Russian operations 41
(iii) Impact to production cost of sales of the Brazil operationAmericas January 2020
Fort Knox, USA (100%)
The Gilmore project is expected to extend mine life to 2030
• Successfully operating one of the world’s Operating Results(3)
few cold weather heap leaches
2018 YTD 2019
• Estimated mine life: mill – 2020;
mining – 2027; leaching – 2030 Production
255,569 147,080
(Au Eq. oz.)
Production cost of sales
$837 $1,017
($/oz.)
2018 Gold Reserve & Resource Estimates(7)
Tonnes Grade Ounces
(thousands) (g/t) (thousands)
2P Reserves 267,573 0.4 3,036
M&I Resources 155,679 0.4 1,797
Inferred
88,652 0.3 808
Resources
(3) Refer to endnote #3.
(7) Refer to endnote #7.
42Fort Knox Gilmore January 2020
Summary of Feasibility Study Results
Operating Estimates (current mine plan + Gilmore) Incremental Gilmore Estimates(i)
Timeline Operational Metric Estimate Estimate
Average annual tonnes mined 60 million Strip ratio 1.2
Strip ratio 1.2 Life of mine ore processed 183 million tonnes
Average grade processed 0.37 grams per tonne Average grade processed 0.35 grams per tonne
2018-2027 Average annual production 245,000 ounces Life of mine production 1.51 million ounces
(Mining) Average mining cost $2.19 per tonne* Average production cost of sales $650 per Au eq. oz.
Average processing cost $1.74 per tonne Average all-in sustaining cost $950 per Au eq. oz.
Production cost of sales $735 per Au eq. oz. Initial capital costs $100 million
All-in sustaining cost $1,015 per Au eq. oz. Capitalized stripping (non-sustaining) $60 million
Average annual production 80,000 ounces Internal rate of return(ii) 17%
Average processing cost NPV(iii) $130 million
2028-2030 $23.6 million
(per annum)
(Leaching) Estimated Gilmore Capital Cost
Production cost of sales $855 per Au eq. oz.
All-in sustaining cost $900 per Au eq. oz. Estimate ($ millions)
Strip ratio 1.2
Barnes Creek heap leach pad 51
Average grade processed 0.37 grams per tonne
Geotechnical study and dewatering 19
Average recovery rate 79% Mining fleet & capitalized maintenance 12
2018-2030 Average annual production 205,000 ounces Infrastructure, owner’s cost and other 5
(Life of project) Average mining cost $2.19 per tonne* Contingency 13
Average processing cost $2.00 per tonne Initial capital $100
Production cost of sales $745 per Au eq. oz. Capitalized stripping $60M
All-in sustaining cost $1,005 per Au eq. oz. Total $160M
* Includes capitalized stripping
(i) Based on a $1,200 per ounce gold price assumption and a $55/bbl oil price assumption. 2018-2030 unless otherwise noted.
(ii) From July 1, 2018 forward. 43
(iii) Calculated based on a 5% discount rate from July 1, 2018 and after tax.Americas January 2020
Round Mountain, USA (100%)
Strong cash flow generator with Phase W project extending mine life to 2027
• Phase W is expected to generate solid Operating Results(3)
returns and extend mining
2018 YTD 2019
• Estimated mine life: 2024 (mining); 2027
(stockpile milling / residual leach) Production
385,601 258,163
(Au. Eq. oz.)
Production cost of sales
$728 $679
($/oz.)
2018 Gold Reserve & Resource Estimates(7)
Tonnes Grade Ounces
(thousands) (g/t) (thousands)
2P Reserves 113,893 0.7 2,668
M&I Resources 95,831 0.7 2,281
Inferred
82,086 0.8 2,058
Resources
(3) Refer to endnote #3.
(7) Refer to endnote #7.
44Round Mountain Phase W January 2020
Summary of Feasibility Study Results
Operating Estimates (current mine plan + Phase W) Standalone Phase W Estimates
Timeline Operational Metric Estimate Estimate
Strip ratio 2.9 Life of mine production 1.5 million ounces
Average grade processed 0.7 grams per tonne Life of mine ore processed 77.6 million tonnes
Average annual production(i) 341,000 ounces
2018-2024 Average grade processed 0.8 grams per tonne
Average mining cost $2.00 per tonne
(Mining) Strip ratio 4.0
Average processing cost $4.60 per tonne
Initial capital costs $230 million
Production cost of sales $765 per Au eq. oz.
All-in sustaining cost $905 per Au eq. oz. Capitalized stripping (non-sustaining) $215 million
Strip ratio N/A Internal rate of return 13%
Average grade processed 0.46 grams per tonne NPV $135 million
2025-2027 Average annual production 46,000 ounces
(Stockpile milling Average re-handle cost $1.80 per tonne
Estimated Phase W Initial Capital Cost
/ residual leach) Average processing cost $14.70 per tonne
Estimate ($ millions)
Production cost of sales $720 per Au eq. oz.
Mining fleet 73
All-in sustaining cost $785 per Au eq. oz.
Infrastructure 65
Strip ratio 2.9
Heap leach pad 21
Average grade processed 0.7 grams per tonne
Average annual production 253,000 ounces Process facilities 17
2018-2027 Tailings 9
Average mining cost $2.00 per tonne
(Life of project)
Average processing cost $4.80 per tonne Indirect and owner’s cost 18
Production cost of sales $765 per Au eq. oz. Contingency 27
All-in sustaining cost $900 per Au eq. oz. Total $230
(i) Includes years with large variances from the forecast average of up to +/- 150,000 ounces. 45Americas January 2020
Bald Mountain, USA (100%)
Forecasting strong near-term cash flow with significant upside potential
• Large estimated mineral resource base with Operating Results(3)
multiple sources of potential mineral reserve
2018 YTD 2019
additions
• Estimated mine life: 2023 Production
284,646 121,814
(Au Eq. oz.)
Production cost of sales
$547 $772
($/oz.)
2018 Gold Reserve & Resource Estimates(7)
Tonnes Grade Ounces
(thousands) (g/t) (thousands)
2P Reserves 66,650 0.6 1,347
M&I Resources 176,898 0.6 3,294
Inferred
62,982 0.4 845
Resources
(3) Refer to endnote #3.
(7) Refer to endnote #7.
46Americas January 2020
Paracatu, Brazil (100%)
Large gold mine with a long mine life that extends to 2032
• Paracatu is among the world’s largest gold Operating Results(3)
operations with annual throughput of ~60Mt
2018 YTD 2019
• Cornerstone asset in Kinross’ portfolio
Production
• Estimated mine life: 2032 (Au Eq. oz.)
521,575 479,339
Production cost of sales
$822 $629
($/oz.)
2018 Gold Reserve & Resource Estimates(7)
Tonnes Grade Ounces
(thousands) (g/t) (thousands)
2P Reserves 590,628 0.4 7,938
M&I Resources 267,840 0.3 3,013
Inferred
48,107 0.2 350
Resources
(3) Refer to endnote #3.
(7) Refer to endnote #7.
47Americas January 2020
La Coipa Restart Project PFS Results (2015)
Project expected to generate a 20% IRR at an assumed gold price of $1,200 per ounce
• The pre-feasibility study estimates a 5.5 year mine life, following commencement of stripping
Processing expected to commence 1.5 years after pre-stripping has been initiated and continue for 4 years
Life of Mine Estimates Additional Operating Metrics
(100% basis)(i)
Life of Mine Estimates
Life of Mine 5.5 years
Mill throughput capacity 13,000 tonnes per day
Total ounces recovered 1.03 million Au eq. oz.
Average mining rate 80,000 tonnes per day
Average annual
207,000 Au eq. oz. Average gold grade 1.69 g/t
production
Average silver grade 61.5 g/t
Average cost of sales $674 per Au eq. oz.
Average gold recovery 76%
Average all-in sustaining
$767 per Au eq. oz. Average silver recovery 59%
cost(ii)
Initial capital $94 million Strip ratio (waste:ore) 5.0
Pre-Stripping $105 million Key Assumptions
IRR (after-tax) 20% Assumptions
NPV(iii) $120 million Gold price $1,200 per oz.
Silver price $17 per oz.
Gold Price Sensitivity Oil price $65 per barrel
$1,100 $1,200 $1,300 Chilean Peso 600 to the US dollar
IRR 15% 20% 26% Discount rate 5%
(i) Summary results are on a 100% basis, however Kinross has a 65% interest in Puren.
(ii) All-in sustaining cost includes operating cost, sustaining capital and post start-up capitalized stripping and does not include estimated initial capital expenditures of $94 million and estimated
pre-stripping of $105 million, and any exploration, income taxes and non-cash items related to reclamation or allocation of regional or corporate overhead costs. This differs from the World 48
Gold Council definition of all-in sustaining cost.
(iii) After tax, 5% discount.Russia January 2020
Kupol-Dvoinoye (100%)
Our Russian mines are a model for successfully operating in a remote location
• High-grade, low-cost underground mines Operating Results(3)
supported by 1 mill
2018 YTD 2019
• Estimated mine life: 2023, following another Production
1-year extension in 2018 489,947 395,334
(Au Eq. oz.)
Production cost of sales
$582 $590
($/oz.)
2018 Gold Reserve & Resource Estimates(7)
Tonnes Grade Ounces
(thousands) (g/t) (thousands)
2P Reserves 7,388 7.7 1,832
M&I Resources 1,439 7.8 362
Inferred
1,915 8.4 519
Resources
(3) Refer to endnote #3.
(7) Refer to endnote #7.
49Russia January 2020
Chulbatkan Project Location
Khabarovsk is industrialized and has a well-established mining and exploration
sector
Mining-friendly jurisdiction Kupol
Magadan
• Several gold producers active in the region
Khabarovsk
Ten operating mines
Fourth largest gold producing region in Russia
• Existing network of local contractors and
suppliers
• Trained workforce with strong mining experience
• Access via year-round road, local airstrip and Nikolayevsk-on-Amur
Chulbatkan
seasonal commercial barge
Sakhalin Island
Synergies with Kinross’ existing activities in the Komsomolsk-on-Amur
500km
Far East
Khabarovsk
Khabarovsk Amur River
• Kinross’ Magadan office located equidistant Trans-Siberian
Railway
between Kupol and Chulbatkan Mine
50Russia January 2020
Deep Experience In-Country
Kinross has a long and successful 24-year track record investing in Russia
Significant operating experience 2018 Statistics: Kinross
• Operated 4 mines, including the high-grade, low cost investments in Russia
Kupol and Dvoinoye mines
98.5% of employees are Russian
Completed development of Kupol in 2008, and
Dvoinoye in 2013, both on time and on budget
$231 million spent on local goods
• Track record of mine life extension at both and services providers in Russia
operations $77 million in taxes and royalties
paid to the local and federal
• Continue to prioritize exploration around Kupol and
governments
Dvoinoye
$87 million in wages and benefits
• Understand regulatory and permitting environment paid to employees
• Robust network of suppliers in-country
Ranked first in environmental
• Excellent workforce with strong mining acumen responsibility and transparency
among mining companies by World
Wildlife Fund Russia
51Russia January 2020
Foreign Investment in Russia
The world’s leading companies are Foreign Investment Advisory Council
invested in Russia • Chaired by the Russian Prime Minister, includes
CEOs from over 50 international companies
52West Africa January 2020
Tasiast, Mauritania (100%)
Operating mine with a large gold resource located in a prospective district
• Successfully completed the Phase One Operating Results(3)
expansion in 2018
2018 YTD 2019
• Advancing the 24k project to further
Production
increase throughput (Au Eq. oz.)
250,965 288,124
• Estimated mine life: 2033 Production cost of sales
$976 $641
($/oz.)
2018 Gold Reserve & Resource Estimates(4)
Tonnes Grade Ounces
(thousands) (g/t) (thousands)
2P Reserves 120,838 1.9 7,207
M&I Resources 70,678 1.2 2,702
Inferred
6,322 1.9 378
Resources
(3) Refer to endnote #3.
(4) Refer to endnote #4 and the September 15, 2019 news release “Kinross to proceed with Tasisat 24k project to increase production and 53
reduce costs with low capital expenditures” available on our website.Tasiast 24k Project January 2020
Feasibility Study Results: Operating Estimates
Results Highlights Life of Mine Estimates (2020-2033)
Timeline Operational Metric Estimate Operational Metric Estimate
Total material mined 375,900,000 Total tonnes mined 628,800,000
Strip ratio 5.9
Total ore mined (tonnes) 88,200,000
Average CIL grade processed 2.2 g/t
Average annual production 563,000 ounces Total waste mined (tonnes) 540,600,000
2022-2028
Average mining cost $2.40/t Total ounces recovered 6,200,000
Average processing cost $14.20/t
Strip ratio 6.1
Production cost of sales $485/oz.
All-in sustaining cost $560/oz. Average CIL grade processed 1.8 g/t
Total tonnes mined 94,300,000 Average recovery 93%
Strip ratio 5.1
Average annual production 445,000 ounces
Average CIL grade processed 1.1 g/t
Average mining cost $2.45/t
Average annual production 281,000 ounces
2029-2033
Average mining cost $2.65/t Average processing cost $14.47/t
Average processing cost $14.20/t
Production cost of sales $585/oz.
Production cost of sales $860/oz.
All-in sustaining cost $940/oz. All-in sustaining cost $665/oz.
54Tasiast 24k Project January 2020
Feasibility Study Results: Capital & Economics
Estimated Initial Capital Cost Estimated Sustaining Capital
• Expected to be approximately $30M per year
Estimate ($ millions)
Life of Mine estimate ($ millions)
Support infrastructure 47 Mobile maintenance 150
Process plant 92
Processing plant and leaching 32
Tailings 97
Indirect, owner’s cost and taxes 47 Other / support infrastructure 105
Total $444
Contingency 24
Non-sustaining capitalized stripping
Total $150 • Expected to average $95M per year (2020-2029)
Gold Price Sensitivity Estimates
$1,100/oz. $1,200/oz. $1,300/oz. $1,400/oz. $1,500/oz. $1,600/oz.
IRR(i) (Incremental) 53% 60% 66% 72% 75% 75%
NPV(ii)
$1.3 $1.7 $2.1 $2.5 $2.8 $3.2
(billions)
Oil Price Sensitivity Estimates
$45/bbl $55/bbl $65/bbl
IRR(i) (Incremental) 61% 60% 59%
NPV(ii)
$1.8 $1.7 $1.6
(billions)
(i) Incremental to the current forecasted operational estimated based on 15,500 t/d throughput.
(ii) Based on $55/bbl oil price assumption from January 1, 2020, after-tax with a 5% discount rate 55West Africa January 2020
Chirano, Ghana (90%)
Cost reduction achieved at Chirano by transitioning to self-perform
• Chirano is an underground and open pit Operating Results(1,3)
operation located in southwestern Ghana
2018 YTD 2019
• Estimated mine life: 2021
Production
204,029 137,087
(Au Eq. oz.)
Production cost of sales
$768 $909
($/oz.)
2018 Gold Reserve & Resource Estimates(8)
Tonnes Grade Ounces
(thousands) (g/t) (thousands)
2P Reserves 6,053 2.1 415
M&I Resources 10,498 2.3 765
Inferred
3,690 2.7 325
Resources
(1) Refer to endnote #1.
(3) Refer to endnote #3. 56
(8) Refer to endnote #8.Appendix January 2020
Endnotes
1) Unless otherwise noted, gold equivalent production, gold equivalent ounces sold and production cost of sales figures in this presentation are based on Kinross’
90% share of Chirano production and sales. Also unless otherwise noted, dollar per ounce ($/oz.) figures in this presentation refer to gold equivalent ounces.
2) For more information regarding Kinross’ production, cost, overhead expense and capital expenditures outlook for 2019, please refer to the news releases dated
February 13, 2019 and November 6, 2019, which are available on our website at www.kinross.com. Kinross’ outlook for 2019 represents forward-looking
information and users are cautioned that actual results may vary. Please refer to the Cautionary Statement on Forward-Looking Information on slide 2 of this
presentation and in our news release dated November 6, 2019, available on our website at www.kinross.com.
3) Attributable production cost of sales per gold equivalent ounce sold and all-in sustaining cost per gold equivalent ounce sold are non-GAAP financial measures.
For more information and reconciliations of these non-GAAP measures for the three months and nine months ended September 30, 2019, please refer to the
news release dated November 6, 2019, under the heading “Reconciliation of non-GAAP financial measures,” available on our website at www.kinross.com.
4) For more information regarding Kinross’ preliminary estimates for mine life, life of mine production, strip ratio, all-in sustaining cost, and initial capital
expenditures, please refer to the news release dated July 31, 2019, available on our website at www.Kinross.com.
5) Mineral resource estimate is classified in accordance with the Canadian Institute of Mining, Metallurgy and Petroleum’s “CIM Definition Standards – For Mineral
Resources and Mineral Reserves” incorporated by reference into National Instrument 43-101 “Standards of Disclosure for Mineral Projects”. For more
information regarding Kinross’ mineral resource estimate for Chulbatkan, refer to the news release dated July 31, 2019 available on our website at
www.Kinross.com.
6) As part of the technical due diligence process a total of 8 diamond drill core holes at the Chulbatkan deposit were completed during August of 2018 for the
purposes of confirming historically reported grades and interpretation. A total of 2,182 metres were drilled with all diamond drill holes reported in HQ diameter.
Collar locations are reported in UTM WGS 84 Grid.
Samples were typically taken at 1.0 metre interval lengths for all diamond drill core. All samples were sawed in half and sealed in individually labelled plastic
bags for transport. All drill core samples were shipped via air freight to the independent laboratory ALS Moscow, a certified laboratory, for fire assay analysis.
QAQC samples including certified standards, blanks and field duplicates were included at an average rate of approximately 13% per sample batch.
Composite assay intervals reported in this news release are calculated by taking the weighted average off all gold fire assay values included within the interval,
high grade samples have not been capped.
The technical information about the Company’s drilling and exploration activities at Chulbatkan contained in this news release has been prepared under the
supervision of the Officer with the Company who is a “qualified person” within the meaning of National Instrument 43-101. The drill hole data base including
collar, survey, geology and assay information were reviewed by the “qualified person” and the composite assay information independently calculated and verified
for accuracy of reporting. Assay certificates for the information disclosed in this news release were verified by the Regional Director Exploration and the Site
Exploration Manager but not by the Officer as the “qualified person”.
For more information regarding the results of Kinross’ confirmatory drill program, please refer to the news release dated July 31, 2019, available on our website
at www.Kinross.com.
7) Mineral reserves and mineral resources are estimates. For more information regarding Kinross’ 2018 mineral reserve and mineral resource estimates, please
refer to our Annual Mineral Reserve and Mineral Resource Statement as at December 31, 2018 contained in our news release dated February 13, 2019, which is
available on our website at www.kinross.com. For more information regarding historical mineral reserve and mineral resource estimates for Kupol and Dvoinoye,
refer to Kinross’ Annual Mineral Reserve and Mineral Resource Statements, all of which are available on our website at www.kinross.com
57You can also read