THE ECONOMIC STATE OF U.S. FARMING - Fact Sheet By Rashmit Arora and Alexandra Bookis - The ...
←
→
Page content transcription
If your browser does not render page correctly, please read the page content below

THE ECONOMIC STATE
  OF U.S. FARMING
              Fact Sheet

   By Rashmit Arora and Alexandra Bookis
    Contributors: Eric Ford, Brooke Mays

                                           The Economic State of U.S. Farming   1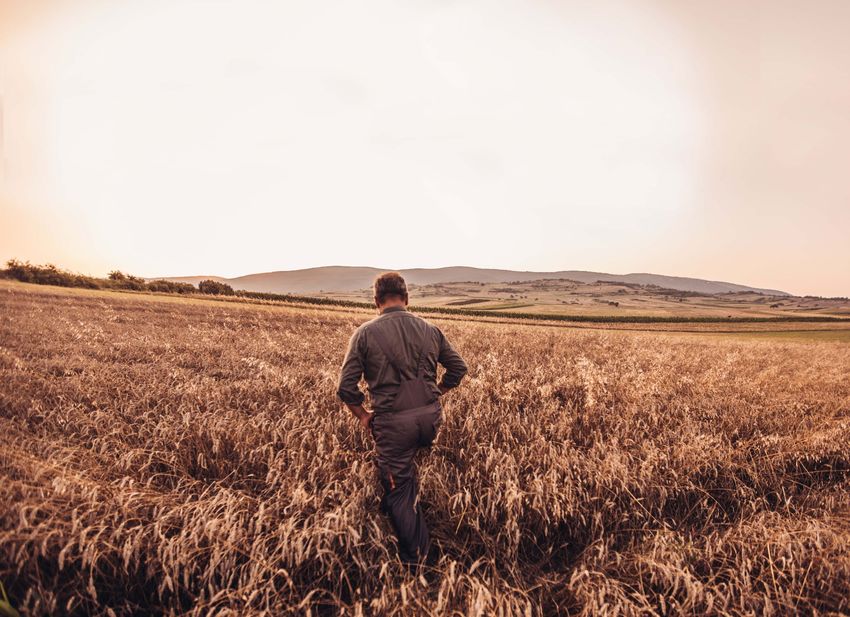
TABLE OF CONTENTS

Executive Summary........................................................................................................................................................ 3

The State of U.S. Agriculture.........................................................................................................................................4

      Farm and Farmland Statistics....................................................................................................................................4

      Farmer Demographics..............................................................................................................................................5

      Top Commodities......................................................................................................................................................6

      Contract Farming......................................................................................................................................................6

      Income......................................................................................................................................................................9

      Debt........................................................................................................................................................................11

      Government Payments............................................................................................................................................15

The Economic State of Animal Farming..................................................................................................................... 17

      Poultry.....................................................................................................................................................................17

      Dairy........................................................................................................................................................................19

      Beef Cattle..............................................................................................................................................................21

      Hog.........................................................................................................................................................................22

      Comparative Analysis..............................................................................................................................................23

Impact of COVID-19 on Farming in America............................................................................................................. 25

      Effects on Production..............................................................................................................................................25

      Federal COVID-19 Relief.........................................................................................................................................25

      Bankruptcies During COVID...................................................................................................................................26

      Animal Product Prices.............................................................................................................................................26

Concluding Remarks.................................................................................................................................................... 28

                                                                                                                                                The Economic State of U.S. Farming      2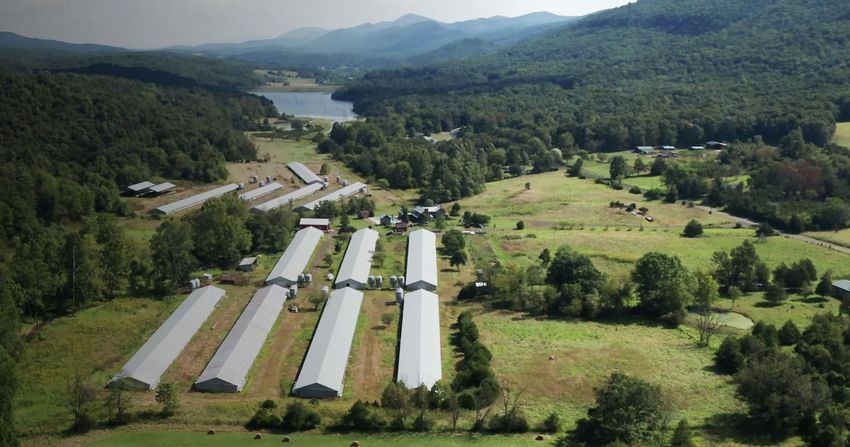
EXECUTIVE SUMMARY

Exploitation of small farmers at the hands of agribusiness giants is an overlooked social injustice in the United States. Because
animal agriculture is a leading contributor to climate change, pandemics, and profound global animal suffering, we must
understand the key role that farmers—the very core of our food system—play in solving these problems. While farmers have
shown willingness to forgo profits for stewardship, they are still driven by financial and production-oriented factors.

Transfarmation’s work centers on including farmers in the global shift from factory farming to a plant-focused agricultural
model. To bring about this shift, changemakers must approach small farmers with empathy for the economic hardship of being
trapped in the industrial agriculture complex. They must also understand the layout of policies affecting farmers to effectively
engage legislators. For all this, they need facts.

This fact sheet provides an overview of the current state of farming in the United States. Relying primarily on data from the
USDA’s National Agricultural Statistics Service, the 2017 Census of Agriculture, and the 2018 and 2019 Agricultural Resource
Management Survey, this fact sheet highlights the following:

•   U.S. land use for farming and farm production by region

•   Farmer demographics across key metrics, such as race and gender

•   Economic status of U.S. farmers, including income, debt, bankruptcy, and level of financial support from the
    federal government

•   Prevalence and implications of contract farming

•   Poultry, dairy, hog, and cattle farming, as well as comparative analyses of these against specialty-crop farming,
    which includes fresh fruits and vegetables, tree nuts, dried fruits, and nursery crops

The final section considers COVID-19’s impacts on the agricultural industry. While detailed data on the pandemic’s
effects on the agricultural community in 2020 is not publicly available as of this writing, trends point to a deepening
of inequalities.

                                                                                                The Economic State of U.S. Farming   3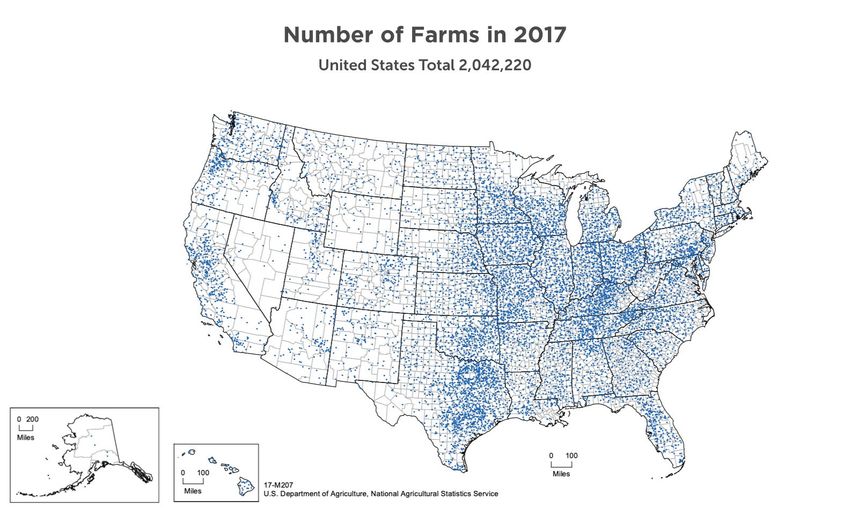
THE STATE OF U.S. AGRICULTURE
Farm and Farmland Statistics
A farm is, according to the U.S. Census Bureau since 1974, “any place from which $1,000 or more of agricultural products
were produced and sold, or normally would have been sold, during the census year.”1 Since 2005, according to the United
States Department of Agriculture (USDA) Economic Research Service (ERS), the definition of a family farm “is one in which the
majority of the business is owned by the operator and individuals related to the operator by blood, marriage, or adoption,
including relatives who do not live in the operator household.”2 Small family farms have a gross cash farm income under
$350,000; midsize family farms earn between $350,000 and $999,999; large family farms earn over $1 million.3

•        The 2017 Census of Agriculture reports that there are 2,042,220 farms in the United States, a 3.2 percent decrease from
         the 2,109,303 farms in the 2012 census.4 Since peaking in 1935, the number of farms has gradually declined.5

•        Nearly half of the farms in the 2017 census are devoted to raising animals:

         ·     652,289 beef cattle farms6

         ·     164,099 poultry and egg farms7

         ·     40,336 dairy farms8

         ·     64,871 hog farms9

•        More recent data from 2019 indicates that the number of farms in the United States is about 2,023,400.10

•        In the United States, two out of five acres of land are farmland, amounting to 900 million acres.11 Agricultural land is
         concentrated in the West and Midwest.

         ·     Counties in Tennessee, Kentucky, and eastern Texas have the highest farm densities.12

         ·     Between 2012 and 2017, California, Pennsylvania, and Minnesota had the largest declines in the number of farms.13

United States Department of Agriculture National Agricultural Statistics Service, 2017 Census of Agriculture Highlights: Farms and Farmland (Washington, DC: USDA NASS, 2019), 1.
1

“Glossary,” United States Department of Agriculture Economic Research Service, last updated November 27, 2019, https://www.ers.usda.gov/topics/farm-economy/farm-household-well-
2

being/glossary.aspx#:~:text=The%20current%20definition%20of%20a,live%20in%20the%20operator%20household.
“Farm Structure,” United States Department of Agriculture Economic Research Service, last updated January 16, 2020, https://www.ers.usda.gov/topics/farm-economy/farm-structure-and-
3

organization/farm-structure/.
USDA NASS, Farms and Farmland, 1.
4

“Farming and Farm Income,” United States Department of Agriculture Economic Research Service, last updated November 10, 2020, https://www.ers.usda.gov/data-products/ag-and-food-
5

statistics-charting-the-essentials/farming-and-farm-income/.
USDA NASS, Farms and Farmland, 2. The figure for beef cattle farms was obtained by subtracting the number of dairy farms (40,336) from that of cattle and dairy farms in total (692,625).
6

United States Department of Agriculture National Agricultural Statistics Service, 2017 Census of Agriculture Highlights: Poultry and Egg Production (Washington, DC: USDA NASS, 2020), 1.
7

United States Department of Agriculture National Agricultural Statistics Service, 2017 Census of Agriculture Highlights: Dairy Cattle and Milk Production (Washington, DC: USDA NASS, 2019), 1.
8

United States Department of Agriculture, 2017 Census of Agriculture: United States, Summary and State Data, Geographic Area Series, vol. 1, part 51 (Washington, DC: USDA, 2019), 10.
9

10
    United States Department of Agriculture National Agricultural Statistics Service, Farms and Land in Farms: 2019 Summary (Washington, DC: USDA NASS, 2020), 4.
11
    USDA NASS, Farms and Farmland, 1.
12
    USDA NASS, Farms and Farmland, 2.
13
    USDA NASS, Farms and Farmland, 2.

                                                                                                                                            The Economic State of U.S. Farming                    4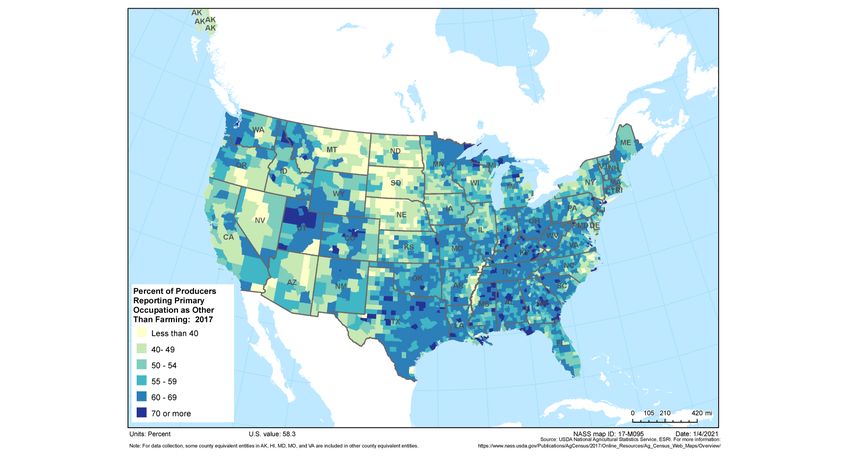
•         The map below shows the distribution of farms per the 2017 census.14

                                          Figure 1. Map showing the distribution of farms in the United States. One dot equals 200 farms.

•         In total, 54 percent of U.S. farmland is occupied by animal operations:15

          ·     Cattle (meat and dairy): 44 percent

          ·     Poultry (meat and eggs): 1 percent

          ·     Hogs and pigs: 1 percent

          ·     Other animals: 8 percent

•         The distribution of farmland is extremely unequal. Four percent of U.S. farms control 58 percent of all farmland,
          while 13 percent of U.S. farms control 0.14 percent of farmland.16

•         Forty percent of U.S. farmland is rented.17

Farmer Demographics
•         According to the 2017 census, there are 3.4 million farm producers in the United States.18 The census saw a
          6.9 percent increase from 2012, but this is partially due to the census questionnaire and its broadening of the
          definition of “farm producer” to someone involved in making decisions for a farm.19

•         The average age of farmers is 57.5 years.20

•         Sixty-four percent of farmers are male; 36 are female.21

14
     United States Department of Agriculture National Agricultural Statistics Service, 2017 Census of Agriculture, Ag Census Web Maps, last modified September 30, 2019, www.nass.usda.gov/
Publications/AgCensus/2017/Online_Resources/Ag_Census_Web_Maps/Overview/.
15
     USDA NASS, Farms and Farmland, 2.
16
     USDA NASS, Farms and Farmland, 2.
17
     USDA NASS, Farms and Farmland, 2.
18
     United States Department of Agriculture National Agricultural Statistics Service, 2017 Census of Agriculture Highlights: Farm Producers (Washington, DC: USDA NASS, 2019), 1.
19
     USDA NASS, Farm Producers, 1.
20
     USDA NASS, Farm Producers, 1.
21
     USDA NASS, Farm Producers, 2.

                                                                                                                                            The Economic State of U.S. Farming                5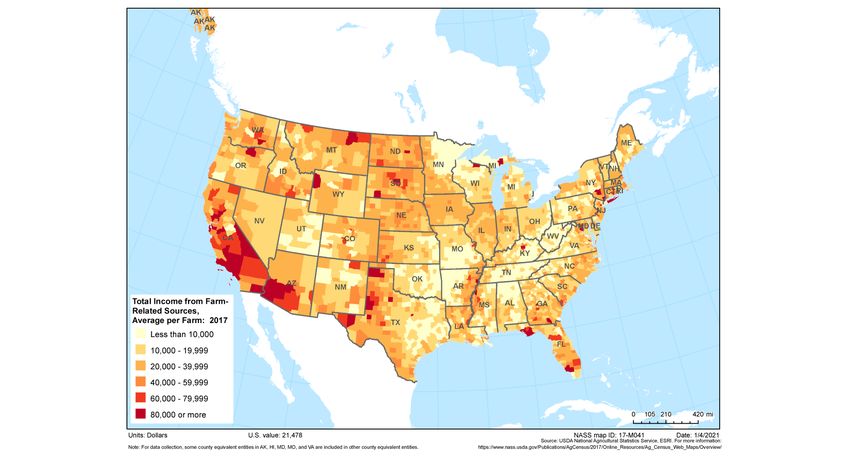
•         Sixty-one percent of farmers report working off-farm; 58 percent report a primary occupation other than farming.22

•         Ninety-five percent of farmers identify as white, 3 percent Hispanic, 1.7 percent Native American/Alaskan Native, 1.3
          percent Black, 0.6 percent Asian, 0.1 percent Native Hawaiian/Pacific Islander, and 0.8 percent multiracial.23

Top Commodities
Total U.S. agricultural sales in 2017 were $388.5 billion.24 The top commodities were as follows:25

Contract Farming
The ERS defines a farming contract as “a legal agreement between a farm operator (contractee) and another person or firm
(contractor) to produce a specific type, quantity, and quality of agricultural commodity” and classifies contracts as either
marketing or production:26

          Marketing Contracts: Ownership of the commodity remains with the farmer during production. The contract sets a price
          (or a pricing formula), product quantities and quality, and a delivery schedule. Contractor involvement in production under
          this contract type is minimal. For crops, the contract is finalized before harvest. For livestock, the contract is finalized before
          the animals are ready to be sold.

          Production Contracts: The contractor has more involvement in the production process, often providing specific inputs
          and services, production guidelines, and technical advice to the grower, who receives a contract fee for raising the
          commodity. The contractor usually owns the commodity during production and transfers it from the contract grower’s farm
          upon completion of the production cycle. In livestock contracts, for example, contractors typically provide feed, veterinary
          services, transportation, and young animals. The contract is finalized before production of the commodity.

Vertical integration is a business structure in which a company owns or otherwise controls operations at multiple stages of the
production process. Contract farming is a form of vertical integration in agriculture. Production contracts are often used for
U.S. livestock farms, especially poultry and hog farms. Small farmers, also called household operators, sign a contract in which
the integrator owns the animals or eggs during production, and the farmer is paid when the production process is complete.
Growers are paid relative to their peers in a tournament system, not according to absolute performance.27

22
     USDA NASS, Farm Producers, 2.
23
     USDA NASS, Farm Producers, 2.
24
     United States Department of Agriculture National Agricultural Statistics Service, 2017 Census of Agriculture Highlights: Farm Economics (Washington, DC: USDA NASS, 2019), 1.
25
     USDA NASS, Farm Economics, 2.
26
     “Contracting,” United States Department of Agriculture Economic Research Service, last updated January 16, 2020, https://www.ers.usda.gov/topics/farm-economy/farm-structure-and-
organization/contracting/.
27
     James M. MacDonald, “Financial Risks and Incomes in Contract Broiler Production,” Amber Waves, USDA Economic Research Service, August 4, 2014, https://www.ers.usda.gov/amber-
waves/2014/august/financial-risks-and-incomes-in-contract-broiler-production/.

                                                                                                                                            The Economic State of U.S. Farming           6
In this tournament system, all growers receive a set base pay, but those who maintain lower input costs relative to the
average input costs of their peer growers receive a premium over the base fee.28 The premium is usually based on the size
of the cost differential between the best-performing farmer and the worst-performing farmer. In other words, the farmer that
produces the heaviest chickens for the least input wins. This introduces high income discrepancies between growers and
inconsistent paychecks.
Contracts reward low-cost production, but cost is determined by factors beyond a grower’s control, such as feed and chick
quality. A grower who has several chickens die due to weather or illness will deliver fewer live-weight pounds to the processing
plant and will, therefore, have higher cost per pound.29 Additional risks and inconsistencies stem from league composition,
which can vary considerably from round to round. A USDA article illustrates this risk:30
The average broiler processing plant handles about 1.12 million birds per week, and the average grower delivers
about 90,000 birds at a time; at that rate, about 12 growers would be competing in a tournament in an average week.
If the group delivering in one week happened to have three exceptional growers, and the group delivering in the next
week had just one, then any given grower would be likely to have a much better relative performance, and better
compensation, if he or she were delivering in the later week. This is a pure risk, in that the grower has no control over
the identity of the other growers in the group, and the addition or subtraction of one or two exceptional (or lucky)
growers can have a meaningful impact on group averages when the group is small.
Furthermore, because production contracts require heavy investment in specific assets and because the number of companies,
or “integrators,” in a given area is limited, small farmers often have little if any choice in the company they grow for.31 Half of
U.S. poultry contractors report having only one or two integrators,32 which has been shown to result in lower fees for growers.33
Because of the limited number of integrators, many poultry growers are restricted and unable to explore other contracting or
production options.
• Of the $58 billion in agricultural production that production contracts covered in 2013, $48 billion was in two commodity
classes—hogs and poultry.34
• In 2017, 49 percent of livestock production was under contract, while 21 percent of crop production was under contract.35
• In animal agriculture, contracts are most prevalent in poultry and hog farming; 90 percent of poultry farming is under
contract, while over 60 percent of hogs are raised under contract.36
• In crop farming, tobacco production is the most contracted, with 90 percent under contract.37
MacDonald, “Financial Risks.”
28
MacDonald, “Financial Risks.”
29
MacDonald, “Financial Risks.”
30
James M. MacDonald, “Trends in Agricultural Contracts,” Choices 30, no. 3 (2015): 5.
31
MacDonald, “Trends,” 5.
32
James M. MacDonald and Nigel Key, “Market Power in Poultry Production Contracting? Evidence from a Farm Survey,” Journal of Agricultural and Applied Economics 44, no. 4 (November
33
2012): 488.
MacDonald, “Trends,” 5.
34
James M. MacDonald and Christopher Burns, “Marketing and Production Contracts Are Widely Used in U.S. Agriculture,” Amber Waves, July 1, 2019, https://www.ers.usda.gov/amber-
35
waves/2019/july/marketing-and-production-contracts-are-widely-used-in-us-agriculture/.
MacDonald and Burns, “Marketing and Production Contracts.”
36
MacDonald and Burns, “Marketing and Production Contracts.”
37
The Economic State of U.S. Farming 7• Over half (58 percent) of farms with contracts are small family farms,38 those with less than $350,000 in annual sales.39 Of
U.S. farms with contracts, about 15 percent are large family farms with over $1 million in sales.40 But the value of production
is concentrated at the top, with large farms making up 46.8 percent, or nearly half, of the total value of contracted
production, as shown in the charts below.41
Figure 2. Pie charts showing the percentage of U.S. farms with contracts and the value of production under contract.
• Small family farms tend to raise poultry and hogs, while large family farms with contracts tend to grow crops. Nearly 40
percent of livestock production under contract is attributed to small family farms.42
38
“Contracting,” USDA.
39
MacDonald and Burns, “Marketing and Production Contracts.”
40
MacDonald and Burns, “Marketing and Production Contracts.”
41
“Contracting,” USDA.
42
MacDonald and Burns, “Marketing and Production Contracts.”
The Economic State of U.S. Farming 8Income
• The average U.S. farmer’s total income from farm-related sources was $21,478 in 2017.43
Figure 3. Map showing average U.S. farmer income from farm-related sources.
The annual USDA Agricultural Resource Management Survey captures nationally representative data on several financial
metrics.44 (Look here for information on ARMS methodology and for differences between the 2018 and 2019 surveys.45 Please
refer to the 2019 ARMS questionnaire for the survey design.46)
Median Net Farm
Cattle Dairy Poultry Hog
Income
2019 -$370 $74,483 $17,862 $19,318
2018 $1,446 $40,855 $13,140 $10,741
• As the above are median incomes, half the farmers in these industries earned less than the stated amounts.
• Most small farmers rely on off-farm sources of income to make ends meet.47 The following statistics show the income
breakdown in dollars per household between on-farm and off-farm sources according to 2019 ARMS data:48
43
USDA, 2017 Census: Summary and State Data, 17.
44
“ARMS Farm Financial and Crop Production Practices,” United States Department of Agriculture Economic Research Service, last updated July 7, 2020, https://www.ers.usda.gov/data-
products/arms-farm-financial-and-crop-production-practices/?modal=17882.
45
“Documentation,” United States Department of Agriculture Economic Research Service, last updated December 18, 2020, https://www.ers.usda.gov/data-products/arms-farm-financial-and-
crop-production-practices/documentation.
46
United States Department of Agriculture Economic Research Service, 2019 Agricultural Resource Management Survey (Washington, DC: USDA ERS, 2019).
47
“Farming and Farm Income,” USDA.
48
United States Department of Agriculture Economic Research Service, Tailored Reports (operator household income by production specialty, 2019), accessed December 29, 2020, https://
my.data.ers.usda.gov/arms/tailored-reports.
The Economic State of U.S. Farming 9Cattle Dairy Poultry Hog Specialty
(fruits, vegetables, nuts)
Total Household
$103,614 $186,610 $114,613 $179,322 $240,906
Income
On-Farm $100 $143,691 $40,449 $91,899 $57,244
Off-Farm $103,514 $42,919 $74,165 $87,423 $183,662
• The map below highlights the geographical distribution of producers who report a primary occupation other than farming.
Figure 4. Map showing the percentage of U.S. farmers reporting primary occupation other than farming.
• There are deep inequalities in the distribution of U.S. farm sales. In 2017 the top 4 percent of farms accounted for 69
percent of U.S. farm sales, while the bottom 76 percent of farms made up a mere 3 percent of sales.49
Sales Class Percentage of Farms Percentage of Sales
$5,000,000+ 1 35
$1,000,000–$4,999,999 3 34
$250,000–$999,999 8 21
$50,000–$249,999 12 8
< $50,000 76 3
49
USDA NASS, Farm Economics, 1.
The Economic State of U.S. Farming 10• While most farms are small (i.e., earning less than $350,000 in annual gross cash farm income), large farms account
for the bulk of production. In 2019, large-scale family farms made up 44 percent of production value but only 3 percent
of U.S. farms.50
• Farm-related income fell by 9 percent between 2012 and 2017 for all U.S. farms, while production expenses decreased
by only 1 percent.51 Average net income dropped by 5 percent during the same period.52
• According to a recent analysis by Agricultural Economic Insights, trends in net farm income over the past decade vary
substantially at the state level.53
Figure 5. Map showing changes in average state-level net farm income from 2011–2013 to 2018–2019.
(Agricultural Economic Insights calculations based on USDA ERS data.)
Debt
Farmers in industrial animal agriculture face rising debt that falls into one of two categories:
Real Estate Debt: This is debt related to real estate expenditures. Today, more than half of farmers’ debt is real estate
debt, which they may owe to banks or other owners of their property and assets. This debt is heavily concentrated in the
Farm Credit system and in commercial banks rather than owed to individual owners.
Non-real Estate Debt: All other farm debt is classified as non-real estate debt. This might include debt on machinery
and equipment and other operating expenses. Non-real estate debt is concentrated in the Farm Credit system, in
commercial banks, and among individuals. High levels of such debt make farmers especially vulnerable to fluctuations
in farmland values.54
50
“Farming and Farm Income,” USDA.
51
USDA NASS, Farm Economics, 2.
52
USDA NASS, Farm Economics, 2.
53
David Widmar, “A Geographical Look at Net Farm Income and Direct Payment Trends,” Agricultural Economic Insights, October 12, 2020, https://aei.ag/2020/10/12/a-geographical-
look-at-net-farm-income-and-direct-payment-trends/?utm_source=Agricultural+Economic+Insights&utm_campaign=5cf458af02-EMAIL_CAMPAIGN_2018_10_15_02_36_COPY_01&utm_
medium=email&utm_term=0_6f5fb3d56c-5cf458af02-451355253.
54
Brian Briggeman, “Farm Balance Sheets: The Hidden Risks of Non-real Estate Debt,” Main Street Economist, 2011, 1.
The Economic State of U.S. Farming 11The type of debt and share of total farm debt vary by creditor.55
Figure 6. Bar chart showing type and share of farmer debt by creditor, end of 2017. (Farm Bureau calculations based on USDA ERS data.
“Who Holds Farm Debt,” American Farm Bureau Federation, January 24, 2019.)
Credit card debt falls under non-real estate debt and is increasingly problematic among smallholder farmers; some farmers
report upwards of $120,000 in operating expenses charged to credit cards.56 Credit debt is largely due to widespread lack of
good loan options and mostly takes the form of operating expenses. This debt is especially troubling because it worsens credit
scores, which hinders farmers’ access to additional funding that may be needed to sustain contracts with integrators. Producers
with high non-real estate debt would be at greater risk of bankruptcy if land values fell.57
Some Stats:
• According to an analysis of Small Business Administration-backed loans, between 2010 and 2016, the average loan to a
poultry grower was $695,000.58 In comparison, the average loan to a cattle rancher was $788,000 and $871,000 to a hog
farmer. The average for all Small Business Administration loans in the same period was $277,000.59
· Additionally, nearly all contract animal growers make under $300,000 in gross annual income.60
Kevin Patrick and Ryan Kuhns, “Trends in Farm Sector Debt Vary by Type of Debt and Lender,” Amber Waves, July 5, 2016, https://www.ers.usda.gov/amber-waves/2016/july/trends-in-farm-
55
sector-debt-vary-by-type-of-debt-and-lender/.
Chris Clayton, “Farms on the Margins,” Progressive Farmer, March 19, 2019, https://www.dtnpf.com/agriculture/web/ag/news/world-policy/article/2019/03/19/debt-figures-raise-questions-
56
whether.
Briggeman, “Farm Balance Sheets,” 1.
57
Christopher Walljasper, “Poultry Growers, Caught Between Strict Rules and Financial Risk, Lean Heavily on Government-Backed Loans,” Midwest Center for Investigative Reporting,
58
December 11, 2018, https://investigatemidwest.org/2018/12/11/poultry-growers-caught-between-strict-rules-and-financial-risk-lean-heavily-on-government-backed-loans/.
Walljasper, “Poultry Growers.”
59
MacDonald, “Financial Risks.”
60
The Economic State of U.S. Farming 12Figure 7. Bar chart showing average loan values for various operations in animal production. (Midwest Center
for Investigative Reporting calculations based on Small Business Administration data.)
• Holders of farm sector real estate debt include the Farm Credit system, commercial banks, life insurance companies,
individuals, Farmer Mac, the Farm Service Agency, and CCC storage and drying loans.61 Holders of farm sector non-real
estate debt also include the Farm Credit system, commercial banks, the Farm Service Agency, and individuals.
Figure 8. Pie charts showing percentage of farm-sector debt, real estate and non-real estate, by holder.
(Farm Bureau calculations based on USDA ERS data.)
61
“Who Holds Farm Debt,” American Farm Bureau Federation, January 24, 2019, https://www.fb.org/market-intel/who-holds-farm-debt.
The Economic State of U.S. Farming 13• As of 2018, commercial banks were the largest creditors in agriculture.62 Collectively, they hold 41 percent of total farm
debt: 47 percent of non-real estate debt and 37 percent of real estate debt. Customer-owned cooperative Farm Credit
comprises institutions that are collectively the second-largest creditor, holding 40 percent of farm debt: 33 percent of non-
real estate debt and 45 percent of real estate debt.
• Per USDA data and our own calculations,63 the largest holders of farm debt by far are farm credit unions and commercial
banks, which collectively hold 82 percent of farm debt.
• Farmers’ real estate debt is expected to reach $281.6 billion in 2020, a 5.5 percent annual increase and a 4.7 percent
increase adjusted for inflation.64 Real estate debt is expected to account for 64.9 percent of total farm debt in 2020.
(Projections for 2020 were made before the coronavirus pandemic.)
Bankruptcies
• Chapter 12 bankruptcy is designed for family farmers and fishermen.65
• According to data released by the U.S. courts in January 2020, farm bankruptcies grew by almost 20 percent in 2019
from 2018.66
• Family farmers filed 595 Chapter 12 bankruptcies in 2019, which was the most in eight years.67
Figure 9. Bar chart showing the number of Chapter 12 bankruptcies filed in the United States by year.
62
“Who Holds Farm Debt,” Farm Bureau.
63
“Assets, Debt, and Wealth,” United States Department of Agriculture Economic Research Service, last updated September 2, 2020, https://www.ers.usda.gov/topics/farm-economy/farm-
sector-income-finances/assets-debt-and-wealth/.
64
“Assets, Debt, and Wealth,” USDA ERS.
65
“Chapter 12—Bankruptcy Basics,” United States Courts, accessed November 11, 2020, https://www.uscourts.gov/services-forms/bankruptcy/bankruptcy-basics/chapter-12-bankruptcy-basics.
66
“Bankruptcy Filings Increase Slightly,” United States Courts, January 28, 2020, https://www.uscourts.gov/news/2020/01/28/bankruptcy-filings-increase-slightly.
67
“Bankruptcy Filings Increase Slightly,” U.S. Courts.
The Economic State of U.S. Farming 14Government Payments
Subsidies
• In 2020, the federal government delivered the highest subsidies payment of the past 14 years.
Direct government payments to farmers are expected to total $46.5 billion in 2020, a 107 percent increase from
the $22.5 billion in 2019.68
Average government payments to U.S. farms increased by 43 percent between 2018 and 2019.69
• Agricultural Economic Insights estimates that between the 2011–2013 and 2018–2019 periods, direct payments to farmers
more than doubled.70
• Government payments vary strongly on a state-by-state basis.
Figure 10. Map showing direct government payments as a share of net farm income, average of 2018–2019.
(Agricultural Economic Insights calculations based on USDA ERS data.)
68
“2020 Farm Sector Income Forecast,” United States Department of Agriculture Economic Research Service, last updated December 2, 2020, https://www.ers.usda.gov/topics/farm-economy/
farm-sector-income-finances/farm-sector-income-forecast.
69
United States Department of Agriculture Economic Research Service, Tailored Reports (government payments, farm payment status, 2018 and 2019), accessed December 29, 2020, https://
my.data.ers.usda.gov/arms/tailored-reports.
70
Widmar, “Geographical Look at Net Farm Income.”
The Economic State of U.S. Farming 15Loans from the federal government through the Farm Service Agency (FSA):
• Farm operating loans start, maintain, or strengthen a farm or ranch.71 They are available up to $400,000.72 Microloans
support smaller and untraditional farm operations.73 Farm ownership loans are available for a variety of purposes to
improve and expand family farms, with a maximum loan of $600,000.74 Guaranteed farm loans assist farmers in their
efforts to obtain loans from commercial lenders with the intention of buying farmland or financing production.75 Farmers
can take out a loan of up to $1,776,000 through commercial lenders (banks, Farm Credit institutions, or credit
unions).76 Farm loans have a maximum repayment term of 40 years for both direct and guaranteed loans. Farmers apply
for these loans through local FSA offices. Guaranteed loans also require applications to a participating commercial lender.
Targeted Loans:
• Loans for beginning farmers focus on “beginning farmers” who are still in their first 10 years of business.77
Maximum loan amounts:
The maximum loan for direct farm ownership is $600,000.
The maximum loan for direct operation is $400,000.
Microloans max out at $50,000 each for farm ownership and operation.
A loan for a farm down payment requires a cash down payment that is a minimum of 5 percent of the total
purchase price of the farm.
The loan cannot exceed 45 percent of the farm’s purchase price, the farm’s appraised value, or $667,000.
The interest rate is between 1.5 percent and 4 percent below the direct farm ownership rate.
In 2019, FSA gave out $2.7 billion in 18,354 beginning farmer loans across the United States.78 This was up from
$2.5 billion in 19,743 loans in 2018. Accounting for all types of loans, FSA gave out 38,408 loans in 2017 and
34,628 loans in 2018.79
However, as of 2018, only 2.6 percent of total U.S. farm debt was owed to FSA.80
• Youth loans are given to people between 10 and 20 years of age who plan to become farmers, and the loans are
processed in connection with an agricultural youth organization, such as a 4-H or FFA.81
• A portion of all major loan funds are allocated for ethnic and racial minorities and for women.82
71
“Farm Operating Loans,” United States Department of Agriculture Farm Service Agency, accessed November 11, 2020, https://www.fsa.usda.gov/programs-and-services/farm-loan-
programs/farm-operating-loans/index.
72
“Farm Operating Loans,” USDA FSA.
73
“Microloan Programs,” United States Department of Agriculture Farm Service Agency, accessed November 11, 2020, https://www.fsa.usda.gov/programs-and-services/farm-loan-programs/
microloans/index.
74
“Farm Ownership Loans,” United States Department of Agriculture Farm Service Agency, accessed November 11, 2020, https://www.fsa.usda.gov/programs-and-services/farm-loan-
programs/farm-ownership-loans/index.
75
“Guaranteed Farm Loans,” United States Department of Agriculture Farm Service Agency, accessed November 11, 2020, https://www.fsa.usda.gov/programs-and-services/farm-loan-
programs/guaranteed-farm-loans/index.
76
“Guaranteed Farm Loans,” USDA FSA.
77
“Beginning Farmers and Ranchers Loans,” United States Department of Agriculture Farm Service Agency, accessed November 11, 2020, https://www.fsa.usda.gov/programs-and-services/
farm-loan-programs/beginning-farmers-and-ranchers-loans/index.
78
“Program Data,” United States Department of Agriculture Farm Service Agency, accessed November 11, 2020, https://www.fsa.usda.gov/programs-and-services/farm-loan-programs/
program-data/index.
79
“Program Data,” USDA FSA.
80
Jim Monke, Agricultural Credit: Institutions and Issues (Washington, DC: Congressional Research Service, 2018), 1.
81
“Youth Loans,” United States Department of Agriculture Farm Service Agency, accessed November 11, 2020, https://www.fsa.usda.gov/programs-and-services/farm-loan-programs/youth-
loans/index.
82
“Minority and Women Farmers and Ranchers,” United States Department of Agriculture Farm Service Agency, accessed November 11, 2020, https://www.fsa.usda.gov/programs-and-
services/farm-loan-programs/minority-and-women-farmers-and-ranchers/index.
The Economic State of U.S. Farming 16THE ECONOMIC STATE OF ANIMAL FARMING
Poultry
• The combined value of poultry production in 2019 was $40.4 billion, which marks a 13 percent decrease from $46.2 billion
in 2018.83
Seventy percent of the value was from broilers, 19 percent from eggs, 11 percent from turkeys, and less than 1
percent from non-broiler chickens.
Production value by poultry type:
$28.3 billion for broilers in 2019, an 11 percent decrease from 2018
$4.3 billion for turkeys in 2019, a 14 percent increase from 2018
$7.7 billion for all eggs in 2019, a 28 percent decrease from 2018
$37.6 million for chickens (excluding broilers) in 2019, a 24 percent decrease from 2018
• In 2017, 164,099 farms produced and sold poultry and eggs.84
Twenty-seven percent of these farms specialized in poultry/egg production that accounted for 98 percent of sales.
The number of poultry farms increased 19 percent from 137,541 in 2012.
• In 2017, 97 percent of poultry and egg farms were family farms.85
• Total U.S. sales of poultry and eggs were $49.2 billion, a 15 percent increase from 2012. This accounts for 12.7 percent of
U.S. agricultural sales.86
• The top three states in poultry sales were Georgia, North Carolina, and Arkansas, accounting for one-third of all U.S. sales.87
Each state sold more than $5 billion in poultry and eggs.
• In total, 8.9 billion broilers and other meat chickens were sold in 2017.88
• A greater proportion of poultry and egg producers were beginning farmers (10 or fewer years of experience) at 37 percent
compared with 27 percent of all U.S. producers.89
Additionally, more poultry and egg producers (52 percent) reported their primary occupation as farming compared
with all U.S. producers (42 percent).
A higher percentage of poultry and egg producers were women (40 percent) compared with all U.S. producers (36
percent).
• In 2011, 97 percent of broiler chickens were raised at contracted farms.90
• Broiler production continued to consolidate to larger farms. More than half of broilers in 2011 were raised at farms with at
least five broiler houses.91
• Contract broiler farmers reported higher average annual incomes than other U.S. farmers in 2011, but the range of income
in broiler farming was much wider than in other types of farming.92
83
United States Department of Agriculture, Poultry—Production and Value: 2019 Summary (Washington, DC: USDA, April 2020), 5.
84
USDA NASS, Poultry and Egg Production, 1.
85
USDA NASS, Poultry and Egg Production, 2.
86
USDA NASS, Poultry and Egg Production, 1.
87
USDA NASS, Poultry and Egg Production, 1.
88
USDA NASS, Poultry and Egg Production, 1.
89
USDA NASS, Poultry and Egg Production, 2.
90
James M. MacDonald, Technology, Organization, and Financial Performance in U.S. Broiler Production (Washington, DC: USDA Economic Research Service, June 2014), 13.
91
MacDonald, Technology, iv.
92
MacDonald, Technology, iv.
The Economic State of U.S. Farming 17Income and Debt in Poultry Production
• Forty-five percent of U.S. poultry farmers incur a loss (negative net income).93
• Median net income for poultry farmers in 2019 was $17,862.94
• Of poultry farmers, 41 percent have debt.95
• In 2011, chicken farmers operated with $5.2 billion in combined debt.96
• A study published in 2010 on the economics of U.S. contract poultry production revealed these findings:
Payments from contract farming are insufficient for growers to earn competitive returns.97
“Contract poultry growers are now living off depreciation.”98
The tournament pay system does not “mimic a competitive market.”99
Wealthy contract chicken farmers are extremely rare, and the exceptions are those who have “sweetheart deals” with
corporate insiders.100
“Often the biggest risk of all is that of bankruptcy. Integrator acts and demands, not grower’s mismanagement, is the
problem. Delayed delivery of chicks, reduced placement, or similar actions by the integrator can have a devastating
effect on the profitability of the contract poultry operation. A decision by the integrator to slow delivery of chicks to a
grower can mean quick bankruptcy for that grower.”101
• According to guidelines by University of Georgia’s extension department, egg farmers can expect to invest up to $280,000
per house, while earning an annual net income between $10,000 and $15,000 per house during loan repayment.102
• Poultry farmers often get stuck on the debt treadmill of chicken farming:
Figure 11. Flow chart showing the “debt treadmill” of chicken farmers. (Adapted from Rural Advancement Foundation International,
“What Debt in Chicken Farming Says About American Agriculture,” RAFI USA, July 12, 2016.)
USDA NASS, Poultry and Egg Production, 2.
93
United States Department of Agriculture Economic Research Service, Tailored Reports (farm business income statement; 2019; median; production specialty: poultry), accessed December 30,
94
2020, https://my.data.ers.usda.gov/arms/tailored-reports.
United States Department of Agriculture Economic Research Service, Tailored Reports (farm business debt repayment capacity; 2019; median; production specialty: poultry), accessed
95
December 30, 2020, https://my.data.ers.usda.gov/arms/tailored-reports.
MacDonald, Technology, 15.
96
C. Robert Taylor and David A. Domina, Restoring Economic Health to Contract Poultry Production (Omaha, NE: Domina Law Group, 2010), 8.
97
Taylor and Domina, Restoring Economic Health, 15.
98
Taylor and Domina, Restoring Economic Health, 22.
99
100
Taylor and Domina, Restoring Economic Health, 18.
101
Taylor and Domina, Restoring Economic Health, 21.
102
Dan L. Cunningham, Guidelines for Prospective Contract Hatching Egg Producers (Athens, GA: University of Georgia Cooperative Extension, 2012), 3.
The Economic State of U.S. Farming 18Figure 12. Illustration showing the distribution of assets and responsibilities between integrators and contract farmers. (Adapted from Foodopoly.org.)
Dairy Farming
• In 2017, the United States was home to 40,336 dairy farms.103
Eighty-nine percent of these were specialized dairy farms that accounted for 98 percent of all milk sold that year.
Ninety-five percent of dairy farms were family farms.
• The number of dairy operations has declined sharply, from 648,000 in 1970 to 75,000 in 2006.104 In 2019, the country saw
the largest annual decline in the number of licensed dairy operations in 15 years.105 There were 3,281 fewer U.S. dairy
operations in 2019 than in 2018, totaling 34,187 farms.106 Between 1970 and 2019, the number of dairy operations
decreased 95 percent.
• Consolidation is active in U.S. dairy farming.
Of the dairy farms counted in the 2017 Census of Agriculture, 30,373 were small commercial farms with only 10–199
cows, a decrease from 47,873 farms in 2007.107
The midpoint for dairy herd size in 2017 was 1,300 cows, an increase from 80 cows in 1987.108
• Forty-four percent of U.S. farmland in 2017 was used for cattle and dairy production.109 Another 30 percent was used for
oilseed and grain production, a significant portion of which was used to grow feed crops for livestock.
• There were 9.5 million milk cows in the United States in 2017, a 3.4 percent increase from the 2012 census.110
The number of milk cows in the United States dropped 0.7 percent from 2019 to 2020, totaling 9.33 million in 2020.111
103
USDA NASS, Dairy Cattle and Milk Production, 1.
104
James M. MacDonald et al., Profits, Costs, and the Changing Structure of Dairy Farming (Washington, DC: USDA Economic Research Service, 2007), 2.
105
“Largest Decline in U.S. Dairy Farms in 15-Plus Years in 2019,” American Farm Bureau Federation, February 28, 2020, https://www.fb.org/market-intel/largest-decline-in-u.s.-dairy-farms-in15-
plus-years-in-2019#:~:text=There%20were%203%2C281%20fewer%20licensed,2003%20to%2034%2C187%20in%202019.
106
United States Department of Agriculture National Agricultural Statistics Service, Milk Production (Washington, DC: USDA NASS, February 2020), 18.
107
James M. MacDonald, Jonathan Law, and Roberto Mosheim, Consolidation in U.S. Dairy Farming (Washington DC: USDA Economic Research Service, 2020), iii.
108
MacDonald, Law, and Mosheim, Consolidation, iii.
109
USDA NASS, Farms and Farmland, 2.
110
USDA NASS, Dairy Cattle and Milk Production, 1.
111
United States Department of Agriculture National Agricultural Statistics Service, Cattle (Washington, DC: USDA NASS, January 2020), 1.
The Economic State of U.S. Farming 19• Sales of cow’s milk totaled $36.7 billion in 2017.112
• The five leading states in dairy farming are California, Wisconsin, New York, Idaho, and Texas, accounting for 50 percent of
milk-cow inventory and 51 percent of milk sales.113
• Dairy cow production is consolidating to larger farms.114
The proportion of the milk herd on smaller operations (< 1,000 cows) dropped from 51 percent to 45 percent between
2012 and 2017.
The proportion of the milk herd on larger operations (2,500+ cows) increased from 29 percent to 35 percent.
Midsize dairy operations remained consistent at 20 percent of the milk herd.
• The production costs of dairy farms specializing in dairy cattle and milk production totaled $33.3 billion in 2017, a 1.6
percent increase from the 2012 census.115
Feed for cows is the most expensive item in dairy farming, accounting for 45 percent of farmers’ production expenses.
Income and Debt in Dairy
• Sales of cow’s milk totaled $36.7 billion in 2017.116
The smallest farms with herds of one to nine milk cows made up 0.08 percent of sales, and farms with herds of 10–19
cows made up 0.29 percent of total milk sales (combined, the two smallest farm sizes represented only 0.37
percent of sales).
The three largest farm sizes (1,000–2,499 cows, 2,500–4,999 cows, and 5,000+ cows) combined represented 56.4
percent of total milk sales.
• Organic sales by specialized dairy farms totaled $1.5 billion, which is 21 percent of total U.S. organic agricultural sales.117
• 15 percent of U.S. dairy farms had a negative net income.118
• Of dairy farmers, 65.6 percent have debt.119
• As to the average dairy farm, the 2017 census reports this key data:120
Spans 461 acres
Makes $1.12 million in sales
Receives $10,264 in government payments
Pays $882,714 in expenses
Earns $259,194 in net cash farm income
• According to Farm Journal, a 2018 MILK survey of 70 U.S. farmers with at least 100 cows revealed the following:121
Seventy-two percent of respondents reported that their businesses could survive for three years or fewer.
Thirty-seven percent of respondents reported that they had only a year to increase profit or go under.
• Farm Credit East’s 2019 Northeast Dairy Farm Summary provides several key financial statistics of dairy farmers in the
northeastern United States, including data on earnings, costs, and liabilities. The following table from the report shows
cash flow per cow over a five-year period:122
112
USDA NASS, Dairy Cattle and Milk Production, 1.
113
USDA NASS, Dairy Cattle and Milk Production, 1.
114
USDA NASS, Dairy Cattle and Milk Production, 1.
115
USDA NASS, Dairy Cattle and Milk Production, 1.
116
USDA, 2017 Census: Summary and State Data, 23.
117
USDA NASS, Dairy Cattle and Milk Production, 1.
118
USDA NASS, Dairy Cattle and Milk Production, 2.
119
United States Department of Agriculture Economic Research Service, Tailored Reports (farm business debt repayment capacity; 2019; median; production specialty: dairy), accessed
December 30, 2020, https://my.data.ers.usda.gov/arms/tailored-reports.
120
USDA NASS, Dairy Cattle and Milk Production, 2.
121
Anna-Lisa Laca, “Dairy Farmers Drown in Debt,” MILK, April 2, 2018, https://www.milkbusiness.com/article/dairy-farmers-drown-debt.
122
Farm Credit East, 2019 Northeast Dairy Farm Summary (Enfield, CT: Farm Credit East, 2020), 20.
The Economic State of U.S. Farming 20Beef Cattle Farming
• As of January 2020, the U.S. beef herd totaled 31.1 million cows, a 1 percent decrease from 2019.123
• As of 2017, U.S. beef farms totaled 729,046.124 This was the breakdown:
244,836: one to nine beef cows
148,259: 10–19 beef cows
183,640: 20-49 beef cows
Therefore, 79.1 percent of U.S. beef farms had fewer than 50 cows.
Only 198 farms had at least 2,500 beef cows.
• The U.S. beef herd totaled 31.7 million cows in 2017.125
• There were 1,140 more beef farms in 2017 than in 2012.126
The number of beef cattle farms with 19 or fewer animals decreased, while the number of farms with 20 or more
increased.
The number of beef cattle farms with 2,500 or more animals increased by 17.8 percent from 2012 to 2017.
The number of farms with one to nine animals decreased by 6.2 percent.
The number of farms with 10 to 19 animals decreased by 4.7 percent.
• Imports of live cattle increased 3.8 percent in 2020 from 2019.127 About 25 percent of live cattle imported were for
“immediate slaughter.”128
• Cattle/calf sales made up the largest portion of sales from animals or animal products, 37.6 percent.129
123
USDA NASS, Cattle, 1.
124
USDA, 2017 Census: Summary and State Data, 20.
125
USDA, 2017 Census: Summary and State Data, 20.
126
USDA, 2017 Census: Summary and State Data, 20.
127
United States Department of Agriculture Economic Research Service, Livestock, Dairy, and Poultry Outlook (Washington, DC: USDA ERS, October 2020), 1.
128
USDA ERS, Livestock, Dairy, and Poultry Outlook (October 2020), 1.
129
“Farming and Farm Income,” USDA.
The Economic State of U.S. Farming 21Income and Debt in Beef Cattle Farming
• Sales from beef cattle farms reached $77.2 billion in 2017.130
• Of beef cattle farmers, 23.4 percent have debt.131
• Midsize herds (200 to 499 cows) had the highest sales value at $7.5 billion, and herd sizes of 100–199 had the second-
highest sales value at $5.9 billion.132
• The largest herd sizes (5,000+ cows) had the lowest sales value at $4.2 million.133
• As of 2019, the total capital assets for cattle are estimated at $1.17 million per farm, with a median of $484,600.134
• Cattle farm liabilities, or monetary obligations of the farm, are estimated at $63,316 per farm, with a median of $800.135
• Cattle farm equity, the assets after liabilities are subtracted, is estimated at $1.1 million per farm, with a median of
$445,312.136
Hog Farming
• According to the 2017 census, farms selling hogs and pigs totaled 64,871, an increase of 16.1 percent from 55,882 in 2012.137
• The total value of hog sales was $26.3 billion. Ninety-one percent of sales value came from farms with sales of 5,000+ hogs.138
• Smaller farms selling one to 24 or 25–49 hogs accounted for only 0.16 percent and 0.07 percent of total hog sales
value, respectively.139
• As of 2020, the top hog-farming states are Iowa, Minnesota, and North Carolina, according to inventory data.140
• Imports of hogs decreased marginally in 2020 from 2019. About 15 percent of live hogs imported are for “immediate
slaughter.”141
Income and Debt in Hog Farming
• In 2017, 235.3 million hogs and pigs were sold for a total of $26.3 billion, up $3.8 billion from 2012.142
• Of hog farmers, 47.7 percent have debt.143
• Farms in the 5,000+ pigs sales class had the highest sales at $23.8 billion, followed by the 2,000–4,999 pigs sales class at
$1.8 billion.144
All farms with sales of fewer than 2,000 pigs made less than $570 million combined.
Farms with sales of one to 24 pigs made $43.3 million combined.
• As of 2019, total capital assets for hog farms are estimated at $2.8 million per farm, with a median of $896,500.145
130
USDA, 2017 Census: Summary and State Data, 22.
131
United States Department of Agriculture Economic Research Service, Tailored Reports (farm business debt repayment capacity; 2019; median; production specialty: cattle), accessed
December 30, 2020, https://my.data.ers.usda.gov/arms/tailored-reports.
132
USDA, 2017 Census: Summary and State Data, 22.
133
USDA, 2017 Census: Summary and State Data, 22.
134
United States Department of Agriculture Economic Research Service, Tailored Reports (farm business balance sheet; 2019; production specialty: cattle), accessed November 11, 2020,
https://my.data.ers.usda.gov/arms/tailored-reports.
135
USDA ERS, Tailored Reports (balance sheet, 2019, cattle).
136
USDA ERS, Tailored Reports (balance sheet, 2019, cattle).
137
USDA, 2017 Census: Summary and State Data, 24.
138
USDA, 2017 Census: Summary and State Data, 24.
139
USDA, 2017 Census: Summary and State Data, 24.
140
United States Department of Agriculture National Agricultural Statistics Service, Quarterly Hogs and Pigs (Washington, DC: USDA NASS, September 2020), 6.
141
USDA ERS, Livestock, Dairy, and Poultry Outlook (October 2020), 1.
142
USDA, 2017 Census: Summary and State Data, 24.
143
United States Department of Agriculture Economic Research Service, Tailored Reports (farm business debt repayment capacity; 2019; median; production specialty: hogs), accessed
December 30, 2020, https://my.data.ers.usda.gov/arms/tailored-reports.
144
USDA, 2017 Census: Summary and State Data, 24.
145
United States Department of Agriculture Economic Research Service, Tailored Reports (farm business balance sheet; 2019; production specialty: hogs), accessed November 11, 2020, https://
my.data.ers.usda.gov/arms/tailored-reports.
The Economic State of U.S. Farming 22• Hog farm liabilities, or monetary obligations of the farm, are estimated at $553,870 per farm, with a median of $50,777.146
• Hog farm equity, the assets after liabilities are subtracted, is estimated at $2.3 million per farm, with a median of $640,663.147
Comparative Analysis
This section displays comparative tables of the following metrics across poultry, dairy, hog, beef, and specialty (fruit, vegetable,
and nut) farming:148
Median Net Farm Income
Cattle Dairy Poultry Hog Specialty
(fruits, vegetables, nuts)
2019 -$370 $74,483 $17,862 $19,318 $6,427
2018 $1,446 $40,855 $13,140 $10,741 $6,890
Percentage of Farmers with Debt
Cattle Dairy Poultry Hog Specialty
(fruits, vegetables, nuts)
2019 23.4% 65.6% 41% 47.6% 27.6%
2018 24.5% 67.7% 55.5% 49.2% 28.7%
Total Liabilities (dollar per farm) / Average Net Farm Income
Cattle Dairy Poultry Hog Specialty
(fruits, vegetables, nuts)
TL = $63,316 TL = $640,370 TL = $277,728 TL = $553,870 TL = $149,966
2019
ANFI = $5,534 ANFI = $194,521 ANFI = $88,218 ANFI = $194,944 ANFI = $106,259
TL = $53,859 TL = $636,237 TL = $287,024 TL = $419,054 TL = $152,159
2018
ANFI = $8,897 ANFI = $154,795 ANFI = $47,773 ANFI = $88,658 ANFI = $98,428
Farmer Debt Repayment Capacity (ratio of actual debt to maximum debt capacity)
Reached as of 2018 at a 10 Percent Interest Rate
Cattle Dairy Poultry Hog Specialty
(fruits, vegetables, nuts)
2019 53% 53.9% 60.2% 49.5% 25.3%
2018 44.2% 62.2% 85.2% 73.4% 26.6%
146
USDA ERS, Tailored Reports (balance sheet, 2019, hogs).
147
USDA ERS, Tailored Reports (balance sheet, 2019, hogs).
148
United States Department of Agriculture Economic Research Service, Tailored Reports, accessed December 28, 2020, https://my.data.ers.usda.gov/arms/tailored-reports.
The Economic State of U.S. Farming 23Government Payments Received by Each Sector as of 2018
2019 2018
Average Average
Total Number of Total Number of
Government Government
Government Farms Receiving Government Farms Receiving
Payment per Payment per
Payments Payments Payments Payments
Farm* Farm
Cattle $1,308,753,000 108,121 $12,105 $1,117,461,000 121,384 $9,206
Dairy $667,150,000 20,075 $33,233 $472,827,000 24,538 $19,269
Poultry $152,008 10,664 $14,255 $68,847,000 4,991 $14,255
Hog $340,608,000 5,576 $61,083 $227,834,000 5,591 $40,753
Specialty
(fruits, vegetables, $508,709,000 12,277 $41,435 $156,884,000 8,857 $17,714
nuts)
All U.S.
$16,003,460,000 628,054 $25,481 $10,396,014,000 583,328 $17,822
Agriculture
*Note: These are averages reported by the ERS and do not exactly reflect averages calculated from above numbers due to statistical
accommodations made by their models.
The Economic State of U.S. Farming 24You can also read