Independent validation of land-use change from pastoral farming to large-scale forestry - July 2021 BakerAg Authors: Stuart Orme, Phil Orme
←
→
Page content transcription
If your browser does not render page correctly, please read the page content below
Independent validation of land-use change
from pastoral farming to large-scale forestry

                   July 2021
                   BakerAg
        Authors: Stuart Orme, Phil Orme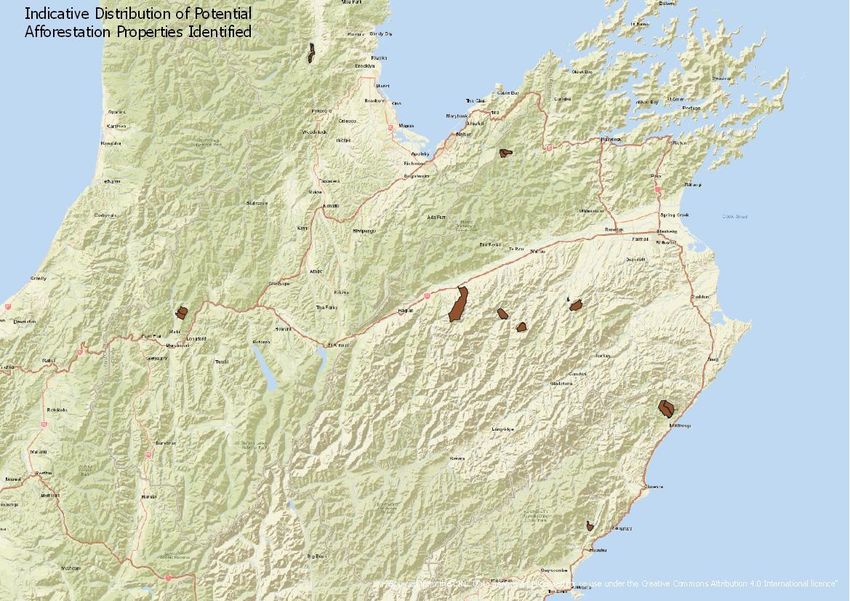
Client report
Independent validation of land-use change from pastoral
farming to large-scale forestry

Client:             Beef + Lamb New Zealand

Authors:            Stuart Orme                                         RMNZIF - Registered Forestry Consultant
Research:           Phil Orme                                           NZCF, BFor Sci (Hons)
Report preparation: Harriet Palmer                                      BSc (Hons), MSc

Date:               12th July 2021

SH2, Waingawa
Masterton 5810
New Zealand
+64 6 370 6880

DISCLAIMER
BakerAg (NZ) Limited (“BakerAg”, “us” or “we”) has complied this report, as contracted by Beef + Lamb New Zealand
Limited.
This report is for Beef + Lamb New Zealand Ltd and is not for wider distribution except as specifically agreed
between the BakerAg and Beef + Lamb New Zealand Ltd.
BakerAg findings are based on the information provided to us. We have not audited or otherwise verified the
information, including actual and budgeted financial information, provided to us.
We have no responsibility to update this report for events and circumstances that may occur after the date of this
report.
This report may provide general information about actual or potential investment opportunities, but we do not
provide specific investment advice for any individual or organisation. We recommend that individuals or
organisations consult a financial adviser for specific financial and investment advice tailored to their particular
circumstances. BakerAg will not be liable for any investment decisions made as a result of this report.
To the extent permissible by law, neither BakerAg nor any person involved in this publication accepts any liability
for any loss or damage whatsoever that may directly or indirectly result from any advice, opinion, representation,
statement or omission, whether negligent or otherwise, contained in this publication.

Validation of land-use change from pastoral farming to large-scale forestry                                  Page 2
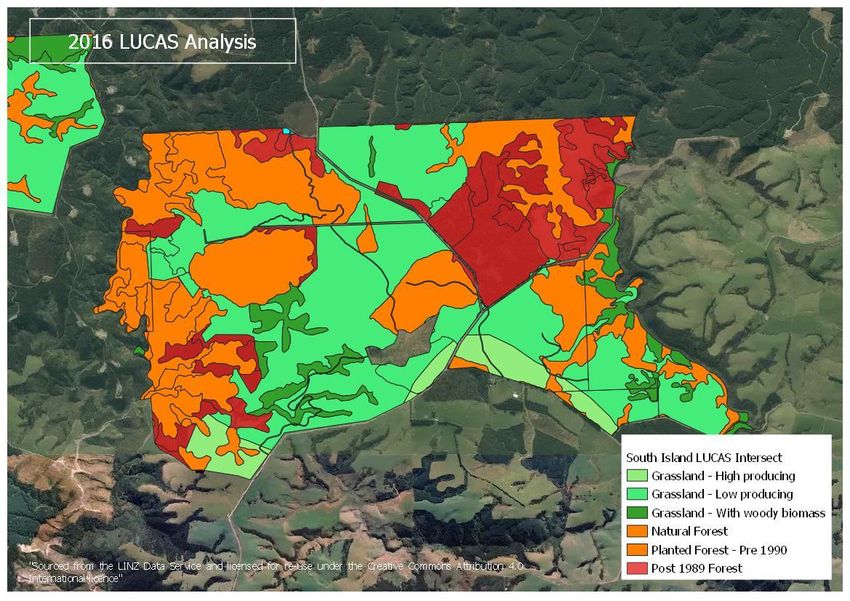
Table of Contents
Client report ............................................................................................................................................................2

Table of Contents ...................................................................................................................................................3

Executive summary ................................................................................................................................................5

1.     Introduction .....................................................................................................................................................9

2.     Methodology: Stage 1 .................................................................................................................................. 10

3.     Stage 2 ......................................................................................................................................................... 11
     3.1       Assessing the quality of land going into plantation forestry ................................................................. 11
     3.2       Cross-checking our data with regional council data ............................................................................ 13

4.     Stage 3: Additional cross-check and final summary of total land ................................................................ 15
     4.1       Additional data cross-check with Beef + Lamb New Zealand regional extension team ...................... 15

5.     Land Type Affected ...................................................................................................................................... 16
     5.1       Areas of land being converted to forestry by Land Use Capability Class ........................................... 16
     5.2       Areas of land being converted to forestry by Erosion Susceptibility Classification ............................. 20
     5.3       Comment: the value of LUC ESC and LUCAS information ................................................................. 22
     5.4       LUCAS Layer Analysis ........................................................................................................................ 22
     5.5       Distance to the nearest port................................................................................................................. 23

6.     Discussion.................................................................................................................................................... 26
     6.1       Why is farmland being sold?................................................................................................................ 26
     6.2       Partial farm plantings and mixed land use: a new era? ....................................................................... 27

7.     Summary ...................................................................................................................................................... 30

8.     Appendices .................................................................................................................................................. 32
     8.1       Appendix A: Regional distribution of land acquisitions identified as likely for forestry conversion ...... 32
     8.2       Appendix B: Distance to port of all whole-of-farm acquisitions ........................................................... 36
     8.3       B.1 North Island: Distance to port of whole-of-farm acquisitions ......................................................... 36
     8.4       B.2 South Island: Distance to port of whole-of-farm acquisitions ........................................................ 38

Validation of land-use change from pastoral farming to large-scale forestry                                                                                     Page 3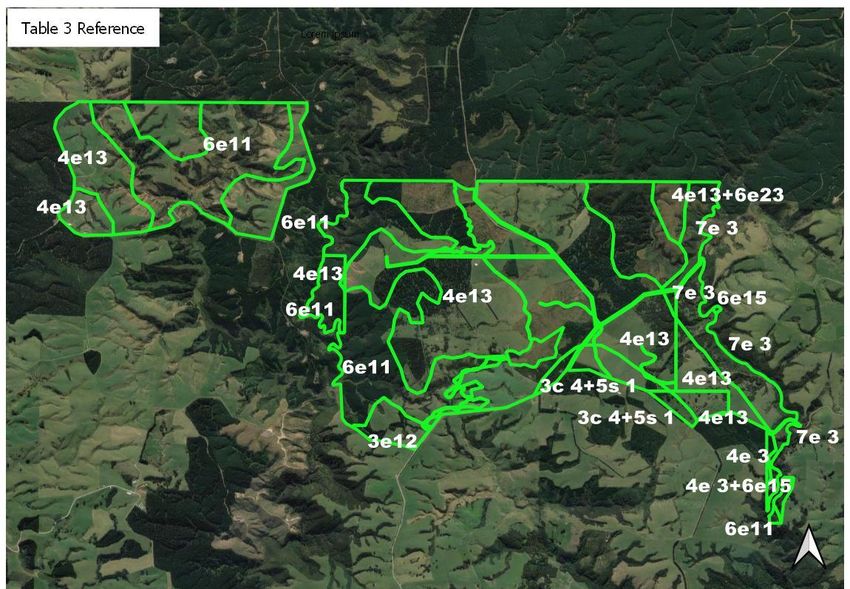
Figures, Tables and Maps
Figure 1: Increasing limitations to use and decreasing versatility of use from LUC Class 1 to LUC Class 8 ..... 16
Figure 2: Two properties with LUC Class 4 land adjacent to a large Port Blakely forest, Otago ........................ 19
Figure 3: A third property with LUC Class 4 land (left-hand property), probably too small to be an economic
farming unit; also close to other larger forested areas ........................................................................................ 20
Figure 4: Example of an ESC classification ......................................................................................................... 21
Figure 5: Example of a LUCAS classification ...................................................................................................... 23
Figure 6: Distance to port of Lower North Island land acquisitions ..................................................................... 25

Table 1: Area totals from the Stage One report................................................................................................... 10
Table 2: Amended area totals following Stage Two analyses ............................................................................. 12
Table 3: Full classification of properties - excerpt from master dataset .............................................................. 13
Table 4: NES-PF records of proposed new planting provided by regional councils ........................................... 14
Table 5: Final whole farm and partial farm new planting areas, December 2020 ............................................... 15
Table 6: Summary of all LUC areas due for conversion to forestry .................................................................... 17
Table 7: Indicative North Island areas by LUC (ha) and owner assumed due for conversion to forestry ........... 17
Table 8: Indicative South Island areas by LUC (ha) and owner assumed due for conversion to forestry .......... 18
Table 9 : Areas of land (ha) being converted to plantation forestry by Erosion Susceptibility Classification ...... 20
Table 10 : LUCAS 2016 layer .............................................................................................................................. 22
Table 11 : Examples of distance to port for a selection of Greater Wellington properties .................................. 24

Map 1: Northland land acquisitions for forestry ................................................................................................... 32
Map 2: Gisborne/Hawke's Bay land acquisitions for forestry .............................................................................. 33
Map 3: Taranaki land acquisitions for forestry ..................................................................................................... 33
Map 4: Lower North Island land acquisitions for forestry .................................................................................... 34
Map 5: Top of the South land acquisitions for forestry ........................................................................................ 34
Map 6: Otago land acquisitions for forestry. ........................................................................................................ 35

Validation of land-use change from pastoral farming to large-scale forestry                                                                        Page 4
Executive summary
BakerAg has been commissioned by Beef + Lamb New Zealand to:

“Independently validate the amount of land that has been or will be planted into exotic plantation species in the
near future that is likely to take land out of pastoral production”.

Whole farms purchased for forestry or partial farm planting

Using the methodology summarised in Stages 1-3, the final results are tabled below:

The results of our independent validation therefore estimate:

     1. The gross land area of whole farms purchased between 1/1/2017 and 31/12/2020 for planting is
        estimated at 92,118 hectares (ha).

     2. Of that amount, based on an analysis of the 2016 LUCAS layer, 66,665 ha is estimated as ‘plantable
        (effective) area’.

     3. Between 2018 and December 2020 an additional 47,382 ha of land within existing farms was approved
        for planting, funded by the One Billion Trees programme (1BT) or as part of the Crown Forestry Joint
        Ventures scheme.

     4. Of this area, approximately 12,124 ha is identified for mānuka/indigenous plantings. With the 14,338 ha
        of whole farm purchases identified for mānuka/indigenous plantings, we have a total close to 26,500 ha
        or 19% of the total identifiable land conversion likely to be planted with mānuka or indigenous species.

    5. In total, it is estimated that 139,500 hectares of land has been or will be planted in the near future, taking
       this land predominantly out of sheep and beef production.

The data was based on sales that could be verified during the stated period. The areas identified could
potentially be higher if sales occurred outside the methodology used for assessing whole-of-farm sales and
within-farm plantings; the area could be less if land is sold back to farming interests and not yet captured in the
data. While most sales for 2020 have been recorded, it is possible there could be a small additional number
from 2020 that could still emerge.

Validation of land-use change from pastoral farming to large-scale forestry                                   Page 5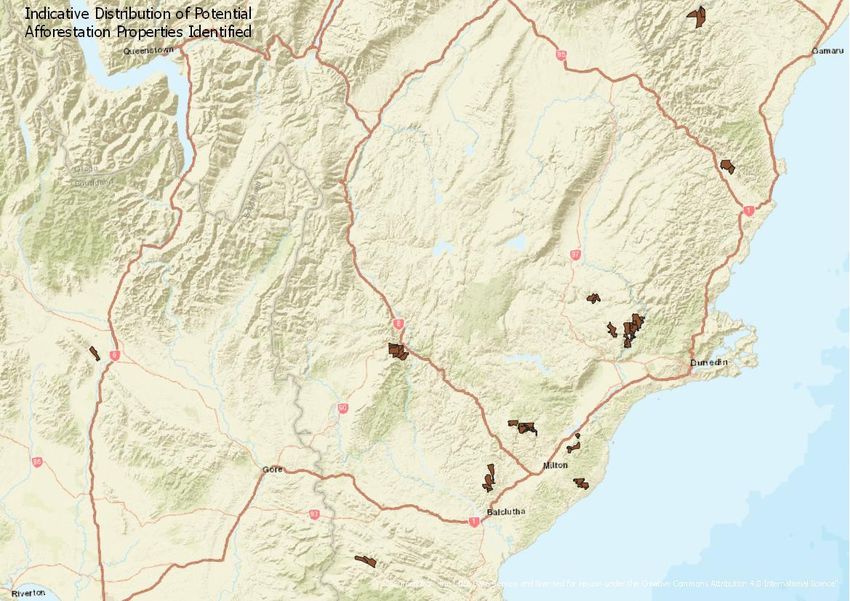
LUCAS 2016 layer summary

Analysis of the 2016 LUCAS layers suggest 65.7% of the whole farms sold into forestry was in clear pasture,
6.7% in potentially reverting country and 27.5% in either exotic or indigenous forest species at the time of the
2016 LUCAS update.

                                                         Gisborne- Rest of North                Grand Total Percentage by
        LUCAS 2016 Layer                Northland                                South Island
                                                        Hawkes Bay    Island                     (Hectares)     Total
Cropland - Annual                                                                    75             75          0.1%
Grassland - High producing                 3232            3624       13150         2280           22285        24.2%
Grassland - Low producing                   427            7929       21646         8101           38103        41.4%
Grassland - With woody biomass              365            1064        2569         2204           6202         6.7%
Natural Forest                              752            1154        8635         4259           14801        16.1%
Planted Forest - Pre 1990                   267             293        1114          651           2325         2.5%
Post 1989 Forest                            326             907        4221         2731           8185         8.9%
Other                                                       31            0           0             32          0.0%
Settlements or built-up area                                                          1              1          0.0%
Wetland - Open water                         3              34           29           6             71          0.1%
Wetland - Vegetated non forest               4               1                       34             39          0.0%
Grand Total                                5375            15037      51365         20342          92118       100.0%

LUC classification summary

Analysis of properties found that by far the majority (90.4% in our assessment) of land being converted is land of
LUC 6 and above. Some 52% of the area is in LUC 6, 36.7% in LUC 7 and 1.7% in LUC 8.

Close to 8.5% of land fell into LUC 3 and 4; however, it comprised collective small parcels of land across all sales
as opposed to properties where this was the predominant land type.

Validation of land-use change from pastoral farming to large-scale forestry                                        Page 6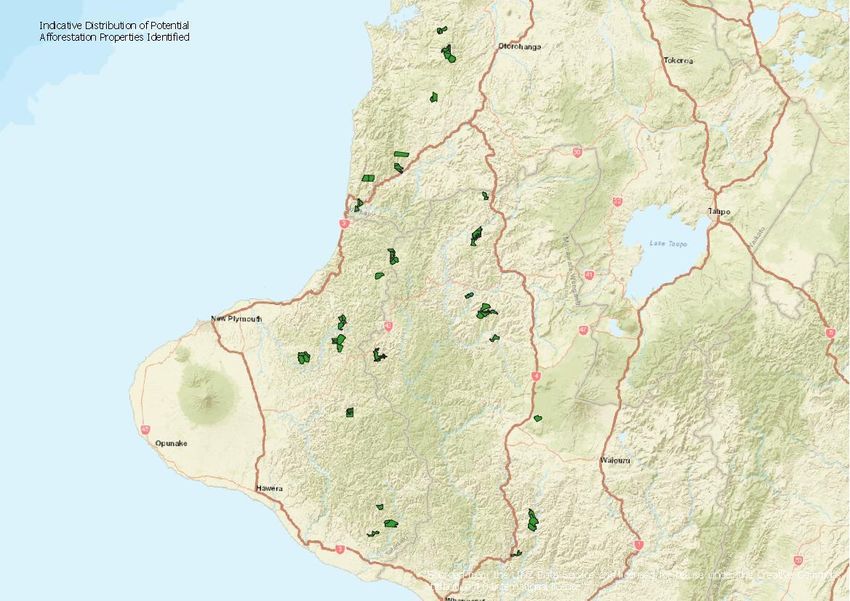
Erosion Susceptibility Classification summary

In terms of Erosion Susceptibility Classification (ESC), the land falls into the four main ESC classes as follows:
     •  Low                       28.2%
     •  Moderate                  35.8%
     •  High                      26.0%
     •  Highly erodible           9.9%

The 9.9% in the highly erodible land category is likely to be spread across the total land area as opposed to whole
properties. The NES-PF, where applied, will provide guidance on what will actually be planted. (Note that
although previously plantation forestry was guided by the NES-PF, our understanding is that mānuka and trees
planted for carbon only - i.e. no expected harvest - is not subject to NES-PF constraints).

Equally the combined 64% of low to moderate erodible land is spread across all farms.

                                                         Erosion Susceptability Class (ESC)               Grand Total
          Regional Area
                                             Low         Moderate             High    Very High   Other    (Hectares)

  Northland                                  610             2641             1006      1117        1        5375
  Gisborne_Hawkes Bay                       1595             3893             5938      3586       25       15036
  Wellington                                9539            21944             15975     3901        6       51365
  South Island                              14246            4474             1045      548        30       20342
  Grand Total                               25990           32952             23963     9151       61       92118
  Percentage by Total Area                  28.2%           35.8%             26.0%     9.9%      0.1%      100.0%

Location

At least twenty-one (21) properties, totalling 12,565 ha were between 150 km and 200 km from the nearest port.
At present, this land, which might be considered remote and therefore of lower market value by farmers; in pre
carbon/low log price days more remote land was also less attractive as a forestry investment. With the now
established carbon (cash) flows available to forest plantings, forestry is an attractive option in these more remote
areas. Throughout the life of these more remote forests (if planted in radiata pine) there could be decision points
which may result in the forests either being managed for timber and carbon revenues, or for carbon only,
depending on the relative values of timber and carbon. Forests closer than 150 km to a port are those most likely
to be managed for both timber and carbon revenues (based on current industry log revenues and costs).

Land-use Change

The project also sought to gain an understanding of why there has been the recent increase in farmland being
sold to forestry interests. An unexpected result was a growing understanding of how much land was/is being
purchased for mānuka farming/indigenous plantings amounting to 16% of whole of farm sales and 20% of total
plantings.

Land prices in some regions have been relatively stable for some years before re-emerging opportunities
associated with the Emissions Trading Scheme (ETS) and carbon price resulted in forest investors coming back
into the market for land. Hill-country farmers who had been waiting for ‘the right time’ to sell all or part of their
farm have taken the chance to move onto another farm or perhaps retire. Forestry investors were initially
prepared to pay more than farmers for land in high LUC classes (and often relatively remote areas) because of:

Validation of land-use change from pastoral farming to large-scale forestry                                    Page 7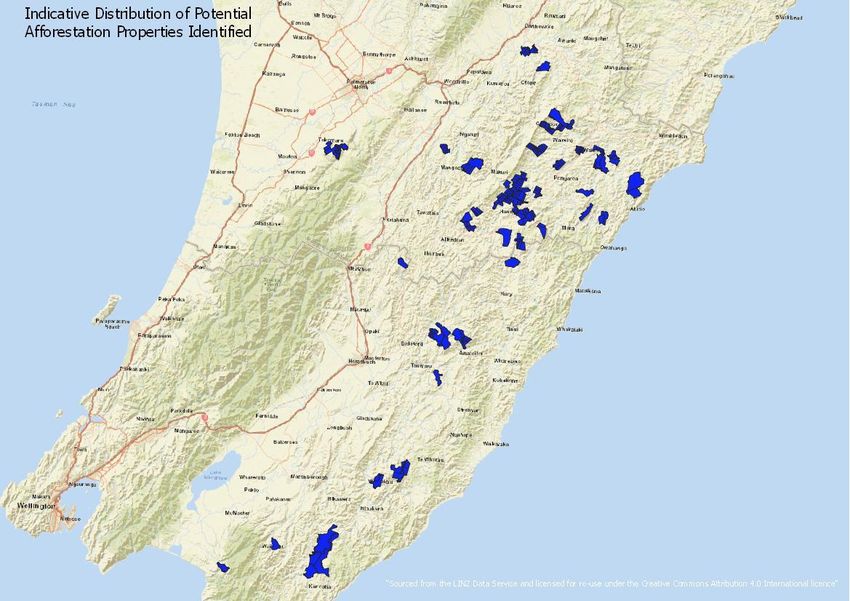
(i)        a combination of good carbon revenue streams and projected strong long-term returns on investment
           from forestry in general

(ii)       perceived uncertain times ahead in the short-to-medium term for hill country farmers. However, in the
           past two years we have seen more competition for land from the farming sector as their equity has
           increased and willingness to pay more has bedded in.

The strong uptake of the Crown Joint Venture fund and the One Billion Trees Programme (1BT) planting grant
by existing landowners provides evidence that many farmers are beginning to assess the long-term benefits
associated with putting part of their farm in trees, planting ‘the right trees in the right place’ - where the right place
is one which increases overall farm profitability, reduces net farm emissions and may also confer other
sustainable environmental and social benefits.

Validation of land-use change from pastoral farming to large-scale forestry                                       Page 8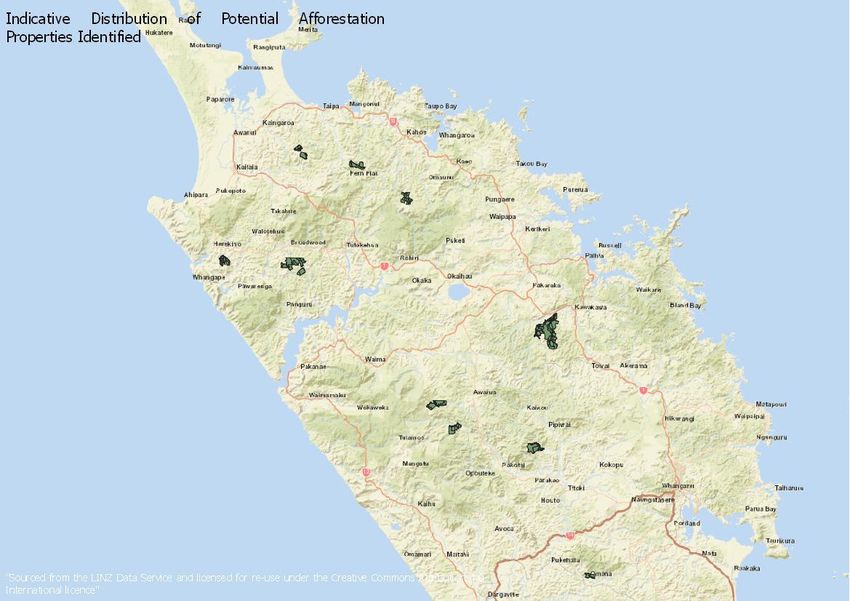
1. Introduction
BakerAg has been commissioned by Beef + Lamb New Zealand to:

“Independently validate the amount of land that has been or will be planted into exotic plantation species in the
near future that is likely to take land out of pastoral production”.

The final figures of both whole farm and integration of trees on farms were developed using three stages of
investigation as summarised below:

Stage One of the project involved a comprehensive review of available land-use-change data to provide up-to-
date statistics on the areas of land being converted from pastoral farming into forestry under different ownership
models, grant programmes and owner objectives.

To provide a benchmark for ‘whole of farm’ purchase we analysed all sales of 250 Ha or more.

Plantable area (effective forest land) is calculated using declared Overseas Investment Office (OIO) intentions,
100% for honey production and 85% for whole of farm domestic sales.

Stage Two looked to analyse the land classes affected in the whole of farm sale land areas and in doing this the
areas changed as we ‘desktop’ visited the initial properties, time progressed and other information became
available.

Stage Three was a final check where we provided maps of all land identified to the Beef + Lamb NZ extension
team and asked them to identify any properties they were aware of that we had missed – upon completion of this
exercise we added the additional land (circa 6,000 ha) into the land use classification exercise and completed
the tables as follow in this report. At this stage, MPI also released more up to date information on grants approved
under the One Billion Trees Programme to integrate trees on farms.

An additional updating of the sales information to include all sales that could be identified up until 31/12/2020
was also undertaken in May 2021.

B+LNZ also commissioned BakerAg to look at the land types affected and comment on why land may be being
sold.

Validation of land-use change from pastoral farming to large-scale forestry                                  Page 9
2. Methodology: Stage 1
Stage One of the project involved a comprehensive review of available land-use-change data to provide up-to-
date statistics on the areas of land being converted from pastoral farming into forestry under different ownership
models, grant programmes and owner objectives.

To provide a benchmark for ‘whole of farm’ purchases, we analysed all sales of 250 Ha or more.

‘Plantable area’ (effective forest land) is calculated using declared OIO intentions, 100% for honey production
and 85% for whole of farm domestic sales for forestry.

The results for Stage One (1/1/2017 to 31/3/2020) are summarised in the table below:

Table 1: Area totals from the Stage One report

 Whole of farm purchase               Sum of gross land area            Sum of revised plantable   Percentage of Plantable
                                               (ha)                          estimate (ha)                  Est.
 NZ sales                                       33,006                          27,911                      31%
 OIO information                                26,248                          17,706                      20%
 Honey                                           5,839                           5,839                       7%
 Total whole of farm                            65,093                          51,456                      58%
 Partial farm plantings by landowner
 1BT Landowner Grant                            14,013                          14,013                      15%
 Crown Forestry JV                              24,000                          24,000                      27%
 Total partial farm                             38,013                          38,013                      42%
 Totals                                         103,106                         89,469                     100%

Validation of land-use change from pastoral farming to large-scale forestry                                         Page 10
3. Stage 2
3.1 Assessing the quality of land going into plantation forestry
This stage of the project involved taking two of the data sets acquired in Stage One of the project:
(i) the Overseas Information Office (OIO) records of properties sold where forestry has been specified
as the future land use, and
(ii) the Property Guru dataset, where we have identified farm sales to new domestic owners who are
obviously buying land with the intention of converting some or all of it to plantation forestry or mānuka.
During Stage One all of these properties were identified as a search in the Property Guru system, and their
physical boundaries saved district by district. The combined total area of these properties (over 65,000 hectares)
comprises all ‘whole of farm purchases’ over 250 ha and is an estimated 58% of land potentially destined for
conversion to forestry as identified in Stage One.
Regional maps of land acquisitions
Regional maps of almost all properties identified in Stage One from the Property Guru system are included in
this report (Appendix A, Maps 1-6). Properties not included are ones that are outlying and were omitted so that
maps could be kept at a reasonable scale.
The maps show that in the South Island land acquisitions for forestry are generally widely scattered (Maps 5 and
6).
In contrast, the Lower North Island map (Map 4) shows some major clusters of properties that have recently
changed hands and are likely to be converted from sheep and beef farming to radiata pine (and already have
been planted in many cases). What should also be noted is that these properties are in areas where in previous
relatively recent ‘forestry booms’ in the 1990s and 2000s, resulted in significant conversion of farmland to pine
plantations. This helps to explain the strength of concern about an increase in farms being sold into forestry as
members of those communities are often intergenerational sheep and beef farmers who have experienced a
marked decline in the number of farming businesses, and loss of farming neighbours and community, within their
lifetimes and do not want it to happen again.
Cross-checking data already obtained
Stage Two of the project involved downloading and collating the shapefiles for all properties described above.
These shapefiles were sourced from LINZ NZ Property Titles Including Owners layer, and titles were checked
against the information identified in Stage One for any changes to the original database. As a result of checking
the data to complete Stage Two of our report, we were able to refine the data used to produce the Stage One
results. The revised Table 2 shows a slightly reduced revised estimate, in NZ Sales, of 942ha.
Some of the changes in area came about because some titles were already found to have changed hands – for
example, in two instances farms were subdivided and areas believed to be better suited to productive farming
were sold on to new owners. As such these sub-areas were deleted during the cross-checking process.
The total area of farm sales was then estimated at 64,287ha, which equates to almost 57% of all estimated
plantable land destined for plantation forestry or mānuka (previous totals were 65,093 and 58% respectively).
Validation of land-use change from pastoral farming to large-scale forestry Page 11Table 2: Amended area totals following Stage Two analyses
Whole of farm purchase Sum of gross land area Sum of revised plantable Percentage of Plantable
(ha) estimate (ha) est.
NZ sales 32,064 27,110 30%
OIO information 26,063 17,706 20%
Honey 6,126 6,126 7%
Total whole of farm 64,287 50,942 57%
Partial farm plantings by landowner
1BT Landowner Grant 14,013 14,013 16%
Crown Forestry JV 24,000 24,000 27%
Total partial farm 38,013 38,013 43%
Totals 102,266 88,955 100%
Intersecting Land Use Classification and Erosion Susceptibility Classification layers
We then developed a methodology to determine the quality of land in terms of its production potential. By
intersecting two GIS layers describing Land Use Classification (LUC) and Erosion Susceptibility
Classification (ESC) on top of the property title layer, we produced a data set with accurate estimates of the
areas of land in different LUC and ESC classes on all the properties identified.
The properties in question are widely spread across the country, so for ease of reporting they have been grouped
into four geographic categories – Northland, Gisborne/East Coast, Lower North Island and South Island.
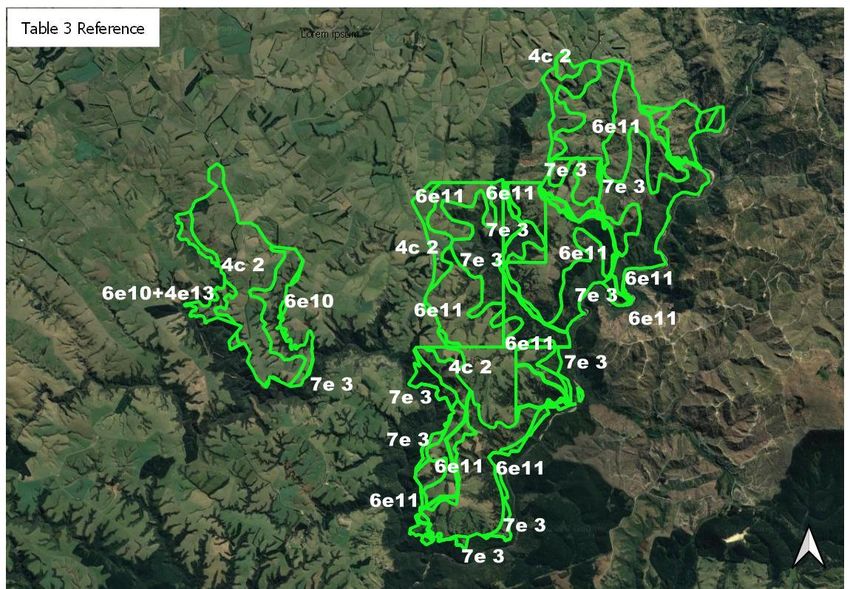
Table 3 below provides an excerpt from the master dataset which contains details of all properties assessed in
Stage 2 of the project. Each Title has an identifier #, a breakdown of applicable LUCs, ESC (2018) classification,
area (ha) by LUC/title, registered owner, our visual assessment of vegetation cover (subjective), location and
region. Existing vegetation was assessed during the visual confirmation of individual titles against the LINZ
database. Satellite imagery was used to broadly define the vegetation present, from grass to pasture with
regeneration showing up. Existing larger blocks of exotic forested areas, when they were evident on land
classified as pastoral, were mapped out where they were identified and removed from the land sales total area.
The visual assessment information is included to provide confirmation of what land may be going into trees, in
addition to the LUC information.
Validation of land-use change from pastoral farming to large-scale forestry Page 12Table 3: Full classification of properties - excerpt from master dataset
Individual Property Owner
OBJECT ID LUC LUC BAND LUC Area ESC2018 Area Identifier Land Cover Region
61349 7e20 7 110.44 Very High 430 BB woody Biomass/Pasture
Wellington
61590 8e 3 8 67.64 Very High 331 BB woody Biomass/Pasture
Wellington
61590 8e 3 8 123.32 Very High 430 BB woody Biomass/Pasture
Wellington
13071 3e 3 3 13.46 Low 1625 CC Pasture Wellington
13158 6e 7 6 0.29 Moderate 1372 CC forest Wellington
13159 6e 7 6 1.69 Moderate 1372 CC forest Wellington
13159 6e 7 6 37.21 Moderate 1625 CC Pasture Wellington
13161 6e 7 6 130.59 Moderate 1625 CC Pasture Wellington
13267 7e 6 7 0.40 Very High 648 CC Forest Wellington
65482 4e 3 4 5.22 Low 1625 CC Pasture Wellington
69281 3w 1 3 0.95 Low 648 CC Forest Wellington
69282 3w 1 3 3.19 Low 648 CC Forest Wellington
69284 3w 1 3 4.87 Low 561 CC Pasture Wellington
69284 3w 1 3 23.03 Low 62 CC Pasture Wellington
69284 3w 1 3 1.86 Low 1625 CC Pasture Wellington
69350 4e 3 4 30.54 Low 1625 CC Pasture Wellington
69415 6e 2 6 0.00 Moderate 561 CC Pasture Wellington
69415 6e 2 6 1.63 Moderate 62 CC Pasture Wellington
69415 6e 2 6 0.18 Moderate 1625 CC Pasture Wellington
69417 6e 2 6 214.79 Moderate 1372 CC forest Wellington
69417 6e 2 6 222.72 Moderate 561 CC Pasture Wellington
69417 6e 2 6 3.47 Moderate 62 CC Pasture Wellington
69417 6e 2 6 786.41 Moderate 1625 CC Pasture Wellington
69513 6e 7 6 42.19 Moderate 1625 CC Pasture Wellington
Note: We have removed owner details and replaced with an ‘owner identifier’ (A-ZZ) to protect privacy. In later tables we have also used a
numerical identifier for property locations. Areas are in hectares.
3.2 Cross-checking our data with regional council data
Regional councils have an obligation to assess applications for new plantation forests under the National
Environmental Standard for Plantation Forestry (NES-PF).
At the start of this project, our expectation was that all regional councils would be maintaining records of new
planting applications as they are legally required to do so under their requirements for the NES-PF. We
anticipated that we would be able to gain access to the records and use them as a way of cross-checking other
data we had collected on new planting activity.
However, we learnt that there is no standard procedure across regions for collating the information, and in regions
where data is recorded, no consistency between regions in what data is recorded. Added to this is that the NES-
PF only requires plantation forestry (where a timber harvest is anticipated in future) to be registered with the
regional councils. Forests being planted for mānuka or carbon only are not required to register, nor, it seems,
even required to go through a consent process to plant on land classified as Very High and High under the
Erosion Susceptibility Classification system (ESC). We understand that this is being reviewed.
All available information received from regional councils has been collated in the Table 4. Six regions have not
contributed any information, due either to it not being collected or not being collated in a readily available format.
Other regional councils could produce information, but the data would have to be manually extracted from files
and there would be a cost associated with this. Given the general inconsistency of the NES-PF data available
overall, the costs associated with obtaining data from these councils were difficult to justify. It is interesting to
see a trend in improved reporting over the last three years that anecdotally would seem to coincide with an
increase in planting activity, and as councils gained a better understanding of the requirements under the NES-
PF.
Validation of land-use change from pastoral farming to large-scale forestry Page 13Table 4: NES-PF records of proposed new planting provided by regional councils
Area
(ha)
Region 2018 2019 2020 Total (ha)
Auckland 0 0 0 0
BOP 323.8 323.8
Canterbury 180 623.49 4195.4 4998.89
Gisborne 72.9 1259.9 1332.8
Wellington 675 239.6 0 914.6
Hawkes Bay 0 0 0 0
Horizons RC 1361.1 1588.2 4040.3 6989.6
Marlborough 642.8 686.7 468 1797.5
Northland 0 0 0 0
Otago 465.5 2735.85 3201.35
Southland 0 0 0 0
Taranaki 0 0 0 0
Tasman 80.85 131.22 212.07
Waikato 1177.1 1177.1
West Coast 0 0 0 0
Total (ha) 2858.9 3757.24 14331.57 20947.71
An attempt was also made to correlate regional councils’ NES-PF data with data available on successful
applications to Te Uru Rākau’s One Billon Trees landowner planting grants. Because of the disparities across
regions (and district councils) and the inability to align with 1BT information, we were unable to use this approach
as a viable cross-referencing tool.
Canterbury provided the most complete data in terms of areas notified and whether 1BT was involved or not,
however, the discrepancy mentioned earlier in the NES-PF where only commercial forestry is notifiable has
resulted in some areas planted solely for carbon not being notified.
In summary, this part of the project did not provide any data that was robust enough to be of any value in validating
our existing datasets at a national level.
Validation of land-use change from pastoral farming to large-scale forestry Page 144. Stage 3: Additional cross-check and
final summary of total land
4.1 Additional data cross-check with Beef + Lamb New Zealand regional
extension team
As a further means of ensuring no large-scale land conversions have been missed, we requested the Beef +
Lamb New Zealand project management team to contact members of Beef + Lamb New Zealand’s regional
extension team. We asked extension officers to review our data of land sales in their region and inform us of any
missing properties which they know had been, or were destined for, large-scale conversion from pastoral land to
plantation forestry or mānuka.
Responses were received, identifying an additional 12,559 hectares of land for consideration. This was checked
against our existing database, local consultants, and Real Estate agents to validate. After adjustments for areas
already known to us (predominantly Crown Forestry JV areas), this increased the total gross land area by 5,708
ha and our revised estimated afforested area by 4,879 ha.
Te Uru Rākau updates 1BT data, and numbers for both 1BT Direct to Landowner Grants and Crown Forestry JV
data to 31/12/2020 was updated into the table. This data showed a big increase in areas approved for planting
under the 1BT, since the June 2020 report.
A further review of land sales for the period 1/1/2017-31/12/2020 using the latest information in May 2021 was
conducted.
This information was used to arrive at the final summary of total land conversion estimates (Table 5):
Table 5: Final whole farm and partial farm new planting areas, December 2020
Validation of land-use change from pastoral farming to large-scale forestry Page 155. Land Type Affected
5.1 Areas of land being converted to forestry by Land Use Capability Class
We analysed the Land Use Capability Classification (LUC) data for properties identified in several ways, including
by owner and by region.
The LUC system is an assessment of the land’s capability for use, which ‘takes into account its physical limitations
and its versatility for sustained production’.
Figure 1: Increasing limitations to use and decreasing versatility of use from LUC Class 1 to LUC Class 8
As Figure 1 illustrates, LUC Classes 1-4 are considered suitable for arable cropping, horticulture, pastoral
grazing, tree crop or production forestry use. Classes 5-7 are considered unsuitable for arable cropping, but are
suitable for pastoral grazing, tree crop or production forestry, and in some cases vineyards and berry production.
Class 8 land is considered unsuitable for anything other than management for catchment protection and/or
conservation.
Table 6 provides an overall summary of areas by LUC on farms which have been sold between 1/1/2017 and
31/12/2020 and which we believe have been, or are intended to be, converted to plantation forestry or mānuka.
The data confirm conclusively that by far the majority (90.4% in our assessment) of land being converted is land
of LUC 6 and above. Some 52% of the area is in LUC 6, 36.7% in LUC 7 and 1.7% in LUC 8.
Validation of land-use change from pastoral farming to large-scale forestry Page 16Table 6: Summary of all LUC areas due for conversion to forestry
Tables 7 and 8 provide a breakdown of the areas in LUCs 2-8 by owner for both North and South Island land
purchases (generally based on the purchase of a single property) at the end of Stage One, when approximately
65,000 ha had been identified.
Table 7: Indicative North Island areas by LUC (ha) and owner assumed due for conversion to forestry
Total Area
North Island
Land Use Classification (LUC) Band By Owner
Ownership ID
ID
3 4 5 6 7 8
AB 5 106 84 195
AC 99 38 1757 181 2075
AD 1 58 438 1178 127 1801
AE 25 1369 313 1707
B 108 1000 1108
BB 113 457 191 761
C 438 461 48 9 957
CC 47 283 4082 1305 5716
DD 308 308
E 61 96 157
G 357 357
GG 708 6 713
H 53 307 7 22 389
HH 15 518 533
JJ 2 76 133 162 372
KK 133 129 3023 2302 68 5654
LL 193 155 1605 2354 1 4307
M 20 61 285 212 578
MM 78 128 1171 205 1583
OO 33 313 346
P 110 0 1837 1569 103 3620
PP 9 41 156 1172 57 1435
R 175 302 477
RR 17 119 80 43 259
S 1 280 26 307
T 77 57 441 6 93 675
TT 256 37 1711 448 87 2539
W 24 275 466 764
WW 134 226 360
XX 15 274 131 420
YY 74 134 672 194 1 1075
Z 9 4 241 255
ZZ 16 407 31 454
Grand Total 1325 2144 253 24510 15495 809 44535
Validation of land-use change from pastoral farming to large-scale forestry Page 17Table 8: Indicative South Island areas by LUC (ha) and owner assumed due for conversion to forestry
Total Area
South Island
Land Use Classification (LUC) Band By Owner
Ownership ID
ID
3 4 5 6 7 8
D 1 604 1 606
EE 319 101 420
F 2 1602 713 63 2379
FF 6 379 301 685
I 100 139 239
II 0 160 2056 976 3192
J 2 337 339
K 10 54 461 524
L 163 508 107 778
N 432 490 880 1802
NN 563 41 605
O 583 637 118 1338
OO 18 42 1264 1324
P 930 346 48 1324
Q 0 492 20 513
QQ 0 0 121 232 353
SS 59 591 282 91 1024
X 437 15 452
Y 3 11 357 371
Grand Total 696 2133 508 12572 3223 659 19790
This breakdown by owner ID (and property), combined with a visual assessment of any properties of interest,
can provide more information on the likely areas of each property destined for forestry, and areas which would,
in theory, be better utilised if retained as farmland. Further analysis on an individual property basis is possible –
for example, the location of each property in terms of its proximity to other forests, and its distance to a domestic
market and/or log-exporting port, can be important indicators of whether the owner’s objectives are likely to
include timber production, or whether the land is being planted purely for carbon farming.
Properties identified in Stage One were analysed and this showed that the majority of the land being bought by
forestry and mānuka interests is in LUC classes 6 and above – some 89% of all land in our dataset fell into these
land classes, with 58% in LUC 6, 29% in LUC 7, and 2% in LUC 8. This compared with 52% in LUC 6, 36% in
LUC 7 and 1.7% in LUC 8 for the final Stage Three summary.
Close to 10% of land fell into LUC 3 and 4 (dropping to 8.5% at Stage Three), however, it reflected collective
parcels of land across all sales as opposed to many properties where this was the predominant land type.
Of the 3,722 ha of LUC 5 or better identified In the North Island, only one property destined for exotic planting
(483 ha of 957 ha total) had a significant percentage of higher-grade land classes present - the balance being
made up of collective parcels across the land sold (noting that property ‘G’, 357 ha, was sold destined for mānuka
planting).
There were more cases of higher LUC land sales into forestry in the South Island.
This is illustrated in Table 8, which shows the LUC 4 and above land recorded against recent land transfers in
the South Island. A closer look at the larger properties affected shows how some better land may be subsumed
into plantation forestry, due to a range of factors which can include the size of the land parcel and its proximity to
existing large-scale forestry operations.
Validation of land-use change from pastoral farming to large-scale forestry Page 18Two of the properties bordered an exotic production forest (see Figure 2). As such they will likely become an extension of this larger forest, probably resulting in below average forest infrastructure and harvesting costs and perhaps therefore justifying the likely above average purchase price paid for the LUC 4 land than would normally be paid for land destined to be planted in trees. Additionally, it Is understood that the profitability of some of these properties was not as good as the land class might suggest due to climatic, input requirement and other reasons that made long-term farming a challenging choice. In some cases where better quality land is included in whole farm sales, there is potential for this land to be managed differently – for example, it could be retained as grazing land, or it could be planted with alternative species. Further investigation would be required if this level of detail is thought to be of benefit to the project; however, we are aware of several ‘on sales’ of better-class land (e.g. associated with farm buildings) that has been, and is, occurring. Figure 2: Two properties with LUC Class 4 land adjacent to a large Port Blakely forest, Otago Validation of land-use change from pastoral farming to large-scale forestry Page 19
Figure 3: A third property with LUC Class 4 land (left-hand property), probably too small to be an economic farming
unit; also close to other larger forested areas
5.2 Areas of land being converted to forestry by Erosion Susceptibility
Classification
Table 9 shows the areas of land by region under different ESC categories going into forestry. Here we see a
more even split between land in the three main ESC classes – low, moderate and high – with only a small
percentage of ‘Very high’ (i.e. highly erodible land) being destined for planting.
Table 9 : Areas of land (ha) being converted to plantation forestry by Erosion Susceptibility Classification
Erosion Susceptability Class (ESC) Grand Total
Regional Area
Low Moderate High Very High Other (Hectares)
Northland 610 2641 1006 1117 1 5375
Gisborne_Hawkes Bay 1595 3893 5938 3586 25 15036
Wellington 9539 21944 15975 3901 6 51365
South Island 14246 4474 1045 548 30 20342
Grand Total 25990 32952 23963 9151 61 92118
Percentage by Total Area 28.2% 35.8% 26.0% 9.9% 0.1% 100.0%
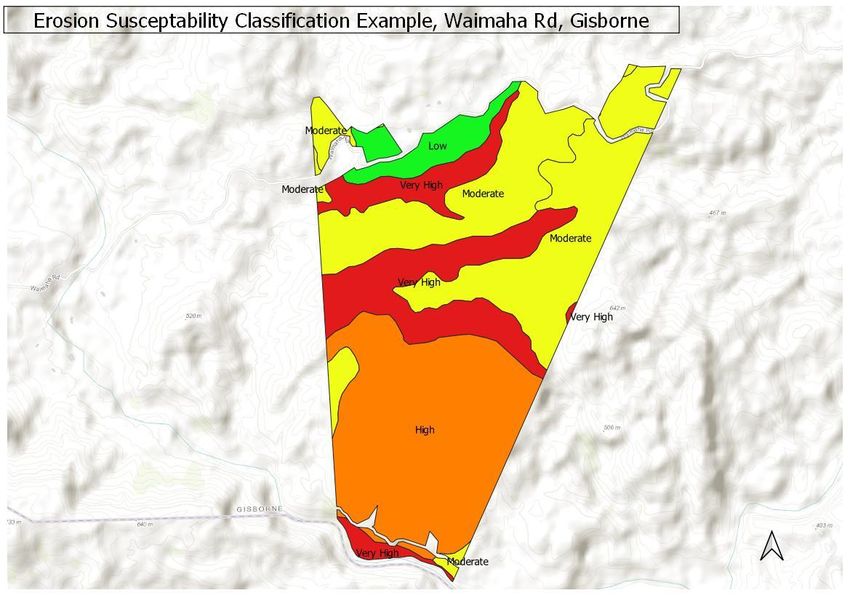
Validation of land-use change from pastoral farming to large-scale forestry Page 20Historically steeper land has been purchased by forestry interests due to its availability/lesser interest from farming and/or for environmental reasons. Carbon forestry (where radiata pine is planted but there is no intention to harvest the trees) and mānuka are two further options which are now attractive on some of this most challenging of ESC classes. Post Cyclone Bola, much land in the East Coast region was planted to secure the ‘hills’ that were deemed unsustainable for farming and required cementing in place to protect downstream infrastructure and livelihoods. Fast forward to today and under the National Environmental Standard for Plantation Forestry (NES-PF) assessment, some of this land in Very High (red) and High (orange) zones cannot be planted without resource consent – which would likely be given once roading and harvest plans were affirmed as being adequate to avoid the consequences of questionable steep land forestry practice seen in recent years in, for example, the Tolaga Bay and Nelson areas. Additionally, whereas three to four decades ago mānuka was being cleared to plant forest and create clear farmland, today planting mānuka offers a potential economic use on the same exposed land, providing an alternative species to Pinus radiata. To support pastoral farming, traditionally regional councils have targeted the Very High erosion class land (LUC 8), some LUC 7e and occasionally some LUC 6e land on farms for erosion control planting with poplar and willow poles or full ‘retirement’ into both production and/or protection forest. Unfortunately, this type of support for farmers wanting to continue farming has not always extended into the better LUC 6 and 7 country, possibly making it difficult for farmers with mixed land types to economically protect their land from erosion in a way which makes sense for livestock production (see Figure 4). Further analysis of this data could for example provide more information on which land types are destined for mānuka planting/natural regeneration, and whether very highly erodible land is going into permanent (carbon) forests. Figure 4: Example of an ESC classification Validation of land-use change from pastoral farming to large-scale forestry Page 21
5.3       Comment: the value of LUC ESC and LUCAS information
The LUC and ESC systems are both now well-established as descriptors of topography and erosion susceptibility
and are used extensively to regulate and guide land use. They also inevitably influence the perceived and actual
value of land on the open market.

Hill country farms in NZ are made up of a large percentage of LUC Classes 5, 6 and 7 land and some of these
are very profitable. It is fair to say, however, that the steeper the land (i.e. higher LUC and ESC classes), the
higher the production costs to generate the same farming output per hectare compared with land in lower
LUC/ESC classes. The same can be said of forestry, where, within reason, while land productivity is less
sensitive to topography and erosion potential, costs of production are sensitive to these site factors. Some of the
country’s best forest growth rates are seen on steep to very steep land in areas of moderate to high erodibility in
the eastern North Island.

Equally, there are farms on lower LUC land that due to climatic conditions, choice of farming approach and other
factors, are not as profitable as might be expected. However, the data suggests that forestry investors
understand and are confident of the potential of land in high LUC/ESC classes in the price range at which the
land is currently available. Land which is sometimes considered over-priced by farmers because of its LUC class,
production history (and the realistic short-to-medium term expectations of those farmers) may well currently be
within the price range of forestry investors, who are judging it on its long-term potential in an environment where
carbon returns add significantly to returns from timber. Land classified as ‘High’ in the ESC currently appears to
have significantly better projected return on investment per hectare in plantation or permanent/carbon forestry,
than in pastoral use.

    5.4       LUCAS Layer Analysis
As well as the ESC and LUC analysis undertaken, property shapefiles were intersected with the 2016 LUCAS
Layer.

The LUCAS Land Use Map comprises New Zealand-wide land use classifications (11) nominally at 31 December
2016. This provides additional broad information on the land use and potential changes to the Pastoral Grazing
estate identified. A total of 16.1% was recorded as being in natural forest with an additional 11.4% already in
some form of exotic forest.

Table 10 : LUCAS 2016 layer

                                                         Gisborne- Rest of North                Grand Total Percentage by
        LUCAS 2016 Layer                Northland                                South Island
                                                        Hawkes Bay    Island                     (Hectares)     Total
Cropland - Annual                                                                    75             75          0.1%
Grassland - High producing                 3232            3624       13150         2280           22285        24.2%
Grassland - Low producing                   427            7929       21646         8101           38103        41.4%
Grassland - With woody biomass              365            1064        2569         2204           6202         6.7%
Natural Forest                              752            1154        8635         4259           14801        16.1%
Planted Forest - Pre 1990                   267             293        1114          651           2325         2.5%
Post 1989 Forest                            326             907        4221         2731           8185         8.9%
Other                                                       31            0           0             32          0.0%
Settlements or built-up area                                                          1              1          0.0%
Wetland - Open water                         3              34           29           6             71          0.1%
Wetland - Vegetated non forest               4               1                       34             39          0.0%
Grand Total                                5375            15037      51365         20342          92118       100.0%

Validation of land-use change from pastoral farming to large-scale forestry                                       Page 22
Figure 5: Example of a LUCAS classification
5.5 Distance to the nearest port
Around 50% of New Zealand’s radiata pine crop goes ‘over the wharf’ as logs into export markets. All forest
harvests produce logs of varying quality, the vast majority of which must be sold at a profit if the harvesting
operation is to be financially worthwhile. Often a large proportion of lower quality logs are sold to export, as
overseas demand is strong and there are few markets in New Zealand that want these logs and/or pay the prices
received in the export market.
Beyond a certain distance and depending on a range of variable factors including the log price, harvesting costs,
transport costs and shipping costs, it becomes uneconomic to transport logs. Historically the margins of this
distance have been considered to be around 200 km, but less when any of the costs increase or log prices are
low.
At least 21 properties, totalling 12,565 ha, were identified between 150 km and 200 km from the nearest port. At
present, this land, which might be considered remote and therefore of lower market value by farmers and pre
carbon/’low log price’ days was also less attractive as a forestry investment. With the now established carbon
(cash) flows available to forests plantings in these higher distance to market areas, forestry is now an attractive
option. Forests closer than 150 km to a port are those most likely to be managed for both timber and carbon
revenues (based on current industry log revenues and costs) unless purchased by entities that have a carbon-
only focus from the outset. In this respect it is estimated that a gross area of 26,547 Ha (20,110 Ha Nett) of total
sales identified during the period, were to carbon focused companies – i.e. forestry that is not intended to be
harvested.
There may be several opportunities during the life of the crop to decide whether to manage the crop for timber or
solely for carbon. The fall-back position for these forests – no harvest – is still an attractive investment proposition
at present: the current ETS review and associated new ‘averaging’ rules have the potential to significantly
influence future decisions around whether to harvest forests or retain them purely as carbon assets.
Validation of land-use change from pastoral farming to large-scale forestry Page 23Forests less than 150 km – 200 km from the port are generally believed to be suitable for timber production and
should benefit from both timber and carbon revenues. These forests will generate employment at certain times
during their rotation especially at harvest and replanting.
We have calculated the distance to the nearest log-exporting port for all whole-of-farm properties at the end of
stage two (Appendix B). Table 11 below shows this data for properties in the Greater Wellington Region, and
highlights that some of these properties are closer to the Port of Napier than Centre Port in Wellington.
Table 11 : Examples of distance to port for a selection of Greater Wellington properties
Distance to Port (km)
Greater
Wellington Area Napier Wellington
Location ID
201 169
202 165
204 131
205 204
206 174
208 116
209 181
210 169
212 154
214 126
216 107
217 131
218 153
219 98
220 202
221 170
222 172
223 201
224 198
225 161
226 206
230 181
231 178
232 133
233 154
234 82
235 139
236 173
237 175
238 116
239 177
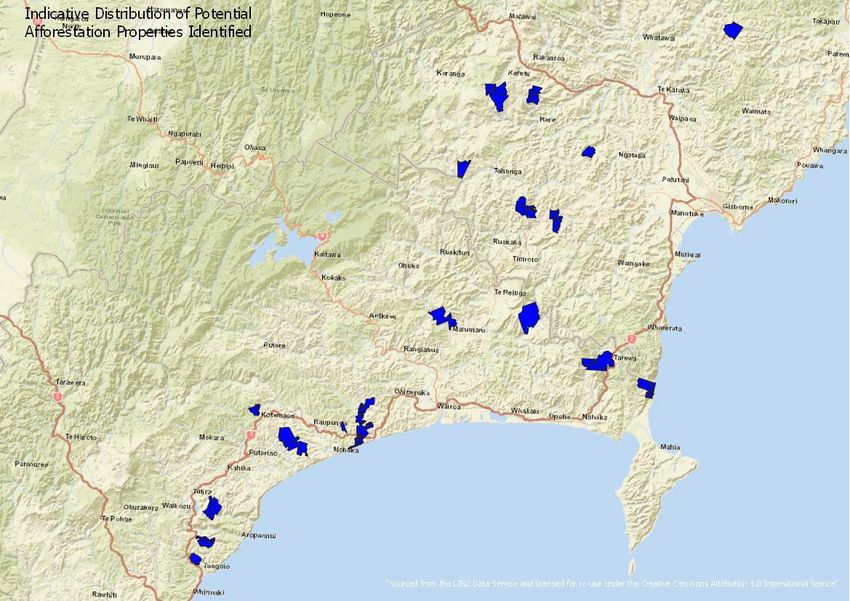
Validation of land-use change from pastoral farming to large-scale forestry Page 24Figure 6 illustrates the same data geographically and confirms that many of the recent property purchases in the northern Wairarapa are in the zone which could become marginal if costs increase. Again, this goes some way to explaining the concerns of some who live and farm in these areas, and who are no doubt aware of the potential for these properties to simply be allowed to grow ‘forever’ with very low labour inputs or tangible benefits for the district. Figure 6: Distance to port of Lower North Island land acquisitions Validation of land-use change from pastoral farming to large-scale forestry Page 25
6. Discussion
6.1       Why is farmland being sold?
Of the whole of farm sales identified, 90% of the land is in Land Use Class 6 or higher. We have not identified
the LUC under partial farm sales and plantings, but anecdotal evidence suggests that similar land has mainly
been planted.

Much of the land sold has been identified as being a considerable distance from the nearest port (and hence a
larger city centre) and often a reasonable distance from a larger population centre. Both high LUC and
remoteness have long been known to affect underlying land values, but more so for farming than forestry. As
discussed in Section 5.5, forests can be planted 200 km from the nearest port and still be an attractive economic
investment as long as log prices and operational costs align. Farming this far from a major population centre can
be difficult, especially where rural communities are struggling to keep their schools and other amenities open.
This again influences the relative value of land in the eyes of farming and forestry purchasers.

It is important to acknowledge that many farmers love what they do, and many ‘make money to farm, rather than
farm to make money’. However, with projected returns on forestry investment increasing due to the addition of
carbon revenues, ‘forestry’ has been prepared to pay more for the land than ‘farming’, and as forestry buyers
have arrived on the scene, some landowners have chosen to take the opportunity to benefit with the time being
right to move on to the next farm or next stage in life.

In our experience, land sales and partial farm conversions from farming to forestry in recent times have been
made for many reasons, but two predominant ones are as follows:

     A. Land sales - achieve an acceptable capital gain on land that allows transition to another farm
        elsewhere or stage in life

          The following have been observed:
               a. many properties sold have been marketed or were being developed with a view to being on-sold
                  at some stage to allow movement up the farming ladder or retirement.
               b. land prices had been relatively static until the recent interest from forest investors with ability to
                  pay more for the more remote and possibly less productive land than farming interests. Forestry
                  investors have been able to pay thanks to strong log prices, a rise in the carbon price, and
                  expectations this will continue to rise, particularly following the amendments to the Emissions
                  Trading Scheme in 2020. Key drivers influencing the carbon price include an increase in the
                  Fixed Price Option for surrender to $35/NZU (from $25/NZU) and the move to auctioning.
                  Introduction of averaging, equating to 16 years of ‘enduring carbon’ for P.radiata and also the
                  introduction of a Permanent Forest Category, which allocates carbon for 50 years initially, will
                  also add to the attractiveness of forestry from 2023 onwards.

     B. Partial farm plantings - increasing returns from poorer performing land, allowing more resources
        to be targeted at better land on the farm
          Here the aim has been to optimise resource inputs and improve on farm financial and environmental
          returns. Change levels may be affected in many ways including:
               a. the ability of the land to be sustainable long-term as a pastoral operation.
               b. the management approach the owner is prepared to operate under.
               c.   the governance ability of the owner/s to change direction.
               d. the above factors affect the willingness of the bank to ‘underwrite’ the funding of required
                  changes.

Validation of land-use change from pastoral farming to large-scale forestry                                    Page 26
6.2 Partial farm plantings and mixed land use: a new era? Judicious planting within the farm boundary is now being perceived to add value through improved cashflow along with a reduction in net farm emissions, reducing the risk and costs associated with emissions that a farm might face going forward. Evidence of this can be seen in the uptake of two Government initiatives designed to encourage new planting with both national carbon targets and environmental benefits in mind. The Crown Joint Venture forest plantings launched in 2017 were initially oversubscribed at their target of 24,000 ha. As at 16/11/20, 21,822 ha were declared actually contracted and the tables have been adjusted to reflect the official count. Figure 1: Location of Crown Joint Venture plantings (Source: MPI Contracted Crown Forestry Projects 16/11/20) Validation of land-use change from pastoral farming to large-scale forestry Page 27
The Joint Venture initiative enabled some whole farm plantings prior to a policy change but also some partial
farm plantings where quite large areas (from a ‘within farm’ perspective) have been planted on less favoured
land. Outcomes expected include increased overall farm income (both in the short and longer term), better
environmental and emission outcomes, a reduction in costs, and often, less labour input. Our anecdotal evidence
suggests that several whole-of-farm sales have been avoided thanks to this fund.

The One Billion Trees programme (targeted at current farm owners) has been remarkably successful.

Initial funding for Pinus radiata was stopped and funding for other exotic species reduced as the quotas for these
species were filled. The 1BT programme appears now to be on hold as MPI reassess how they will go forward
but it is hoped that grants will re-start, to continue the upsurge in in farm plantings that they clearly catalysed.

An impressive spread in the uptake of 1BT by landowners planting smaller marginal areas on their properties is
demonstrated in Figure 8 below:

Figure 2: Location of approved 1BT grants
(Source: MPI Approved One Billion Trees applications 16/11/20)

Validation of land-use change from pastoral farming to large-scale forestry                                 Page 28
Interesting regional differences in 1BT plantings are evident.

South Island 1BT grants were heavily weighted in favour of exotic plantings (72%). This is potentially a function
of the lower levels of carbon allocated using the MPI sequestration tables in the South Island meaning that the
six-year stand down period from the ETS for P.radiata works out at less than the grant received.

The North Island regional tables in general meant that the six-year stand down period for P.radiata reduced the
carbon income for landowners by more than the value of the grant, resulting in only 29% of the total currently
allocated. Native plantings which received $4,000/ha were more heavily favoured (71%).

This aspect of the scheme should be encouraged, especially to help landowners with their obligations under the
new Freshwater regulations alongside the emerging emissions reduction targets.

At the same time, we are seeing increasing recognition within the hill-farming community that mixed land-use,
where ‘the right trees in the right place’ form part of the overall farming business, may be one positive way of
diversifying and increasing the economic, environmental and social sustainability of the land. If farmers already
have experience with trees and forestry, or are confident of the support available in what may not be core
business to date, then indications are this will provide further confidence to consider investing in forestry as part
of the land-use mix.

If farmers looking to compete in land purchase understand the benefits of multiple land-use better, it may also
change what they are comfortably prepared to offer for land when it does come on the market.

The following link is to the MPI 1BT Summary as at 31/12/20:

https://www.mpi.govt.nz/dmsdocument/44911-One-Billion-Trees-Fund-24-Month-Monitoring-and-
Evaluation-Report

Validation of land-use change from pastoral farming to large-scale forestry                                 Page 29
You can also read