Location biases in ecological research on Australian terrestrial reptiles - Nature
←
→
Page content transcription
If your browser does not render page correctly, please read the page content below
www.nature.com/scientificreports

            OPEN           Location biases in ecological
                           research on Australian terrestrial
                           reptiles
                           Renee Louise Piccolo1 ✉, Jan Warnken1,3, Alienor Louise Marie Chauvenet1,2 &
                           James Guy Castley1,2
                           Understanding geographical biases in ecological research is important for conservation, planning,
                           prioritisation and management. However, conservation efforts may be limited by data availability and
                           poor understanding of the nature of potential spatial bias. We conduct the first continent-wide analysis
                           of spatial bias associated with Australian terrestrial reptile ecological research. To evaluate potential
                           research deficiencies, we used Maxent modelling to predict the distributions of 646 reptile studies
                           published from 1972 to 2017. Based on existing distributions of 1631 individual reptile study locations,
                           reptile species richness, proximity to universities, human footprint and location of protected areas, we
                           found the strongest predictor of reptile research locations was proximity to universities (40.8%). This
                           was followed by species richness (22.9%) and human footprint (20.1%), while protected areas were the
                           weakest predictor (16.2%). These results highlight that research effort is driven largely by accessibility
                           and we consequently identify potential target areas for future research that can be optimised to ensure
                           adequate representation of reptile communities.

                           Conservation efforts are frequently targeted towards securing protected area networks1, and the development
                           of effective conservation instruments requires detailed, spatially explicit and comprehensive data on ecological
                           communities2,3. Therefore, understanding spatial bias in ecological information that underpins the planning,
                           design and implementation of biodiversity conservation measures is critical2–5. Declining field-based research
                           and a greater reliance on meta-analyses and large datasets for modelling6, have revealed that large-scale analy-
                           ses of biodiversity data (e.g. occurrence records) can be limited by the coverage and adequacy of their response
                           data7,8. Therefore, indiscriminate utilisation of accessible datasets without understanding potential sources of
                           bias within them could deliver poor conservation decision-making. Additionally, several taxonomic groups are
                           under-represented in ecological studies, especially where such species are obscure and less charismatic9, poten-
                           tially leading to further bias.
                               Globally, reptiles have been the subject of substantially less ecological research compared to other vertebrates
                           such as birds and mammals9,10. Factors contributing to the relative paucity of reptile research include the difficulty
                           in sampling cryptic reptile species11; reptile anti-social behaviours portrayed as less appealing to study12; or the
                           fearsome reputation of some reptiles shaped by societal attitudes13. Such overall poor appeal can influence prior-
                           itisation of species conservation14.
                               Global reptile diversity is the highest of all terrestrial vertebrates15, particularly so in Australia16,17, yet their
                           under-representation in research has led to major knowledge deficiencies in reptile ecology10,18. Existing spatial
                           bias as a result of greater sampling effort in regions of high species richness has been highlighted for work on
                           island reptiles19 and vouchered plant specimen20. Such focus has generated a concentration of ecological research
                           localities in biodiversity hotspots and tropical regions5,10. Preferences for choosing research locations has also
                           been shown to be affected by ease of access4,8 and proximity to higher human population density2,21. Conscious
                           bias in selecting sampling sites may deliver greater efficiencies where surveys are targeting uncommon species
                           at the local scale22, but the effects of such bias may be more noticeable at regional or national scales. Such spa-
                           tial biases can consequently result in unreliable estimates of population sizes, species richness and community
                           dynamics, or simply result in blank spots, i.e. locations that are poorly studied3,20. Furthermore, global conserva-
                           tion assessments such as the IUCN Red List frequently rely on accurate estimates of population sizes, distributions

                           1
                            School of Environment and Science, Griffith University, Gold Coast campus, Australia, 4222. 2Environmental Futures
                           Research Institute, Griffith University, Gold Coast campus, Australia, 4222. 3Australian Rivers Institute, Griffith
                           University, Gold Coast campus, Australia, 4222. ✉e-mail: r.piccolo@griffith.edu.au

Scientific Reports |   (2020) 10:9691 | https://doi.org/10.1038/s41598-020-66719-x                                                                 1
www.nature.com/scientificreports/                                                               www.nature.com/scientificreports

                           Figure 1. PRISMA flow chart indicating systematic approach and search results for filtering research articles
                           through the Web of Science database.

                           and threats23,24. These assessments are impeded by a general lack of knowledge about species, especially rare ones,
                           but also uncertainty and bias in available data25, particularly with regards to spatial information10,18.
                               This study presents a first continent-wide investigation of the spatial biases in ecological research on Australian
                           terrestrial reptiles through a systematic review of the literature, coupled with an analysis of survey effort using
                           species distribution modelling (SDM)26. Species distribution models are routinely used to model species occur-
                           rence data as a function of multiple environmental predictors27. Such predictive modelling can also be used to
                           identify factors that influence the spatial distribution of certain elements within a landscape (e.g. conservation
                           lands)28. It is therefore possible to empirically assess factors affecting the distribution of research study location
                           distributions, where these were reported accurately, to improve future survey strategies. We hypothesised that
                           accessibility would exert an overriding influence on where research studies had been conducted. Our analysis
                           aimed to: 1) determine the overall spatial pattern of Australian terrestrial reptile ecological research; 2) model
                           the predicted influence of ‘proximity to universities’, ‘human footprint’, ‘species richness’, and ‘protected areas’ on
                           study locations; and 3) recommend target areas for future research priorities in order to address potential spatial
                           bias in Australian reptile research.

                           Methods
                           Literature search.        We completed a systematic quantitative review of peer-reviewed Australian terrestrial
                           reptile research papers published in English using the PRISMA method29 to identify, screen and select relevant
                           papers for analysis. Papers published from 1972 to July 2017 were sourced from the Web of Science database using
                           Boolean searches of primary and secondary keywords (Supplementary S1) across all potential research discipline
                           categories (Supplementary S2). All papers identified were screened to exclude those that were not applicable to
                           this study. Exclusion criteria included studies on captive animals, laboratory only studies, other taxa, studies out-
                           side of Australia, medical related research, studies on museum specimens only and modelling/desktop analyses
                           on previous studies (n = 1136, Fig. 1). Articles that were inaccessible (n = 16) were also excluded from the review
                           (Fig. 1).

                           Database structure. Information from each remaining peer-reviewed article was compiled using two prin-
                           cipal metrics characterising (i) each ‘study’ and (ii) its reported ‘research’. ‘Study’ metrics included; the paper’s
                           title, authors’ names, year and journal of publication, the state or territory where the study was conducted, the
                           number of study sites surveyed, and the geographic coordinates of any location information provided by the
                           authors. Those lacking specific location details were also added to this part of the database. ‘Research’ metrics

Scientific Reports |   (2020) 10:9691 | https://doi.org/10.1038/s41598-020-66719-x                                                              2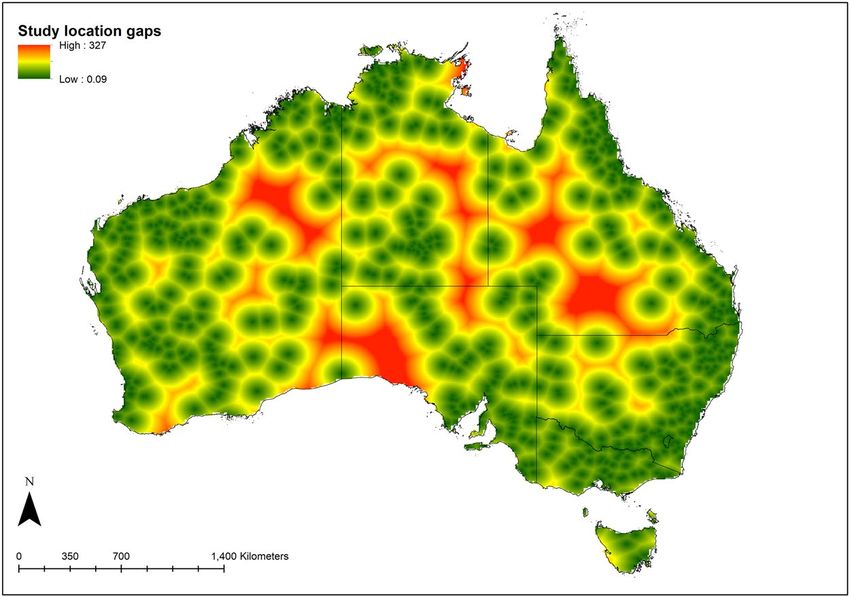
www.nature.com/scientificreports/                                                                 www.nature.com/scientificreports

                           captured the research focus (as primary and sub-categories), methodology used, as well as information about the
                           reptiles studied (Supplementary S3).

                           Study location dataset.           Spatial analysis included only studies with accurate location information (i.e. geo-
                           graphic coordinates) to maximise the potential of our distribution models for evaluating research location pref-
                                                                                                                                  ™
                           erences. Coordinates of identified study locations were mapped as a point layer in ArcGIS 10.4 (ESRI). Where
                           single studies listed multiple sites, each coordinate was treated as an independent study location.

                           Predictor datasets.            We selected four prominent variables as predictors of reptile study locations in
                           Australia: ‘reptile species richness’, ‘human footprint’, ‘protected areas’ and ‘proximity to universities’. The variables
                           were selected based on previous trends in study location biases of other taxonomic groups2,4,21. Other possible
                           environmental predictors that might influence faunal and floral species distributions (e.g. habitat type, climatic
                           zones, local abiotic factors, topography, distance to water etc.) were excluded as they may not have as much influ-
                           ence on where researchers locate their studies. Below we outline arguments for selecting these four key variables
                           for this study.
                               ‘Reptile species richness’ was derived from relevant geographic distribution data available through the work of
                           Roll et al. (2017) and made accessible on the Global Assessment of Reptile Distributions (GARD) website (version
                           1.1, 2017). Each individual species distribution polygon was clipped to the Australian landmass boundary and
                           then intersected with a 10 × 10 km grid cell (100 km2) fishnet layer to determine the number of species expected
                           to occur in each cell. This resolution was selected to reflect (a) the wide variety of sources and, as evidenced by
                           distances >1 km between vertices, global scale used for capturing species distribution layers30 and (b) differences
                           in accuracy of study location coordinate recordings. Accuracy rating was determined by the number of decimal
                           places used for the degree coordinates (decimal or DDD MM SS.S) when recording study locations. The predom-
                           inant rating class covered a range of 1.11 km to 11.09 km.
                               The ‘human footprint’ layer was obtained from the Global Human Footprint Index layer developed by Venter
                           et al. (2016). This layer is representative of human impacts at the landscape scale where the index is a num-
                           ber between 0 and 50, with 0 representing no human influence and 50 the maximum human influence. It is
                           derived from eight, mostly correlated layers: roads, human population density, pasture lands, crop lands, railways,
                           night-time lights, navigable waterways and built environments. For this reason, these stand-alone layers were
                           not considered in isolation in our models. Standardised index values were available as a single layer at 1 km2
                           resolution31.
                               The ‘protected area’ layer was sourced from a national polygon layer published in 2016 under the Collaborative
                           Australian Protected Areas Database (CAPAD) project by the Commonwealth Department of Environment and
                           Energy32. Protected areas are defined as any area within the Australian protected area database and include all
                           binding formal and informal reserves (i.e. national parks, reserves, indigenous protected areas, conservation cov-
                           enants, etc.)32. This layer was converted into a binomial raster with each 100 km² cell having a value of one if more
                           than 50% of the cell was covered by a PA polygon or zero if this condition was not met. Temporal variation in the
                           establishment of individual protected areas was not included. Using a binomial raster also excluded consideration
                           of differences in the level of PAs since this layer was primarily used as a surrogate for well-known biodiversity
                           hotspots or areas of other high conservation values that have received statutory or administrative recognition over
                           the past 50 years. Protected areas were also used as a proxy for threatened species where these networks support
                           varying ranges for different taxonomic groups33. Researcher knowledge of the ‘existence of threatened species’
                           may have affected study location selection; however, this variable was excluded due to major and therefore com-
                           plex changes in scientific knowledge as well as statutory instruments (e.g. variation is threat status classification
                           systems among states), and therefore inventories, that defined threatened species and their communities.
                               ‘Proximity to universities’ was regarded as representing access to a critical mass of logistic and intellectual
                           resources required for supporting field research and its subsequent authoritative analysis of samples. As indicated
                           below (Fig. 2d), much of the Australian land mass has a low or even zero human footprint index, which imposes
                           considerable challenges for undertaking field trips into these largely remote areas. Although most universities
                           and relevant national or state research organisations have outpost research stations, these were still reliant on
                           support from their principal hubs, i.e. the central location of their parent institutions, and therefore within a
                           reasonable distance. Accordingly, the presence of a public or private university was considered as a suitable proxy
                           for a centre of critical research mass required for undertaking field work. These locations also captured hubs of
                           other research organisations in Australia such as state environmental agencies, NRM bodies and NGOs that were
                           typically located in the same urban centres as universities.
                               Where they included the address of a major university campus, centroid coordinates of polygons from the
                           Urban Centres and Localities layer of the Australian Bureau of Statistics for the 2011 population census34 were
                           used for geolocating research hubs. Presence of more than one university or several research organisations was
                           not given any extra weight. The distance to the closest university hub was calculated for each 10 km grid cell using
                           the gDistance function in the rgeos package35 in R (v 3.5.1 R Core Development Team 2013).
                               We investigated the collinearity between all pairs of the four variables and found that all correlations were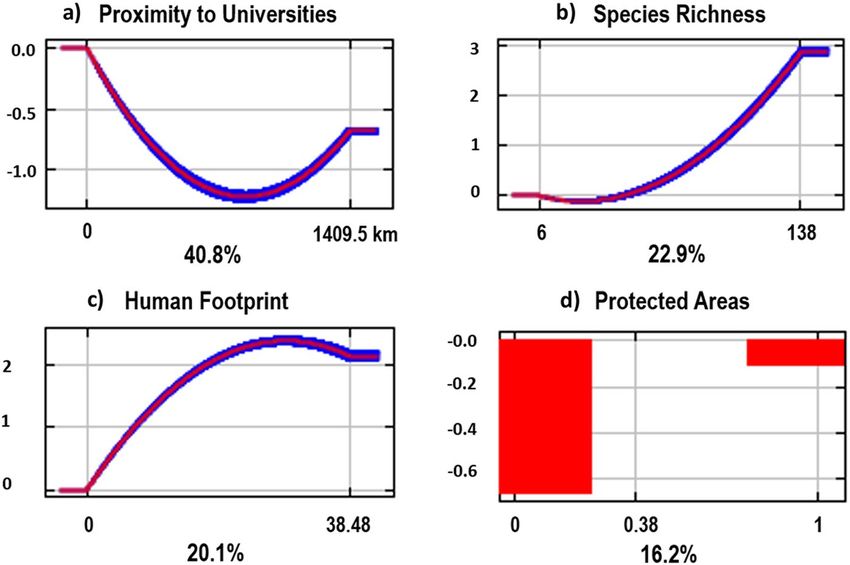
www.nature.com/scientificreports/                                                             www.nature.com/scientificreports

                           Figure 2. Map of Australia showing (a). Individual study locations with the number of study locations
                           identified with larger markers (locations with 10 or more separate sites emphasised in red), medium markers
                           (3–9 sites, orange) and small markers (1–2 sites, green), (b). Species richness indicating high richness in
                           red through to low richness in green, (c). Proximity to universities showing close proximity in green and far
                           proximity in red, (d). Distribution of human footprint showing high densities in red and low densities in green,
                                                                                                          ™
                           and, (e). Protected areas shown in green. Maps were produced in ArcGIS 10.4 (ESRI).

                           meaning groups do not differ, and 1.0 meaning there is no overlap37 A jackknife test measured the importance
                           of each predictor variable in the model, both collectively and independently. The model was fitted with all four
                           predictor variables using linear and quadratic parameters, and logistic transformations.
                               We then used the resultant Maxent predicted study location raster to identify those regions within Australia
                           that were distant from either universities or historical study locations while also having a low likelihood of a
                           study taking place. Here we set a nominal threshold of
www.nature.com/scientificreports/ www.nature.com/scientificreports
Key variable parameters Qld NSW* Vic Tas SA WA NT
Landmass (103 km2) 2,030 1,121 354 123 1,310 3,121 1,508
Study sites 301 301 69 37 249 408 266
X nearest distance ± 1 SE (km) 14.8 ± 1.6 10.8 ± 1.3 19.7 ± 3.1 11.2 ± 4.8 10.0 ± 1.9 19.1 ± 1.4 9.9 ± 1.5
Study site density (study km−2) 0.00001 0.00027 0.00019 0.00030 0.00019 0.00013 0.00018
Sites per paper ± 1 SE 2.8 ± 0.7 2.5 ± 0.6 1.7 ± 0.2 2.7 ± 1.0 1. 7 ± 0.2 2.6 ± 0.8 4.5 ± 1.3
Species richness (100 km−2)
Average 82.7 69.7 45.8 12.7 74.8 85.8 88.4
Max 138 98 76 17 99 122 122
Min 50 29 26 5 13 15 16
Human population 2016 (103) 4,779 7,878 5,927 519 1,736 2,590 245
Population density (p km−2) 2.35 7.03 16.74 4.22 1.33 0.83 0.16
Percent of total population (%) 20.2 33.3 25.0 2.2 7.3 10.9 1.0
PAs 1,190 1,104 3,225 1,612 1,990 1,894 115
PAs total area (103 km2) 160 79 52 29 296 588 340
PA coverage of landmass (%) 7.9 7.1 14.7 23.6 22.6 18.8 22.5
‘University locations’ 6 7 2 1 1 1 1
Table 1. Summary values for key predictor variables in different state and territories in Australia. NOTE: Qld =
Queensland, NSW = New South Wales, Vic = Victoria, Tas = Tasmania, SA = South Australia, WA = Western
Australia, NT = Northern Territory; * = includes the Australian Capital Territory (ACT).
Results
A total of 1201 papers documented research into 387 reptile species across Australia. Geographic coordinates
were missing from 46% of papers leaving 646 articles and 1631 individual study sites for spatial distribution
analysis. Reported reptile study sites were primarily located in Western Australia (n = 408; 25%). New South
Wales and Queensland each had 301 sites (18%), while the lowest number of sites was found in Tasmania (n = 37;
2%) (Fig. 2a). These patterns did not match relevant rankings in either total area, population size or the number
and coverage of protected areas (Table 1). For example, reptile study effort in the Victoria was the most notable
outlier having the second smallest landmass area, second highest resident population and the highest number of
protected areas covering almost one sixth of the State’s total area but only the second lowest number of reptile
study sites (n = 69; 4%) (Table 1). The number of research papers published increased over time with one paper
in 1972 to 44 in 2016 (numbers decreased in 2017 (n = 11) due to an incomplete dataset). The maximum number
published in a single year was 66 from both 2014 and 2015, and 51% of the papers have been published in the past
10 years.
Overlays of species distribution maps from the GARD dataset revealed highest reptile species richness for
areas in northern Queensland (138 species per 100 km2) while this was lowest in Tasmania (Fig. 2b). Other areas
with a higher than average richness of reptile species were identified along the middle of the continent’s northern
coastline and its central landscapes towards the western coast (Fig. 2b).
Australia’s intense concentration of urbanisation within a handful of major cities was reflected by the highest
values of the human footprint index for the greater Sydney, Melbourne, Brisbane, Perth and Adelaide regions.
Larger areas of high development intensity were mapped for areas inland of the south-eastern and south-western
coasts of Australia (Fig. 2c). These patterns were largely mirrored by proximity to universities with some addi-
tional locations in northern Queensland and the Northern Territory (Fig. 2d).
The georeferenced database of Australian protected areas (Fig. 2e, CAPAD, 2017) included 11,181 polygons
with an average size of 138 (±1903) km2. Of all geolocated reptile study sites, 31% fell within protected areas cap-
turing only 2% of the overall number of protected areas (Fig. 2a,e).
Based on study locations reported in the literature, the Maxent model revealed that proximity to universities
(40.8%) contributed most to predicting reptile study locations (Figs. 3 and 4a). Species richness and human
footprint contributed less to the model (22.9% and 20.1% respectively) (Figs. 3 and 4b,c), while protected areas
contributed only 16.2% of the model (Figs. 3 and 4d). These results were reflected in the jackknife variable impor-
tance test, however species richness had less influence on the model prediction when considered independently
(Fig. 5). A 10-fold cross-validation of test samples resulted in an average AUC of 0.757 (std dev = 0.035), mean-
ing there is a 75.7% probability of correctly identifying reptile study locations across the continent based on the
model predictors.
Study location ‘cold spots’ were identified in large parts of western Queensland, the eastern regions of
the Northern Territory as well as the far north-eastern parts of Arnhem Land, western South Australia and
north-eastern Western Australia (Fig. 6). These regions were typically between 200-330 km away from either
universities or other study locations. There was a significant different in the distance from either universities or
historical study locations for all Maxent predicted output values (20% bin categories) (F = 6149.8, d.f. = 4,86495,
P < 0.0001) (Fig. 7), highlighting areas that are potentially oversampled. Grid cells with the lowest study loca-
tion predictability were more isolated (i.e. greatest neighbourhood distances) (mean distance = 123.3 ± 0.44 km,
n = 21761) that those with the highest predictability (mean distance = 15 ± 0.59 km, n = 447) (Fig. 7).
Scientific Reports | (2020) 10:9691 | https://doi.org/10.1038/s41598-020-66719-x 5www.nature.com/scientificreports/ www.nature.com/scientificreports
Figure 3. Model results showing the predicted study location preference based on current records using four
variables (species richness, human footprint, proximity to universities and protected areas). Colour gradient
indicates green as less likely to occur, through to red indicating high predictability of occurrence. Map was
™
produced in ArcGIS 10.4 (ESRI).
Figure 4. The response curves showing how each of the four variables, (a) proximity to universities; (b) species
richness; (c) human footprint; (d) protected areas, affects the Maxent logistic prediction. Outputs have been
averaged from 10-fold cross-validations. Due to protected areas being a categorical (0, 1) variable, the output
was selected from one of the cross-validation runs for easier interpretation. Variable importance (%) shown
below each graph. Y-axis is the probability of finding a reptile study site. Graphs were extracted from model
results using the open source Maxent software (ver. 3.4.1)36.
Discussion
Understanding geographical biases in ecological research is becoming increasingly important for determining
what may be impacting on biodiversity2,4,5. This is the first continent-wide analysis of spatial bias associated
with Australian terrestrial reptile ecological research. Research study locations appear to be most influenced by
Scientific Reports | (2020) 10:9691 | https://doi.org/10.1038/s41598-020-66719-x 6www.nature.com/scientificreports/ www.nature.com/scientificreports
Figure 5. The jackknife test bar chart showing the importance of each variable when run independently. Light
blue bars represent test without the variable, dark blue represents test with variable only and red represents all
variables. Graph was extracted from model results using the open source Maxent software (ver. 3.4.1)36.
Figure 6. Representation of reptile research location ‘cold spots’ within Australia. The regions in red represent
those that are most isolated in terms of their distance to historical locations as well as universities. Map was
™
produced in ArcGIS 10.4 (ESRI).
Figure 7. The mean distance (±SE) of the predicted Maxent study location output grid cells to historical
study locations and universities combined. Grid cells with the lowest predicted likelihood of studies (Category
1 = 80%) were
relatively accessible.
proximity to universities, followed by species richness and human footprint, while the weakest influence was
from protected areas. The combination of social and environmental drivers in predicting reptile study locations
is not unexpected, as similar combinations were identified as predictors of conservation easements in the United
States28. The convenience and accessibility of survey sites can be a key driver in ecological research location
selection as noted in studies on African mammals where bias was evident towards the proximity to universities
and museums38, with the human population index influencing study densities in Australian flora records20, and
with roadside collection biases in herbaria collections8. Additionally, the ease of access has been associated with
increases in the density of study locations, particularly for koala records in Australia39, and studies of birds in
Scientific Reports | (2020) 10:9691 | https://doi.org/10.1038/s41598-020-66719-x 7www.nature.com/scientificreports/ www.nature.com/scientificreports
Africa4. The importance of ‘proximity to universities’ does not imply that research studies are more likely to be
undertaken on university grounds per se, but that study locations have a greater likelihood of being close to these
institutions or associated urban centres. Isolated sampling within and close to urban hotspots could not only lead
to biased representation of species ecology, but erroneous estimates of anthropological impacts19. Considering the
importance placed on accurate spatial data to inform conservation decision-making40,41, there is a potential for
input data to be biased through sampling and this could lead to weaker conservation outcomes.
Although the model predicted that proximity to universities had the greatest influence on study location pref-
erence, the results also indicated higher study location density in areas of higher reptile species richness. Regions
of high diversity are often targeted by researchers due to the increased chance of observations and the known
success of previous recordings19,42,43. While research in such highly diverse areas has been vital in describing new
species over the past several years10, prioritising such areas could lead to other regions being underrepresented in
studies20. Our model provides an opportunity for researchers to identify future study locations that complement
existing data and provide greater representation of all regions, while also highlighting areas that may be prone
to oversampling. Of course, access in remote areas will continue to be a challenge and it is not surprising that
research activity was associated with the human activity index. Researchers typically utilise road networks to
access study areas unless the species of interest can also be recorded through airborne observations (e.g. water-
birds, large mammals)44,45. While future surveys might still rely heavily on road networks for access to regions,
new technologies such as drones provide an opportunity to survey some large species in remote areas44.
Protected areas alone are unable to maintain or conserve global biodiversity, emphasising the importance
in thoroughly understanding the impact of threatening processes, and how to minimise such pressures 46.
Protected areas not only require an understanding from an ecosystem perspective, but finer scale interpretation
of species-specific inhabitants is needed to provide sound planning for conservation strategies47. Our review
found that study locations were generally not greatly influenced by protected areas, despite previous studies indi-
cating an overrepresentation of ecological research in these areas5,20. Our model is also likely to overestimate the
number of studies located in protected areas as no temporal correction was made for studies that were completed
in areas prior to any protected area designation. This highlights that for reptiles at least, research effort has been
more widespread in its coverage.
Our analysis also identified those areas where there has been less research effort to date based on the Maxent
model output as well as a subsequent distance-based assessment of each grid cell. These research ‘cold spots’ that
comprise some ~5.6% of the Australian landscape are located in most Australian states and territories with only
areas in Victoria, the ACT and Tasmania being adequately covered. Directing research effort to these ‘cold spots’
will assist in filling knowledge gaps for Australian reptile communities.
While it is important to understand the impacts from human disturbance and associated threats on ecological
systems and biodiversity2,21, there is also a need to identify gaps in our knowledge that may impact on conser-
vation decision making and landscape management. In this fine-grain continental analysis we have shown that
social elements largely determine where research is conducted. However, our analysis also only reveals a static
interpretation of the spatial distribution of reptile research. It may still be necessary to improve our understand-
ing of the dynamism within fragmented landscapes amidst such regions that could provide vital information on
the ecological status of reptiles. For instance, areas comprised mainly of agricultural lands can undergo changes
in landscape components on a regular basis48. The mosaic landscapes can provide important habitats for many
reptile species, and due to the ongoing disturbances in these regions, further ecological research is needed to gain
a broader understanding of the overall biodiversity status5. We suggest that to successfully assess the ecological
status of Australian reptiles, institutions and funding agencies need to support researchers in reprioritising study
locations based on current spatial deficiencies. This will enable an unbiased measure of pressures and threatening
processes across multiple scales and deliver stronger governance for their protection and conservation.
Received: 11 November 2019; Accepted: 25 May 2020;
Published: xx xx xxxx
References
1. Mappin, B. et al. Restoration priorities to achieve the global protected area target. Conservation Letters, p. e12646 (2019).
2. Trimble, M. J. & van Aarde, R. J. Geographical and taxonomic biases in research on biodiversity in human-modified landscapes.
Ecosphere 3(12) 1–16. (2012).
3. Bellard, C. & Jeschke, J. A spatial mismatch between invader impacts and research publications. Conservation Biology 30(1), 230–232
(2016).
4. Reddy, S. & Dávalos, L. M. Geographical sampling bias and its implications for conservation priorities in Africa. Journal of
Biogeography 30(11), 1719–1727 (2003).
5. Collen, B. et al. The tropical biodiversity data gap: addressing disparity in global monitoring. Tropical Conservation. Science 1(2),
75–88 (2008).
6. Ríos-Saldaña, C. A., Delibes-Mateos, M. & Ferreira, C. C. Are fieldwork studies being relegated to second place in conservation
science? Global ecology and conservation 14, e00389 (2018).
7. Troia, M. J. & McManamay, R. A. Filling in the GAPS: evaluating completeness and coverage of open-access biodiversity databases
in the United States. Ecology and evolution 6(14), 4654–4669 (2016).
8. Daru, B. H. et al. Widespread sampling biases in herbaria revealed from large‐scale digitization. New Phytologist 217(2), 939–955
(2018).
9. Bonnet, X., Shine, R. & Lourdais, O. Taxonomic chauvinism. Trends in Ecology &. Evolution 17(1), 1–3 (2002).
10. Meiri, S. & Chapple, D. G. Biases in the current knowledge of threat status in lizards, and bridging the ‘assessment gap’. Biological
Conservation 204, 6–15 (2016).
11. Hutchens, S. J. & DePerno, C. S. Efficacy of sampling techniques for determining species richness estimates of reptiles and
amphibians. Wildlife Biology 15(2), 113–123. (2009).
12. Doody, J. S., Burghardt, G. M. & Dinets, V. Breaking the social–non‐social dichotomy: a role for reptiles in vertebrate social behavior
research? Ethology 119(2), 95–103 (2013).
Scientific Reports | (2020) 10:9691 | https://doi.org/10.1038/s41598-020-66719-x 8www.nature.com/scientificreports/ www.nature.com/scientificreports
13. Shine, R. & Bonnet, X. Snakes: a new ‘model organism’in ecological research? Trends in Ecology &. Evolution 15(6), 221–222 (2000).
14. Brambilla, M., Gustin, M. & Celada, C. Species appeal predicts conservation status. Biological Conservation 160, 209–213 (2013).
15. Pincheira-Donoso, D. et al. Global taxonomic diversity of living reptiles. PLoS One 8(3), e59741 (2013).
16. Powney, G. et al. Hot, dry and different: Australian lizard richness is unlike that of mammals, amphibians and birds. Global Ecology
and Biogeography 19(3), 386–396 (2010).
17. Rosauer, D. et al. Phylogeography, hotspots and conservation priorities: an example from the Top End of Australia. Biological
Conservation 204, 83–93 (2016).
18. Bland, L. M. & Böhm, M. Overcoming data deficiency in reptiles. Biological Conservation 204, 16–22 (2016).
19. Ficetola, G. F. et al. Sampling bias inverts ecogeographical relationships in island reptiles. Global Ecology and Biogeography 23(11),
1303–1313 (2014).
20. Haque, M. M. et al. How well documented is Australia’s flora? Understanding spatial bias in vouchered plant specimens. Austral
ecology 42(6), 690–699 (2017).
21. Di Marco, M. et al. Changes in human footprint drive changes in species extinction risk. Nature communications 9(1), 4621 (2018).
22. Speak, A. et al. Comparing convenience and probability sampling for urban ecology applications. Journal of applied ecology 55(5),
2332–2342 (2018).
23. IUCN. Australia’s reptiles threatened by invasive species, climate change - IUCN Red List. 2018 [cited 2019; Available from: https://
www.iucn.org/news/species/201807/australias-reptiles-threatened-invasive-species-climate-change-iucn-red-list.
24. Rodrigues, A. S. et al. The value of the IUCN Red List for conservation. Trends in ecology &. evolution 21(2), 71–76 (2006).
25. Hayward, M. W. et al. Ambiguity in guideline definitions introduces assessor bias and influences consistency in IUCN Red List
status assessments. Frontiers in Ecology and Evolution 3, 87 (2015).
26. Elith, J. & Leathwick, J. R. Species distribution models: ecological explanation and prediction across space and time. Annual review
of ecology, evolution, and systematics 40, 677–697 (2009).
27. Phillips, S. J., Anderson, R. P. & Schapire, R. E. Maximum entropy modeling of species geographic distributions. Ecological modelling
190(3-4), 231–259 (2006).
28. Baldwin, R. F. & Leonard, P. B. Interacting social and environmental predictors for the spatial distribution of conservation lands.
PLoS One 10(10), e0140540 (2015).
29. Moher, D. et al. Reprint—preferred reporting items for systematic reviews and meta-analyses: the PRISMA statement. Physical
therapy 89(9), 873–880 (2009).
30. Roll, U. et al. The global distribution of tetrapods reveals a need for targeted reptile conservation. Nat Ecol Evol 1(11), 1677–1682
(2017).
31. Venter, O. et al. Sixteen years of change in the global terrestrial human footprint and implications for biodiversity conservation. Nat
Commun 7, 12558 (2016).
32. (CAPAD), D.o.E.a.E. Department of Environment and Energy. 2017 [cited 2017 October]; Available from: http://www.environment.
gov.au/land/nrs/science/capad
33. Watson, J. E. et al. The capacity of Australia’s protected‐area system to represent threatened species. Conservation Biology 25(2),
324–332 (2011).
34. Statistics, A.B.O. Census QuickStat. 2011 [cited 2017; Available from: https://quickstats.censusdata.abs.gov.au/census_services/
getproduct/census/2011/quickstat/UCL113010 (2011).
35. Bivand, R. et al., Package ‘rgeos’. (2019).
36. Phillips, S. J., Dudík, M. & Schapire, Maxent software for modeling species niches and distributions (Version 3.4. 1). Tillgänglig från
url: http://biodiversityinformatics.amnh.org/open_source/maxent (2017).
37. Fielding, A. H. & Bell, J. F. A review of methods for the assessment of prediction errors in conservation presence/absence models.
Environmental conservation 24(1), 38–49 (1997).
38. Freitag, S. et al. Testing for potential survey bias: the effect of roads, urban areas and nature reserves on a southern African mammal
data set. In Animal Conservation forum. Cambridge University Press (1998).
39. Margules, C. R. & Austin, M. Biological models for monitoring species decline: the construction and use of data bases. Philosophical
Transactions of the Royal Society of London. Series B: Biological Sciences 344(1307), 69–75 (1994).
40. Ferrier, S. & Wintle, B. A. Quantitative approaches to spatial conservation prioritization: matching the solution to the need. Spatial
conservation prioritization: Quantitative methods and computational tools, 2009: p. 1–15.
41. Kujala, H. et al. Not all data are equal: Influence of data type and amount in spatial conservation prioritisation. Methods in Ecology
and Evolution 9(11), 2249–2261 (2018).
42. Soria‐Auza, R. W. & Kessler, M. The influence of sampling intensity on the perception of the spatial distribution of tropical diversity
and endemism: a case study of ferns from Bolivia. Diversity and Distributions 14(1), 123–130 (2008).
43. Meyer, C., Weigelt, P. & Kreft, H. Multidimensional biases, gaps and uncertainties in global plant occurrence information. Ecology
Letters 19(8), 992-1006 (2016).
44. Jiménez López, J. & Mulero-Pázmány, M. Drones for conservation in protected areas: present and future. Drones 3(1), 10 (2019).
45. Kingsford, R. Aerial survey of waterbirds on wetlands as a measure of river and floodplain health. Freshwater Biology 41(2), 425–438
(1999).
46. Baldwin, R. F. & Beazley, K. F. Emerging Paradigms for Biodiversity and Protected Areas. Multidisciplinary Digital Publishing Institute
(2019).
47. Polak, T. et al. Efficient expansion of global protected areas requires simultaneous planning for species and ecosystems. Royal Society
open science 2(4), 150107 (2015).
48. Seabrook, L., McAlpine, C. & Fensham, R. What influences farmers to keep trees?: A case study from the Brigalow Belt, Queensland,
Australia. Landscape and Urban Planning 84(3-4), 266–281 (2008).
Author contributions
Renee L. Piccolo wrote the manuscript text and analysis. James Guy Castley conceptualised and designed the
study and contributed to writing and analysis. Alienor Chauvenet assisted with the spatial modeling and analysis.
Jan Warnken assisted with the spatial analysis. All authors reviewed the manuscript.
Competing interests
The authors declare no competing interests.
Additional information
Supplementary information is available for this paper at https://doi.org/10.1038/s41598-020-66719-x.
Correspondence and requests for materials should be addressed to R.L.P.
Reprints and permissions information is available at www.nature.com/reprints.
Scientific Reports | (2020) 10:9691 | https://doi.org/10.1038/s41598-020-66719-x 9www.nature.com/scientificreports/ www.nature.com/scientificreports
Publisher’s note Springer Nature remains neutral with regard to jurisdictional claims in published maps and
institutional affiliations.
Open Access This article is licensed under a Creative Commons Attribution 4.0 International
License, which permits use, sharing, adaptation, distribution and reproduction in any medium or
format, as long as you give appropriate credit to the original author(s) and the source, provide a link to the Cre-
ative Commons license, and indicate if changes were made. The images or other third party material in this
article are included in the article’s Creative Commons license, unless indicated otherwise in a credit line to the
material. If material is not included in the article’s Creative Commons license and your intended use is not per-
mitted by statutory regulation or exceeds the permitted use, you will need to obtain permission directly from the
copyright holder. To view a copy of this license, visit http://creativecommons.org/licenses/by/4.0/.
© The Author(s) 2020
Scientific Reports | (2020) 10:9691 | https://doi.org/10.1038/s41598-020-66719-x 10You can also read