Cost and Environmental Impact Analysis of Waste Oil Utilization in Coal Mining Industry: A Case Study of PT Berau Coal
←
→
Page content transcription
If your browser does not render page correctly, please read the page content below
Review of Integrative Business and Economics Research, Vol. 10, Supplementary Issue 1 254
Cost and Environmental Impact Analysis of
Waste Oil Utilization in Coal Mining Industry: A
Case Study of PT Berau Coal
Saeful Aziz
School of Business and Management Institut Teknologi
Bandung, Indonesia
Taufik Faturohman*
School of Business and Management Institut Teknologi Bandung, Indonesia
ABSTRACT
PT Berau Coal, as a company engaged in the energy sector for coal commodities,
contributes to global energy supply. One of the efforts of PT Berau Coal in maintaining
environmental compliance is implementing the 3R waste oil utilization as a blending
agent for blasting activities in the mining process. This improvement project provides
multiple benefits to the company especially in terms of financial and environmental
aspects. This research calculates the gap defined as the loss of opportunity that occurred
in the 2015-2020 period and provides the optimization scenario for the utilization of waste
oil in the 2021-2025 period to create the optimal impact on cost efficiency and
environmental impact. The research scope and methodology are viewed from the
financial aspect with the capital budgeting concept approach and environmental aspects
through the Proper concept approach and carbon pricing to monetization of carbon
emission reduction benefits. The results show that the optimum impact of optimization of
waste oil on cost efficiency is IDR 38,049.63 Mio. The optimum contribution of reducing
energy consumption intensity and GHG emission intensity increased by 0.62% and 0.04%
from the achievement with exiting performance. In conclusion, waste oil utilization
provides optimum multiple impact by 100% composition implementation.
Keywords: waste oil utilization, capital budgeting, energy and emission intensity,
monetization of carbon emissions.
1. INTRODUCTION
1.1. Background
Coal plays an important role in meeting global energy needs and is crucial for
infrastructure development – 38% of the world’s electricity and 71% of the world’s steel
is produced using coal. Indonesia is one of the world’s top coal exporters. The large
quantity of Indonesia’s coal exports is not proportional to the percentage of coal reserves
owned by Indonesia to the percentage of world coal reserves. Of the total 891 billion tons
of world coal reserves, Indonesia has around 30 billion tons of coal reserves, which is
around 3.1% of world coal reserves (BP Statistical Review, 2016).
Copyright 2021 GMP Press and Printing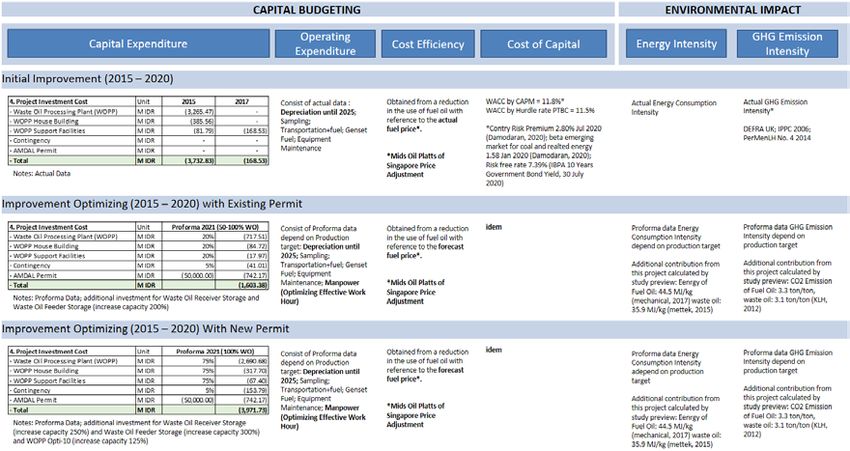
Review of Integrative Business and Economics Research, Vol. 10, Supplementary Issue 1 255
From an environmental perspective, Indonesia was the fourth largest emitter of
greenhouse gases in the world in 2015. Indonesia's economy is the 16th largest in the
world and the largest in Southeast Asia. The highest source of emissions comes from
deforestation and peat forest fires, followed by emissions from burning fossil fuels for
energy.
From the information above, it can be seen that the world coal trade continues to develop.
Trade competition for coal commodities is very competitive, including Indonesia is
involved in it. Accuracy in implementing the cost leadership strategy is one of the keys
to strengthening the position and competitiveness in the market, one of the forms can be
in the form of cost efficiency, branding commitment to compliance with environmental
management and minimizing environmental pollution.
This increase in coal production demands the addition of mining operational equipment.
In most coal mining industries, the mining method commonly used is the conventional
method, one of which is characterized by the use of heavy equipment to dig, transport,
and support various other mining activities. Most of the equipment used for its operation
still relies on fuel oil and various types of oil and lubricants. According to Ruhe (1999)
fuel used as a material for making ANFO can be mixed with used oil so that it can reduce
the use of fuel. According to SNI Number 7642 (2010) a mixture of used oil with diesel
can be done with a maximum ratio of 80%:20%.
Based on the Good Mining Practice concept there is an opportunity to reduce the
environmental impact of mining business activities through the design and operation of
processing plants that can reduce toxic waste, or to recycle or reuse waste through cleaner
production initiatives and industrial ecological initiatives. Hazardous and Toxic waste
utilization activities including the use of used oil as a substitute for diesel fuel in mixing
explosives have benefits for the environment, economy, and social. This step is one of PT
Berau Coal's efforts to get multiple benefits to reduce the impact on environmental
pollution while increasing cost efficiency as a form of commitment to the implementation
of Good Mining Practice principles.
In the coal mining industry, overburden stripping is the initial activity before coal getting.
There are several ways to remove overburden, including digging, ripping, and blasting.
At PT Berau Coal, the method used for overburden stripping is the blasting method.
Blasting method was chosen because PT Berau Coal has relatively hard rock
characteristics in overburden.
The large volume of OB material will be directly proportional to the amount of explosives
used to disperse the OB material. Blasting activities at PT Berau Coal use 3 types of
explosives, namely emulsion, ANFO and gel. ANFO itself stands for Ammonium Nitrate
Fuel Oil with a mixture ratio of AN and FO of 94.3%:5.7%. This comparison can produce
zero oxygen balance where the blasting product will not release poison / fumes because
of the excess of one of the blasting materials.
Copyright 2021 GMP Press and Printing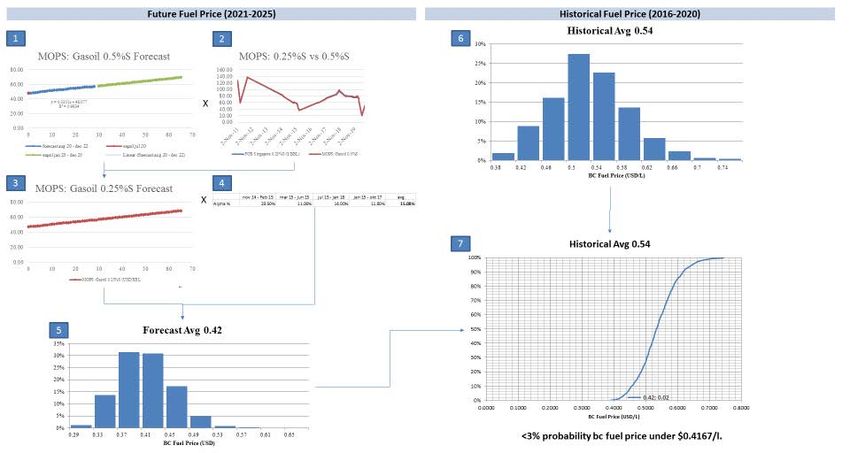
Review of Integrative Business and Economics Research, Vol. 10, Supplementary Issue 1 256
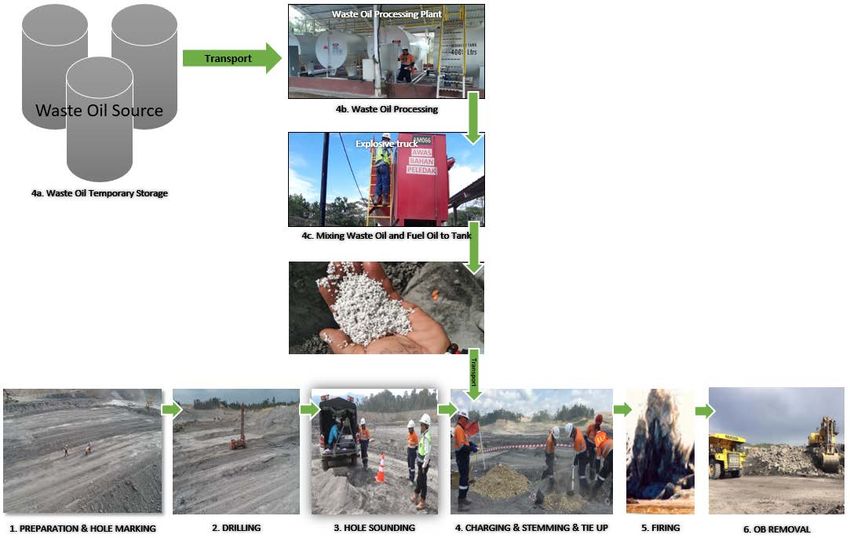
Figure 1.1. Drilling and Blasting Activities at PT Berau Coal
Drilling and blasting activities at Figure 1.1, The five stages are:
• Preparation and hole marking, is the activity of preparing the drilling area for blasting
and marking drill points in accordance with the blasting design.
• Drilling, is drilling activity for blasting in accordance with predetermined points.
• Hole sounding, is the activity of measuring the depth of the hole to calculate the need
for explosives and stemming for each hole.
• Charging and stemming and tiep up, are a series of activities carried out after each
sounding hole has been completed. Charging, is the activity of inserting explosives
into the hole at a certain amount. As shown in Figure 1.1, one of the mixers of
explosives is fuel oil. At PT Berau Coal, the role of fuel oil is partially / completely
replaced by waste oil as one of the company's commitments in making efficient use
of fuel oil. The efficient use of fuel oil contributes to the efficiency of operational
costs and has a positive impact on the environment by reducing the intensity of energy
consumption and emissions. Stemming, is an activity carried out after charging,
namely closing the holes at a certain amount with aggregate / similar materials.
• Tie up, is the process of connecting inter connections between the blast holes so that
they are centralized to a single initiator called a blasting machine.
An overview of the mixing process of ANFO and emulsion can be seen in Appendix 3.
1.2. Problem Statement
PT Berau Coal has obtained permits for the use of waste oil as a substitute for fuel oil as
a mixing of explosives up to a composition at a composition of 50% in 2016, 50-100% in
2019, and the process of applying for a utilization permit up to a composition of 100% in
all types of explosives used (there are at least 3 types of explosives so far used at PT
Copyright 2021 GMP Press and Printing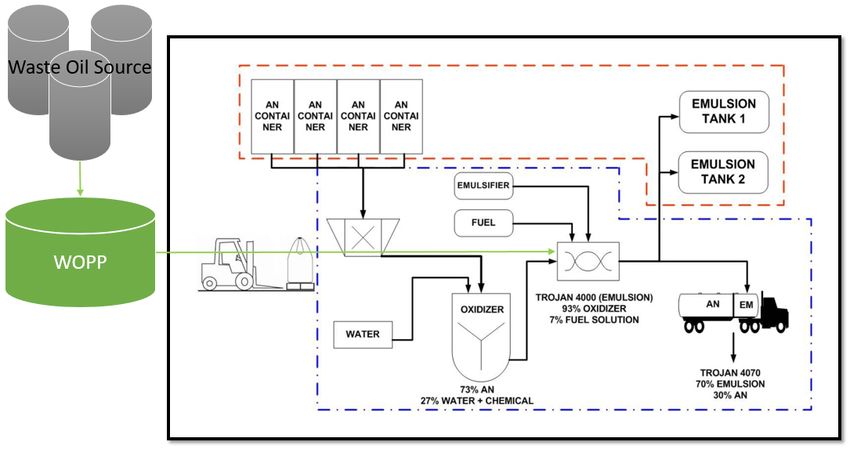
Review of Integrative Business and Economics Research, Vol. 10, Supplementary Issue 1 257
Berau Coal, ANFO type, type emulsions, and type of watergel with the portion of mixing
of fuel oil will range from 1% - 6%). Until now in 2020, PT Berau Coal is only able to
realize the use of waste oil as a maximum explosive mixing at a 50% portion only on the
type of emulsion explosives with a level of consistency that is not optimal. In terms of
business and ethics, PT Berau Coal has lost the opportunity of a gap between the existing
waste oil utilization permit and the actual implementation. Various obstacles are faced,
both technically, administratively, and managerially so that the continuous improvement
in this project tends to be stagnant. Therefore, it is necessary to identify the impact on
costs and the environment from the optimization scenario of the utilization of oil waste
as a substitute for fuel oil as an explosive mixer up to a maximum of 100% according to
the available permit space. The results of this study aim to encourage management to
direct policies that are in line with the value of sustainable improvement in this case
related to the utilization of oil waste as an explosive mixer so that it can provide an
optimal impact both for PT Berau Coal and the environment. The most important thing is
the commitment of PT Berau Coal in developing policies oriented to sustainable
improvement that will provide a positive atmosphere in encouraging all lines to take part
in giving the best for the company at various project scales.
1.3. Research Questions
The problem identification process of this research is approached by answering following
questions:
1. Has the waste oil utilization as explosive mixing had the optimal impact on costs
and the environment in 2015-2020?
2. What is the potential impact on costs and the environment if the waste oil
utilization as the explosive mixer is optimized in 2021-2025?
3. What is the profile of the integration of the potential impact on cost and
environment from the realization of proposed optimizing scenarios of waste oil
utilization as the explosive mixing in 2021-2025?
1.4. Research Objectives
To Analyze the cost and environmental impact of the waste oil utilization scenario as a
substitute for fuel oil in mixing explosives to generates the maximum benefit to PT Berau
Coal.
1. Analyze the cost and environmental impact of the waste oil utilization as the
explosive mixing in 2015-2020
2. Analyze the potential cost and environmental impact of the optimization scenarios
of waste oil utilization as the explosive mixing in 2021-2025
3. Analyze and determine the integration of potential impact on cost and
environmental from the realization of proposed optimizing scenarios of waste oil
utilization as the explosive mixing in 2021-2025
1.5. Scope and Limitation
The limitations of this research are:
Copyright 2021 GMP Press and Printing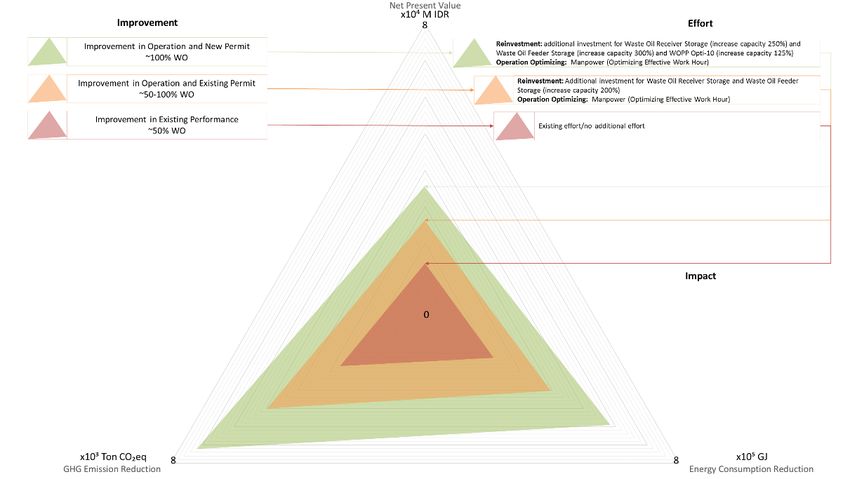
Review of Integrative Business and Economics Research, Vol. 10, Supplementary Issue 1 258
1. Cost impact analysis uses the concept of capital budgeting with a cost structure
focused on financing in an effort to use waste oil as a substitute for fuel in
explosive mixtures.
2. Environmental impact analysis refers to the Regulation of the Director General of
Pollution and Environmental Damage Control NO.P.21 / PPKL / SET / KUM.I /
10/2018 about benchmarking the coal mining industry sector and monetization of
emission reductions benefits.
3. The monetization concept is used to convert the carbon emission reduction benefit
value into currency by referring to the carbon tax scheme.
4. Historical financial and environmental data used is all related data from 2015 –
2020 the beginning of this project was initiated, the projection period to be
analyzed is from 2021 – 2025 refers to the limit of PT Berau Coal's PKP2B (Coal
Mining Exploitation Work Agreement).
5. Capital expenditure information is based on actual data from PT Berau Coal.
6. Production plan data for 2021 - 2025 refers to PT Berau Coal planning data.
2. PREVIEW STUDY
2.1. Efficiency of Innovative activity
The article “Construction of Efficiency Indicators for Innovative Activity in Russia’s
Regions” (Rudskaia & Rodionov, 2017) is involved in various conditions of activities in
various departments at PT Berau Coal so as to get a comprehensive and integrated picture
of the impact-effort project. The article states that there is a time lag between innovation
and the output of innovative activities which can be defined as, first, by the amount of
investment, and second, by the technology life cycle prevailing in one place. The concept
of efficiency is always based on the ratio of output to cost. A producer is efficient if it
achieves maximum output with the available resource pool, or achieves the required
output with the minimum resources involved (Greene, 1997). It should be noted that
efficiency as understood in this way is only part of the understanding of the productivity
of an economic system. In order to carry out a complex analysis, it is also necessary to
select indicators for measuring efficiency and the extent to which the system is compatible
with the selected development goals (outputs achieved, likelihood of achieving them,
quality and acceptance as development goals) (Greene, 1997), as shown in Figure 2.1.
Two main types of efficiency are usually characterized in the literature - technical and
allocative (price). Allocative efficiency (price) characterizes the efficiency level of the
resource allocated to the price at which purchasing and distribution are managed.
Given the above considerations, we first look at the technical efficiency of innovative
activities in an area. Technical efficiency is understood as the ability to produce outputs
with certain resources. According to the initial definition formulated by T.C. Koopmans
in 1951, “The producer is technically efficient if increasing output requires reducing at
least one other output or increasing at least one input, and if reducing input requires
increasing at least one other input or reducing at least one output. (Koopmans, 1951).
Copyright 2021 GMP Press and Printing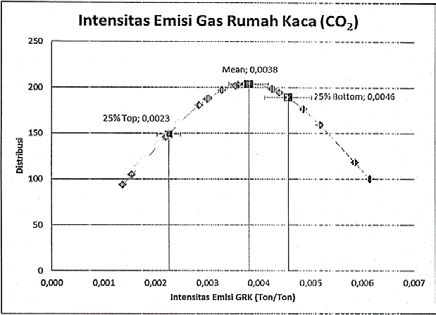
Review of Integrative Business and Economics Research, Vol. 10, Supplementary Issue 1 259
Figure 2.1. Contribution of efficiency and effectiveness in the productivity of an
economic system
2.2. Economic Indicator and Investment Evaluation
• Net Present Value (NPV)
Definition:
According to Modigliani-Miller, Net Present Value (NPV) is defined as present value
of all cash flow minus Initial Investment (Dr.Rodney Boehme: nd). The NPV method
is important for the investors because it takes into account the time value of investor’s
money (Gitman, L.J., and Chad, I.Z., 2012). The NPV method is the investors expect
a return on the money that they spent for the project. The rule is when the present
value of the cash flow positive as well as negative in a project is greater than the cost
of making the first place. As the result, the project will return success to meet
investors’s expectations and will increase the project value.
Function:
Copyright 2021 GMP Press and Printing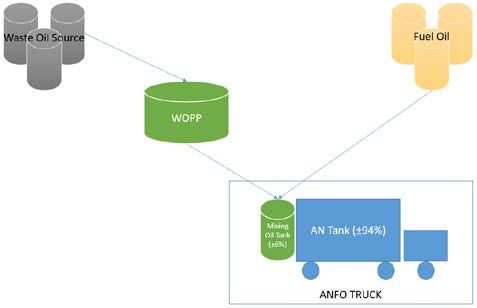
Review of Integrative Business and Economics Research, Vol. 10, Supplementary Issue 1 260
NPV is employed to conclude accept-reject decisions with criteria as follows:
- If the NPV is less than $0, reject the project
- If the NPV is greater than $0, accept the project (Gitman, 2009: 430)
Strengths:
- Cash flows assumed to be reinvested at the hurdle rate
- Account for time value of money - Considers all cash flows
Weaknesses:
- May not include managerial options embedded in the project
The formula:
NPV = Present value of cash inflows – Initial Investment (CFo)
Equation 2.1. Net Present Value (NPV)
• Internal Rate of Return (IRR)
Definition:
Internal Rate of Return (IRR) is the discount rate that equates the NPV of an
investment opportunity with $0; it is the rate of return that the firm will earn if it
invests in the project and receives the given cash flows. (Gitman and Zutter, 2012).
Function:
To determine the compound annual rate of return that the firm will earn if they
investing in projects and receives a given cash inflow.
Strengths:
- Account for time value of money - Considers all cash flows - Less subjectivity
- Weaknesses:
- Assumes all cash flows are reinvested at the Internal Rate of Return (IRR)
- Difficulties with project ranking and multiple IRRs
Formula:
Copyright 2021 GMP Press and Printing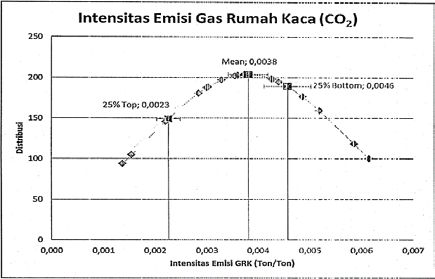
Review of Integrative Business and Economics Research, Vol. 10, Supplementary Issue 1 261
Equation 2.2. Internal Rate of Return (IRR)
• Pay Back Period (PBP)
Definition:
Payback period is the amount of time required for a firm to recover its initial
investment in a project, as calculated from cash inflows (Gitman and Zutter, 2012:
393)
Function:
Payback period is factored in to make accept-reject decision based on the following
criteria:
- If the PBP is shorter than the maximum acceptable payback period, accept the
project
- If the PBP is longer than maximum acceptable payback period, decline the project
(Gitman, 2009; 425)
Strengths:
- Easy to use and understand - Can be used as a measure of liquidity
Weaknesses:
- Does not account for time value of money - Does not consider cash flows beyond
the payback period (PBP) - Cutoff period is subjective
Formula:
Equation 2.3. Pay Back Period (PBP)
• Weighted Average Cost of Capital
WACC according to Gitman and Zutter (2012: 368)
“…reflects the expected average future cost of capital over the long run; found by
weighting the cost of each specific type of capital by its proportion in the firm’s capital
structure”
Copyright 2021 GMP Press and PrintingReview of Integrative Business and Economics Research, Vol. 10, Supplementary Issue 1 262
Equation 2.4. Weighted Average Cost of Capital (WACC)
Where,
• Capital Asset Pricing Model (CAPM)
Capital Asset Pricing Model is “the basic theory that links risk and return for all
assets” (Gitman and Zutter, 2012:329)
Marking the birth of asset pricing theory, William Sharpe (1964) and John Lintner
(1965) state the Capital Asset Pricing Model (CAPM) in the following equation:
(Fama and French: 2004: 25-46)
(Sharpe-Lintner CAPM)
Equation 2.5. Capital Asset Pricing Model (CAPM)
Using the definition from Gitman and Zutter in “Principle of Managerial Finance”
13th edition, the components are as follows:
Where,
According to Sheridan, et all. (2011: 468), the advantages and disadvantages of
CAPM are as follows:
The advantages of CAPM:
Copyright 2021 GMP Press and PrintingReview of Integrative Business and Economics Research, Vol. 10, Supplementary Issue 1 263
The model is simple and easy to understand and calculate since it is simply the sum
of two components: the risk-free rate of interest and the firm’s risk premium
Because the model does not rely on dividends or any assumption about the growth
rate in dividends, it can be applied to companies that do not currently pay dividends
or are not expected to experience a constant rate of growh in dividends
The disadvantages of CAPM:
- Specifying the risk-free rate
- Estimating beta
- Estimating the market’s risk premium
• Hurdle Rate
Hurdle rates are, like value, inherently subjective and thus are based on estimates (Jr.,
et al., 2015). The model that is usually used in estimating the hurdle rate is the capital
asset pricing model. The CAPM model is built on two core variables: a risk-free rate
(nominal return on a security that has absolutely no possibility of default) and a risk
premium (a function of the expected market return minus the risk-free rate and
multiplier risk, which is based on the covariance of a firm's securities' prices to those
of the broader capital market and is popularly known as beta). However, the use of
this beta value creates a lot of controversy compared to other variables. Responding
to this controversy, several companies used multi-factor models of arbitration pricing
(APT; Ross, 1980). Whatever approach is chosen, at least a model is available to
inform the hurdle rate estimate at the enterprise level in contrast to the situation that
exists at the business unit level. there are also some companies that determine the
hurdle rate at a certain level without being based on any model / analysis. Some
companies determine the hurdle rate according to the expected value. This kind of
determination has the potential to become a problem considering that determining the
hurdle rate value is related to business risk.
2.3. Hazardous and Toxic Waste Regulation
Regulation of the Director General of Pollution and Environmental Damage Control
NO.P.21 / PPKL / SET / KUM.I / 10/2018 about benchmarking of the coal mining
industry sector regulates the benchmarking of green assessment of company performance
ratings in environmental management of the coal mining industry sector. The purpose of
this regulation is to provide a reference for Proper participants in the coal mining industry
sector in carrying out benchmarking and provide a reference for Proper appraisers in
evaluating performance beyond compliance.
Benchmarking regulated in this regulation consists of:
- Benchmarking of emission intensity (Figure 2.2);
- Benchmarking of energy intensity (Figure 2.2);
- Benchmarking of water intensity;
- Benchmarking of hazardous and toxic waste intensity; and
- Benchmarking of non-hazardous and toxic waste intensity.
Copyright 2021 GMP Press and PrintingReview of Integrative Business and Economics Research, Vol. 10, Supplementary Issue 1 264
Figure 2.2. Benchmarking of Emission and energy Intensity
2.4. What is Carbon Pricing
Excerpted from www.worldbank.org/en/programs/pricing-carbon, there are several ways
governments can price carbon, all of which lead to the same results. Carbon pricing helps
transfer the burden of damage to those who are responsible and / or those who have the
capacity to reduce it. Instead of dictating who should reduce emissions where and how,
the carbon price signals the economy and polluters decide for themselves whether to stop
their polluting activities, reduce emissions, or continue polluting and pay for it. In this
way, the overall environmental goal is achieved in the most flexible and least costly way
for society. Carbon Pricing also encourages clean technology and market innovation,
driving new drivers of low-carbon economic growth. There are two main types of carbon
pricing: emissions trading systems (ETS) and carbon taxes.
ETS - sometimes referred to as a cap-and-trade system - limits the total level of
greenhouse gas emissions and allows low-emission industries to sell their extra benefits
to larger emitters. By creating a supply and demand for emissions allowances, ETS sets
a market price for greenhouse gas emissions. The cap helps ensure that the necessary
emission reductions are made to keep issuers (in aggregate) within their previously
allocated carbon budgets.
Carbon taxes directly set the price of carbon by setting tax rates for greenhouse gas
emissions or - more generally - the carbon content of fossil fuels. This differs from ETS
where the result of reducing emissions from the carbon tax is not predetermined but the
carbon price is determined.
The choice of instrument will depend on national and economic circumstances. There are
also more indirect ways to set a more accurate price for carbon, such as through fuel taxes,
the elimination of fossil fuel subsidies, and regulations that may include a “social cost of
carbon”. Greenhouse gas emissions can also be priced through payments for emission
reductions. Private or regulatory entities can purchase emission reductions to compensate
for their own emissions (called offsets) or to support mitigation activities through results-
based financing.
Copyright 2021 GMP Press and PrintingReview of Integrative Business and Economics Research, Vol. 10, Supplementary Issue 1 265
3. METHOD, DATA, AND ANALYSIS
3.1. Conceptual Framework
The research analyzes the loss opportunity that occurs in this project and performs a
projected opportunity that can be optimized in terms of environmental impact and cost
efficiency. Business situation analysis is a combination of management expectations,
literature review on the concept of environmental governance and specific cost
efficiencies related to the use of hazardous waste cost efficiency, and external-internal
analysis of the company using the TOWS matrix.
The research was divided into 3 scenarios, namely improvement waste oil utilization
portion 100%, improvement waste oil utilization portion 50-100%, and improvement
waste oil utilization with existing performance. The three project scenarios above were
analyzed for impacts on cost efficiency and environmental impact. The results of the
analysis are used as a basis for providing recommendations and implementation strategies
for management to be able to optimize the use of waste oil as a mixing of explosives in
mining activities so that the impact on environmental impacts and cost efficiency can be
optimized. Overview of the framework conceptual flow as in Figure 3.1.
3.2.Research Design
The research design divides the research into 2 time frames, namely initial improvement
(2015-2020) and improvement optimizing (2021-2025). In this research design section,
the analysis used basically uses the same methods and approaches from both financial
and environmental aspects. In the initial improvement, the impact obtained was calculated
through the financial capital budgeting approach and decreased energy and emission
consumption intensity. Likewise for improvement optimizing, what is different in this
part of the analysis is that it is complemented by the conversion of carbon emission values
into currency through the carbon pricing concept approach to provide a more familiar
overview. Overview of the research design flow as in Figure 3.2.
3.3.Environmental Impact Projection
The research uses primary and secondary data. Primary data is acquired from PT Berau
Coal combined with data obtained from observations during the project trial process.
Secondary data was collected from books, journals, articles, and websites. Both primary
and secondary data consist of quantitative and qualitative information. Primary and
secondary data are used as the input of financial and environmental analysis to produce
cost and environmental impact, and proposed optimum waste oil utilization scenario.
Copyright 2021 GMP Press and PrintingReview of Integrative Business and Economics Research, Vol. 10, Supplementary Issue 1 266
Figure 3.1. Conceptual Framework of Waste Oil Utilization
Copyright 2021 GMP Press and PrintingReview of Integrative Business and Economics Research, Vol. 10, Supplementary Issue 1 267
Figure 3.2. Research Design of Waste Oil Utilization
3.4.Loss Opportunity Cost and Environmental Impact in 2015 – 2020
As explained in subchapter 1.2. Problem Statement, related to the gap of the realization
of the use of waste oil as a mixing of explosive fuel (fuel oil substitution) against permits
that have been issued. This can be seen as missing an opportunity to have an optimal
impact on the environment and cost efficiency.
In 2015, it was the investment period for the construction of a waste oil processing plant
and its licensing. 2016 saw a period of trial and gradual implementation of waste oil
utilization with a composition according to the permit. In Figure 3.3 It can be seen that
there is still a gap between the implementation of waste oil utilization and capacity, in
this case the permit and the capacity of the waste oil plant. Detail waste oil management
balance pt berau coal (2016-2025) can be seen on Appendix 1.
Copyright 2021 GMP Press and PrintingReview of Integrative Business and Economics Research, Vol. 10, Supplementary Issue 1 268
Waste Oil Composition in Explosive
Waste Oil Compotition 70%
60%
50%
40%
30%
20%
10%
0%
2016 2017 2018 2019
Years
WO Compotition Actual WO Composition Capacity
Figure 3.3. Gap Waste Oil Utilization in Explosive
The existing gap is further analyzed to the loss of opportunity cost efficiency from fuel
savings and optimization of energy consumption reduction and emission reduction. In
Figure 3.4, Seen from the financial aspect, PT Berau Coal has lost the opportunity cost
efficiency of IDR 4,855.46 Mio (WACC-CAPM, 11.8%) or IDR 4,899.12 Mio (WACC
– Hurdle rate, 11.5%) during the period 2015 - 2020 (based on actual income and
expenditure data, except in 2020, an outlook is made of year-end achievements).
- 2.00
Capacity Actual
(2,000.00) 1.80
1.60
(4,000.00) - NPV (M IDR)
1.40
(6,000.00) - NPV (M IDR) HR
NPV, M IDR
1.20
- PBP in Years
(8,000.00) 1.00
- IRR
(10,000.00) 0.80
- PBP in Years HR
0.60
(12,000.00) - IRR HR
0.40
(14,000.00) 0.20
(16,000.00) -
Figure 3.4. Capital Budget Comparison Waste Oil Utilization 2015-2020
Viewed from the environmental aspect with reference to Regulation of the Director
General of Pollution and Environmental Damage Control NO.P.21 / PPKL / SET / KUM.I
/ 10/2018, lost opportunity for environmental impact can be seen in energy efficiency and
reduced emissions. Figure 3.5 shows the total value of energy intensity. The actual waste
oil utilization in the 2015-2020 period shows a total energy intensity of 0.02111941 GJ /
Ton with a contribution to a decrease in energy consumption from the actual waste oil
utilization of 199,986.16 GJ throughout the 2015-2020 period. Meanwhile, the capacity
Copyright 2021 GMP Press and PrintingReview of Integrative Business and Economics Research, Vol. 10, Supplementary Issue 1 269
for waste oil utilization in accordance with the permit and capacity of the waste oil
processing plant available in the same year period shows a lower total energy intensity
value at 0.02110288 GJ / Ton with a greater contribution of decreasing energy
consumption by 279,285.37 GJ. If the decrease in actual energy waste oil utilization is
compared to the waste oil utilization capacity in accordance with the permit and the
available waste oil processing plant capacity, there is still a gap of 79,299.21 GJ. This gap
can be defined as the loss of opportunity for companies to reduce energy consumption.
The same is the case with lost opportunities for a reduction in greenhouse gas emissions
(in this study it is limited only to CO2 gas according to the reference regulation). The loss
of this opportunity is 981.19 tons CO2eq.
Total Energy Intensity Green House Gas Emission Intensity (CO2)
Distribution
Distribution
Total Energy Intensity (GJ/Ton) GHG Emission Intensity (Ton/Ton)
0.02110288 0.02111941 0.00279504 0.00279483
Optimizing WOPP Capacity to Existing Permit Waste Oil Utilization Actual Optimizing WOPP Capacity to Existing Permit Waste Oil Utilization Actual
Figure 3.5. Total Energy and GHG Emission Intensity PT Berau Coal 2015-2020
Based on the overall discussion in chapter 2 related to exploration business issues, it
provides an overview of the ways in which companies are dominated by aggregate forces
and threats. Diversification is a strategy that companies should take in order to survive
and continue to grow. The use of petroleum waste as the concept of blending explosives
is in line with efforts to diversify the mining process sub-business which can contribute
to increasing corporate value in terms of the environment and cost efficiency. This project
can be seen more broadly as the company's effort and commitment to implement a cost
leadership strategy with a focus on resource-based view which is expected to be an added
value for the company in increasing its capacity to compete with competitors. Through
this project improvement the company has a more optimal chance of impact where the
magnitude is calculated in the next chapter.
4. RESULT AND DISCUSSION
4.1. Defining Assumptions
In accordance with the analysis in the previous chapter, it can be concluded that:
Recommendation
These are the assumptions used in this Research (Figure 4.1). Initial Improvement impact
analysis most of the data use actual data. Improvement Optimizing: Capital expenditures,
improvement optimizing with existing permit use proforma data, in this scenario requires
additional investment for Waste Oil Receiver Storage and Waste Oil Feeder Storage
(increase capacity 200%). In improvement optimizing with new permit use proforma
Copyright 2021 GMP Press and PrintingReview of Integrative Business and Economics Research, Vol. 10, Supplementary Issue 1 270
data, in this scenario requires additional investment for Waste Oil Receiver Storage
(increase capacity 250%) and Waste Oil Feeder Storage (increase capacity 300%) and
Waste Oil Procession Plant Opti-ten (increase capacity 125%). Operating Expenditures,
in improvement optimizing consist of proforma data from history depend on production
target. What is the difference? The addition of manpower related to Optimizing Effective
Working Hour. Cost of Capital are doubled in each scenario based on the Weighted
average cost of capital by Capital asset Pricing Model in 11.8 percent and the Weighted
Average Cost of Capital by hurdle rate company in 11.5 percent. It was obtained from a
reduction in the use of fuel oil with reference to the forecast fuel price from Mids Oil
Platts of Singapore Price adjustment (detail in Appendix 2).
The assumptions used in measuring the environmental impact include improvement
optimizing, Additional contribution of reducing the energy consumption intensity and
GHG Emission Intensity from this project was calculated by study preview. Energy of
Fuel Oil: 44.5 MJ / kg (mechanical, 2017) waste oil: 35.9 MJ / kg (mettek, 2015). In GHG
Emission, Additional contribution from this project was calculated by study preview:
CO2 Emission of Fuel Oil: 3.3 ton / ton, waste oil: 3.1 ton / ton (KLH, 2012).
Figure 4.1. General Assumptions
4.2. Cost and Environmental Impact Projection
Optimizing the utilization of waste oil by increasing the capacity of the waste oil
processing plant (WOPP) by 250% through the construction of several new WOPP parts,
the effective utilization of WOPP working hours to 2 shifts, as well as proposals for
permit to use waste oil with a maximum composition of up to 100%. As shown in Figure
4.2, optimization through the above methods will have an impact on cost efficiency which
is equivalent to $ 1,188,403.28 (optimization NPV - existing NPV) during the period
2021-2025. The optimization NPV value is $ 2,086,995.64 with a payback period of less
than 1 year.
Copyright 2021 GMP Press and PrintingReview of Integrative Business and Economics Research, Vol. 10, Supplementary Issue 1 271
-
Improve in Operation and Improve in Operation Existing
(10,000.00) Permit
(20,000.00)
(15,508.25)
(15,566.53)
(30,000.00)
(27,396.69)
(27,504.43)
(37,874.25)
(38,049.63)
(40,000.00)
- NPV (M IDR) - NPV (M IDR) HR
Figure 4.2. NPV Comparison of Waste Oil Utilization Scenarios 2021-2025
Figure 4.3 shown the impact on reducing energy consumption is 0.62% of the total energy
intensity of PT Berau Coal during the period 2021-2025 or the equivalent of 365,280.77
GJ or equivalent to an increase in the contribution of reducing energy consumption by
200% compared to the utilization of existing waste oil. The impact on reducing
greenhouse gas emissions is 0.04% of the total intensity of PT Berau Coal's greenhouse
gas emissions during the 2021-2025 period or the equivalent of 4,519.69 tons of CO2eq
or equivalent to an increase in the contribution of reducing greenhouse gas emissions by
266% compared to the utilization of existing waste oil. Through the carbon pricing
approach (carbon tax), the emission reduction is equivalent to a NPV of $ 22,469.52.
Total Energy Intensity Green House Gas Emission Intensity (CO2)
Distribution
Distribution
Total Energy Intensity (GJ/Ton) GHG Emission Intensity (Ton/Ton)
0.01897745 0.01901338 0.01904926 0.002183501 0.002183946 0.00218439
Optimizing WOPP Capacity to New Permit Optimizing WOPP Capacity to Existing Permit Waste Oil Utilization Actual Optimizing WOPP Capacity to New Permit Optimizing WOPP Capacity to Existing Permit Waste Oil Utilization Actual
Figure 4.3. Total Energy and GHG Emission Intensity PT Berau Coal 2021-2025
From the graph, it can be seen that the gap between the scenarios is in accordance with
the analysis in the previous sub-chapter that the more optimal the utilization of waste oil,
the higher the financial and environmental impact. Improving the use of waste oil to 100%
composition as a blending explosives provides benefits (can be in the form of a tax shield,
tax reduction, or the like, according to the carbon tax system that will be implemented)
of IDR 629.80 Mio in the total period 2021-2025 or provides benefits 267% for efforts to
reduce carbon emissions compared to the existing scenario which was only able to
provide benefits of IDR 234.91 Mio. Meanwhile, the improvement in the use of waste oil
at a composition interval of 50-100% gives IDR 430.05 Mio in the same period or
Copyright 2021 GMP Press and PrintingReview of Integrative Business and Economics Research, Vol. 10, Supplementary Issue 1 272
provides a benefit of 183% for reducing carbon emissions compared to the existing
scenario (Figure 4.4).
Improve in Permit and Operation Improve in Operation Existing Performance
IDR -
2021 2022 2023 2024 2025
Cost Saving (M IDR)
IDR (50.00)
IDR (100.00)
IDR (150.00)
IDR (200.00)
Years
Figure 4.4. Monetization of Emission Reduction Benefits PT Berau Coal
Sensitivity analysis is carried out to determine the effect of changes in project parameters
on system performance in the project in generating profits. In Figure 4.5 it can be seen
that the composition of the use of waste oil as a substitute for fuel oil as a mixture of
explosives in blasting activities as part of mining operations at PT Berau Coal has the
highest sensitivity level to the NPV value. It can also be said that one of the effective
efforts to maximize the benefits obtained financially is to maximize the composition of
waste oil as an explosive mixer, because the higher the waste oil composition, the higher
the cost efficiency obtained from fuel efficiency. Apart from the composition of waste
oil, fuel price, blasting material portion, powder factor, production increase, and WACC
also have high sensitivity, but as we know that fuel price and WACC values are very
difficult to intervene directly.
In the spider type sensitivity analysis graph, the waste oil utilization composition factor
in each explosive and the change in production capacity shows a non-linear graph because
certain changes have implications for investment in changes in the capacity of the waste
oil processing plant. Based on the level of dynamics of change and its impact on this
project, fuel prices and changes in production are the most responsive factors, where
changes in production are basically the impact of the dynamics of coal prices on the world
market. Based on these two factors, scenario analysis is carried out at the fuel price value
interval and the realization of certain production to see the impact on the net present value
of this project. From the analysis, the value of fuel price and production realization when
the NPV is 0 is obtained
• Improvement in operation with a new permit (± 100% waste oil composition):
Actual production of 9% of the base scenario or fuel price of $ 0.08 / liter.
• Improvement in operation with an existing permit (± 50-100% waste oil
composition): Actual production of 7% of the base scenario or fuel price of $ 0.07
/ liter.
Copyright 2021 GMP Press and PrintingReview of Integrative Business and Economics Research, Vol. 10, Supplementary Issue 1 273
• Exisiting improvement (± 50% waste oil composition): Fuel price of $ 0.06 / liter.
NPV
Corresponding Input Value Output Value Percent
Input Variable Low Output Base Case High Output Low Base High Swing Swing^2
Waste Oil Utilization In Emulsion 100% 48% 0% (19,373.14) (18,703.89) (3,463.11) 15,910.04 65.7%
Fuel Price 0.50 0.42 0.33 (23,094.33) (18,703.89) (14,313.45) 8,780.88 20.0%
Blasting Material Portion 99% 82% 66% (18,596.84) (18,703.89) (15,016.61) 3,580.23 3.3%
Powder Factor 0.24 0.20 0.16 (18,596.84) (18,703.89) (15,016.61) 3,580.23 3.3%
Production Increase 145% 120% 96% (18,614.45) (18,703.89) (15,047.08) 3,567.37 3.3%
WACC 6% 12% 18% (20,219.39) (18,703.89) (17,434.51) 2,784.88 2.0%
Waste Oil Utilization in ANFO 100% 50% 0% (18,463.96) (18,703.89) (15,951.12) 2,512.84 1.6%
Gradient Ex. Rate USD/IDR 27.44 22.87 18.29 (19,422.29) (18,703.89) (17,980.00) 1,442.29 0.5%
Waste Oil Utilization in Gel 100% 50% 0% (19,034.63) (18,703.89) (18,261.02) 773.61 0.2%
Inflation Rate 2.60% 3.25% 3.90% (18,778.33) (18,703.89) (18,627.80) 150.53 0.0%
SensIt 1.45 Academic Version
Waste Oil Utilization In Emulsion 100% 0%
Fuel Price 0.50 0.33
Blasting Material Portion 99% 66%
Powder Factor 0.24 0.16
Production Increase 145% 96%
WACC 6% 18%
Waste Oil Utilization in ANFO 100% 0%
Gradient Ex. Rate USD/IDR 27.44 18.29
Waste Oil Utilization in Gel 100% 0%
Inflation Rate 2.60% 3.90%
(26,000.00) (24,000.00) (22,000.00) (20,000.00) (18,000.00) (16,000.00) (14,000.00) (12,000.00) (10,000.00) (8,000.00) (6,000.00) (4,000.00) (2,000.00) -
NPV
SensIt 1.45 Academic Version
-
(2,000.00)
(4,000.00)
(6,000.00)
Waste Oil Utilization In Emulsion
(8,000.00) Fuel Price
(10,000.00) Blasting Material Portion
(12,000.00) Powder Factor
NPV
(14,000.00) Production Increase
(16,000.00) WACC
(18,000.00) Waste Oil Utilization in ANFO
Gradient Ex. Rate USD/IDR
(20,000.00)
Waste Oil Utilization in Gel
(22,000.00)
Inflation Rate
(24,000.00)
(26,000.00)
-20.0% 0.0% 20.0% 40.0% 60.0% 80.0% 100.0% 120.0% 140.0% 160.0% 180.0% 200.0% 220.0% 240.0%
Input Value as % of Base Case
Figure 4.5. Sensitivity Analysis: Tornado and Spider Types
Furthermore, the cost and environmental impact of each improvement scenario is
summarized into a filled radar graph to represent the impact of waste oil utilization as a
whole in the context of cost efficiency and limited environmental impact on reducing
energy consumption and reducing greenhouse gas emissions (can be seen in Figure 4.6).
Copyright 2021 GMP Press and PrintingReview of Integrative Business and Economics Research, Vol. 10, Supplementary Issue 1 274
Figure 4.6. Cost and Environmental Impact Chart Filled Radar of Waste Oil Utilization
Scenarios
The graph above shows the integration of the cost and environmental impact of waste oil
utilization in each scenario. It is clear, that each improvement scenario has a positive
contribution to cost efficiency, reducing energy consumption and reducing greenhouse
gas emissions. However, improvement in operation with new permit ((± 100% waste oil
composition) provides the highest multiple impact by reinvesting efforts for Waste Oil
Receiver Storage (increase capacity 250%) and Waste Oil Feeder Storage (increase
capacity 300%) and WOPP Opti-10 (125% increase in capacity). This scenario can be
assessed as an improvement room owned by PT Berau Coal in optimizing waste oil
utilization as a blending explosives.
5. CONCLUSION
The results of data processing, for the initial improvement at 2015-2020 PT Berau Coal
has lost cost opportunity cost of IDR 4,855.46 Mio, has lost opportunity in reduce of total
consumption energy and GHG Emission of 79,299.21 GJ and 981.19 tons CO2eq.
Improvement Optimizing at 2021-2025 WO 50- 100% give impact: +176% NPV, reduce
energy and emission intensity 0.19% and 0.02% or IDR 398.43 Mio. Improvement
Optimizing at 2021-2025 WO 100% give impact: +244% NPV, reduce energy and
emission intensity 0.41% and 0.04% or IDR 579.36 Mio.
Through the approach to the concept of capital budgeting, benchmarking energy intensity
and emissions, and monetization of carbon values, the authors conclude that optimizing
the use of waste oil with 100% composition as a substitute for fuel oil as a blending agent
for blasting activities in the mining activities of PT Berau Coal has an optimal impact on
cost efficiency and benefits to the environment in terms of energy efficiency and emission
reduction.
Copyright 2021 GMP Press and PrintingReview of Integrative Business and Economics Research, Vol. 10, Supplementary Issue 1 275
6. IMPLICATION/LIMITATION AND SUGGESTIONS
In this research, the authors limit the research for case analysis at PT Berau Coal, due to
the limited data available and the time available. This research is relatively sufficient to
provide an overview regarding the feasibility study of the waste oil utilization as a
substitute for fuel oil as a mixing agent for explosives in blasting activities in the mining
process. For further research, the authors suggest that research can be carried out more
broadly so that this project can be implemented in other mining companies. In addition,
the concept of monetizing the value of carbon emissions in this research is still limited to
the conversion of emission values into currency and has not become part of the integrated
financial concept. For further research, the authors suggest that research can integrate the
concept of monetization of the value of carbon emissions with the overall financial
feasibility study, both through the Emission Trading System and Carbon Tax approaches.
Copyright 2021 GMP Press and PrintingReview of Integrative Business and Economics Research, Vol. 10, Supplementary Issue 1 276
APPENDICES
Appendix 1. Waste Oil Management Balance PT Berau Coal (2016-2025)
WASTE MANAGED
Years
Type of Waste Waste Code SOURCE UNIT TREATMENT Scenarios PRODUCED STORED AT UTILIZED LANDFILL SUBMITTED THIRD NOT MANAGED
BEING OWN
2016 2017 2018 2019 2020 2021 2022 2023 2024 2025 TPS ITSELF ITSELF PARTY LICENSED
PRODUCED 4,008.07 3,889.30 4,647.00 5,472.90 5,109.44 7,540.69 8,229.60 7,931.43 5,950.49 1,227.98 54,006.89
STORED AT TPS 61.27 50.00 134.90 62.30 78.11 115.28 125.81 121.25 90.97 18.77 858.66
Existing 282.97 940.44 1,357.27 1,036.52 938.04 1,231.14 1,305.52 1,306.63 981.95 186.22 9,566.71
UTILIZED ITSELF Improve in Operation 503.37 1,285.52 1,541.09 1,528.44 1,503.09 2,244.90 2,378.27 2,328.69 1,858.42 357.96 15,529.74
Improve in Permit and
503.37 1,285.52 1,541.09 1,528.44 1,503.09 2,244.90 3,825.99 3,767.70 2,930.53 562.62 19,693.25
Operation
ALL SITES
FROM BEING OWN - - - - - - - - - - -
Used Lubricant B105d TON
COMBINED
ACTIVITIES LANDFILL ITSELF - - - - - - - - - - -
Existing 3,663.83 2,898.86 3,154.83 4,374.08 4,093.30 6,194.26 6,798.26 6,503.55 4,877.57 1,022.99 43,581.53
SUBMITTED THIRD
Improve in Operation 3,443.43 2,553.78 2,971.01 3,882.16 3,528.24 5,180.50 5,725.52 5,481.48 4,001.10 851.25 37,618.49
PARTY LICENSED
Improve in Permit and
3,443.43 2,553.78 2,971.01 3,882.16 3,528.24 5,180.50 4,277.79 4,042.48 2,928.99 646.59 33,454.99
Operation
NOT MANAGED - - - - - - - - - - -
54,006.89 858.66 9,566.71 - - 43,581.53 -
TOTAL WASTE OF HAZARDOUS AND TOXIC MATERIALS - SCENARIO EXISTING 1.59% 17.71% 0.00% 0.00% 80.70% 0.00%
100.00% 0.00%
54,006.89 858.66 15,529.74 - - 37,618.49 -
TOTAL WASTE OF HAZARDOUS AND TOXIC MATERIALS - SCENARIO IMPROVE IN OPERATION 1.59% 28.76% 0.00% 0.00% 69.65% 0.00%
100.00% 0.00%
54,006.89 858.66 19,693.25 - - 33,454.99 -
TOTAL WASTE OF HAZARDOUS AND TOXIC MATERIALS - SCENARIO IMPROVE IN PERMIT AND OPERATION 1.59% 36.46% 0.00% 0.00% 61.95% 0.00%
100.00% 0.00%
Copyright 2021 GMP Press and PrintingReview of Integrative Business and Economics Research, Vol. 10, Supplementary Issue 1 277
Appendix 2. Average Fuel Price Forecast
Copyright 2021 GMP Press and PrintingReview of Integrative Business and Economics Research, Vol. 10, Supplementary Issue 1 278
Appendix 3. ANFO and Emulsion Mixing Process
Copyright 2021 GMP Press and PrintingReview of Integrative Business and Economics Research, Vol. 10, Supplementary Issue 1 279
ACKNOWLEDGEMENTS
The author would like to express a greatest gratitude to Allah SubahanaHu wa Ta’ala for
HIS Grace and blessing in a lot of forms so that keep give strength and good spirit the
author to finish the research as part of learning process in Master of Business
Administration at Bandung Institute of Technology. Allah sent a lot of parties who have
helped this research to its completion where it is not appropriate for me if I do not say
thank you so much to them.
REFERENCES
[1] Anon., 2020. Singapore Gasoil (Platts) Futures Quotes. [Online]
Available at: https://www.cmegroup.com/trading/energy/refined-
products/singapore-gasoil-swap-futures.html
[2] Badan Pusat Statsistik, 2020. Tingkat Inflasi Tahun ke Tahun Gabungan 90 Kota 1
(2018=100). [Online]
Available at: https://www.bps.go.id/statictable/2014/09/26/915/tingkat-inflasi-
tahun-ke-tahun-gabungan-90-kota-sup-1-sup-2018-100-.html
[3] Berau Coal, 2020. PT Berau Coal. [Online]
Available at: http://www.beraucoalenergy.co.id/our-profile
[4] Carbon, P., 2014. Pricing Carbon. [Online]
Available at: https://www.worldbank.org/en/programs/pricing-
carbon#CarbonPricing
[5] Damodaran, A., 2020. Beta, Unlevered beta and other risk measures Emerging
Markets. [Online]
Available at: http://www.stern.nyu.edu/~adamodar/New_Home_Page/data.html
[6] Daniel, A. V. & Trevor, M. L., 2019. Waste - A Handbook for Management - 2nd
Edition. London: Lond Wall.
[7] Dunne, D., 2019. Profil Carbon Brief: Indonesia. [Online]
Available at: https://www.carbonbrief.org/profil-carbon-brief-indonesia
[8] Evans, S. & Rosamun, P., 2016. Mapped: The global coal trade. [Online]
Available at: https://www.carbonbrief.org/mapped-the-global-coal-trade
[9] Gitman, L. J. & Zutter, C. J., 2012. Managerial Finance 13th edition. Boston, MA:
Prentice Hall.
[10] Gitman, L. J. & Zutter, C. J., 2015. Principles of Managerial Finance. Kendallville:
Pearson Education.
Copyright 2021 GMP Press and PrintingReview of Integrative Business and Economics Research, Vol. 10, Supplementary Issue 1 280
[11] Greene, W., 1997. Frontier production functions. In: M. Pesaran & P. Schmidt, eds.
Handbook of Applied Econometrics.. vol. II ed. s.l.:Microeconometrics. Blackwell
Publishers Ltd..
[12] Hindarto, D., 2019. Unveiling the Potential of Carbon Tax Implementation in
Indonesia. Joint Crediting Mechanism Indonesia.
[13] Hoskisson, R. &. H. M. &. I. R. &. H. J., 2012. Competing for Advantage Third
Edition.. South-Western: Cengage Learning.
[14] IBPA, 2020. Indonesia Bond Pricing Agency. [Online]
Available at: http://ibpa.co.id/
[15] Jr., J. C., Gates, D., Madampath, A. & Ramette, F., 2015. A Practical Approach to
Business Unit Hurdle Rates, Portofolio Analysis and Strategic Planning. ACRN
Journal of Finance and Risk Perspectives, pp. Vol. 4, Issue 2, March 2015, p. 63-
78.
[16] Kementerian ESDM Republik Indonesia, 2018. Kementerian ESDM. [Online]
Available at: https://www.esdm.go.id/id/media-center/arsip-berita/rekonsiliasi-data-
sumber-daya-batubara-indonesia-kini-166-miliar-ton-cadangan-37-miliar-ton
[Accessed 9 February 2019].
[17] Kepner, C. H. & Trego, B. B., 1973. Problem Analysis and Decision Making.. New
Jersey: Kepner-Tregoe, Inc,..
[18] Kiel Institute of The World Economy, 2019. Kiel Institute of The World Economy
Media Information. [Online]
Available at: https://www.ifw-kiel.de/publications/media-
information/2019/germany-earns-less-on-its-foreign-investments-than-other-
countries/
[Accessed 27 February 2019].
[19] Koopmans, T., 1951. Analysis of production as an efficient combination of
activities. In: T. Koopmans, ed. Activity Analysis of Production and Allocation.
New York: John Wiley & Sons, pp. 33-37.
[20] Margenta, I. D. M. R., 2020. The Opinion - Carbon Tax Implementasi in Indoensia.
[Online]
Available at: https://www.purnomoyusgiantorocenter.org/carbon-tax-
implementation-in-indonesia/
[21] Miller, F. M. & Merton, H., 1958. The Cost of Capital, Corporate Finance and
Theory of Investment. The American Economic Review, Vol. 48, No. 3, p. 261297.
Copyright 2021 GMP Press and PrintingReview of Integrative Business and Economics Research, Vol. 10, Supplementary Issue 1 281
[22] ppid.menlhk, 2020. Siaran Pers - Berhasil Tekan Deforestasi, Indonesia Terima
Dana dari Norwegia. [Online]
Available at:
http://ppid.menlhk.go.id/siaran_pers/browse/2481#:~:text=Adapun%20harga%20pe
r%20ton%20CO2eq,tahun%202017%2F2018%20dan%20seterusnya.
[23] PT Berau Coal, 2014. Annual Report 2014, Jakarta: PT Berau Coal Energy Tbk..
[24] Rudskaia, I. & Rodionov, D., 2017. Construction of Efficiency Indicators for
Innovative Activity in Russia’s Regions. Integrative Business and Economics
Research, VII(1), pp. 30-32.
[25] Ruhe, T. C. & Bajpayee, T. S., 1999. Thermal stability of ANFO made with
recycled oil. [Online]
Available at: http://www.cdc.gov/niosh/mining/UserF iles/works/pdfs/anfo.pdf
[26] Setiyono, 2001. Dasar hukum pengelolaan limbah B3., Vol.2, No. 1, P 72-77..
Jurnal Teknologi Lingkungan Vol.2, No. 1, pp. 72-77.
[27] SNI 7642:2010, 2010. SNI 7642:2010, Jakarta: BSNI.
[28] S., Pambudi, S. H., Lastiko, J. & Pratiwi, N. I., 2019. Indonesia Energy Outlook
2019, Jakarta: Secretariat General National Energy Council.
[29] Thomas, A., Eyitayo, I. & Oluwaseun, O., 2015. Design and fabrication ANFO
mixing machine for safety and proper homogenization. Innovative Systems Design
and Engineering Journal, pp. Vol.6, No.5.
[30] Wijaya, D., 2020. INTRODUCTION OF PESTLE ANALYSIS. [Online]
Available at: https://sis.binus.ac.id/2016/07/29/introduction-of-pestle-analysis/
[31] World Bank Group, 2019. State and Trends of Carbon Pricing 2019, Washington
DC: World Bank.
[32] Yahoo Finance, 2020. Jakarta Composite Index (^JKSE). [Online]
Available at: https://finance.yahoo.com/quote/%5EJKSE/history/
[33] Yahoo Finance, 2020. PT Adaro Energy Tbk (ADRO.JK). [Online]
Available at: https://finance.yahoo.com/quote/ADRO.JK/history?p=ADRO.JK
[34] Yahoo Finance, 2020. PT Bukit Asam Tbk (PTBA.JK). [Online]
Available at: https://finance.yahoo.com/quote/PTBA.JK/history?p=PTBA.JK
[35] Yahoo Finance, 2020. PT Indo Tambangraya Megah Tbk (ITMG.JK). [Online]
Available at: https://finance.yahoo.com/quote/ITMG.JK/history?p=ITMG.JK
Copyright 2021 GMP Press and PrintingReview of Integrative Business and Economics Research, Vol. 10, Supplementary Issue 1 282
[36] Yahoo Finance, 2020. PT. Indika Energy Tbk (INDY.JK). [Online]
Available at: https://finance.yahoo.com/quote/INDY.JK/history?p=INDY.JK
[37] Yahoo Finance, 2020. USD/IDR (IDR=X). [Online]
Available at:
https://finance.yahoo.com/quote/IDR%3DX/history?period1=1421280000&period2
=1596153600&interval=1mo&filter=history&frequency=1mo
[38] Zulkifli, A., 2014. Pengelolaan tambang berkelanjutan. Yogyakarta: Graha ilmu.
Copyright 2021 GMP Press and PrintingYou can also read