Climate warming projections for Algonquin Provincial Park - Science and Research Information Report IR-14
←
→
Page content transcription
If your browser does not render page correctly, please read the page content below
Science and Research Information Report IR-14

Climate warming projections for
Algonquin Provincial Park
Science and Research Information Report IR-14

Climate warming projections for Algonquin
 Provincial Park

Mark Ridgway, Darren Smith, and Trevor Middel
Harkness Laboratory of Fisheries Research, Aquatic Research and Monitoring Section,
Ontario Ministry of Natural Resources and Forestry

2018

                           Science and Research Branch

                     Ministry of Natural Resources and Forestry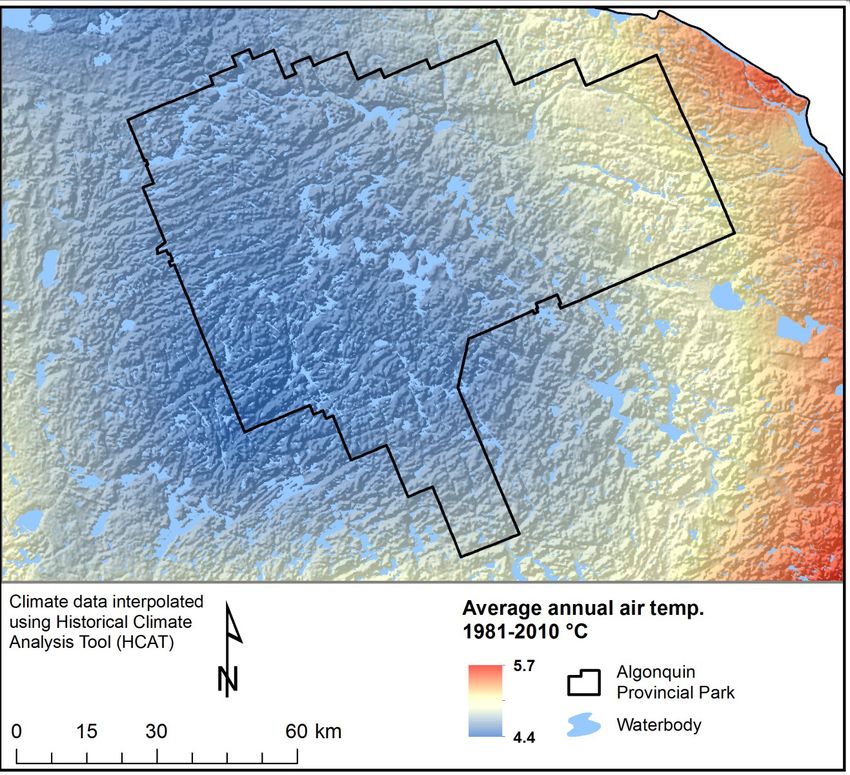
© 2018, Queen’s Printer for Ontario

Copies of this publication are available from info.mnrfscience@ontario.ca.

Cette publication hautement spécialisée, Climate Warming Projections for Algonquin
Provincial Park, n’est disponible qu’en anglais conformément au Règlement 671/92,
selon lequel il n’est pas obligatoire de la traduire en vertu de la Loi sur les services en
français. Pour obtenir des renseignements en français, veuillez communiquer avec le
ministère des Richesses naturelles et des Forêts au info.mnrfscience@ontario.ca.

Cover photo: Looking west from Opeongo Lookout. Costello Creek is flowing from left to
right towards Lake Opeongo. Photo by Luke Ridgway; taken January 1, 2018.

Some of the information in this document may not be compatible with assistive
technologies. If you need any of the information in an alternate format, please contact
info.mnrfscience@ontario.ca.

Cite this report as:

       Ridgway, M., D. Smith and T. Middel. 2018. Climate warming projections for
       Algonquin Provincial Park. Ontario Ministry of Natural Resources and Forestry,
       Science and Research Branch, Peterborough, ON. Science and Research
       Information Report IR-14. 23 p. + append.

Science and Research Information Report IR-14                                                 ii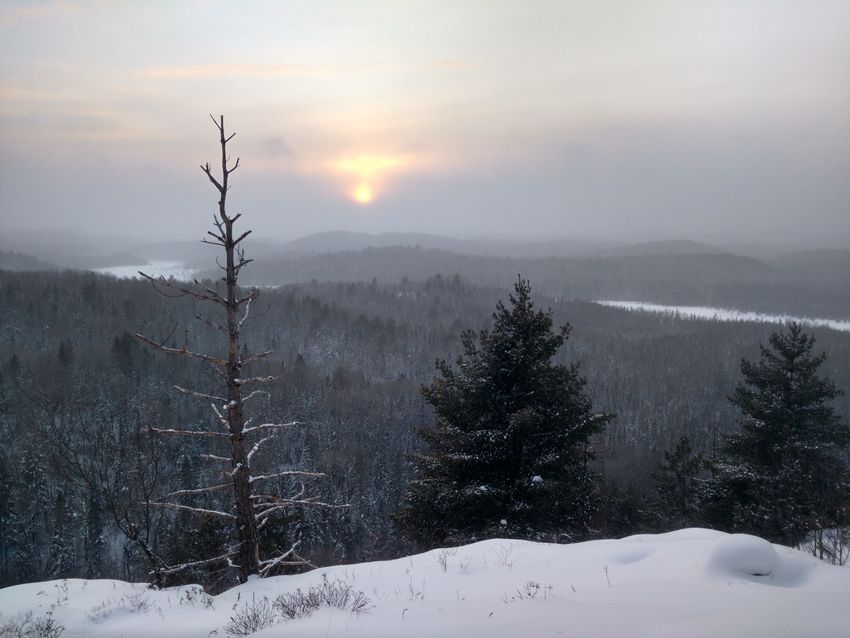
Summary

We summarize climate warming projections for Algonquin Provincial Park based on
scenarios presented in the 2014 United Nations International Panel on Climate Change
(IPCC).

Changes in climate are already affecting Algonquin Provincial Park. Earlier ice-out dates
on lakes and general warming of the landscape around the park over the past century
provide local evidence for climate change. Temperature trends from centres near the
park — Haliburton, Madawaska, and North Bay, Ontario, Canada — reflect the global
pattern of a 1 °C increase in average temperature by 2016. Continuing increases in
global levels of greenhouse gases, such as is shown for carbon dioxide in the Keeling
Curve, point to this warming continuing for years to come.

To evaluate future climate change in the park, an ensemble of climate models was used
to examine potential outcomes of two scenarios. One scenario is based on reduced
concentrations of greenhouse gases by mid-21st century (RCP4.5) and another is based
on increases similar to those observed today continuing (RCP8.5).

Warming occurs under both projections. If greenhouse gases are reduced by mid-
century, for both scenarios average air temperature in the park will range from 6.5 to 8
°C for the balance of the 21st century. In contrast, continued increases in greenhouse
gases as observed today will push average air temperature in the park to between 9
and 10 °C by 2071–2100. Current average air temperature in the park is 4 to 5 °C. No
realistic climate warming scenario indicated that the park will retain the average air
temperature observed today.

To put the projected temperature changes in context, the scenario of reduced
greenhouse gases by mid-century will result in average air temperature in the park
equivalent to today’s Peterborough, Ontario. Continued increases in greenhouse gases
will result in average air temperature in the park equivalent to today’s Leamington –
Windsor, Ontario. The general effects of climate warming on fish and freshwater
ecosystems are summarized with emphasis on Algonquin Provincial Park.

Science and Research Information Report IR-14                                              iii
Résumé

Projections du réchauffement climatique pour le parc provincial Algonquin

Nous résumons ici les projections du réchauffement climatique pour le parc provincial
Algonquin sur la base de scénarios présentés en 2014 au Groupe d’experts
intergouvernemental sur l’évolution du climat (GIEC) des Nations Unies.

Le changement climatique affecte déjà le parc provincial Algonquin. Les dates du
déglacement des lacs et le réchauffement général du paysage entourant le parc au cours
du dernier siècle témoignent du changement climatique. L’évolution de la température dans
des centres proches du parc – Haliburton, Madawaska et North Bay, en Ontario – reflète la
hausse de 1°C à l’échelle mondiale en 2016. La poursuite de l’augmentation des niveaux
mondiaux de gaz à effet de serre, comme le montre la courbe de Keeling pour le dioxyde
de carbone, donne à penser que ce réchauffement se poursuivra au cours des années à
venir.

Pour évaluer le changement climatique futur dans le parc, un ensemble de modèles
climatiques a été utilisé pour examiner les résultats potentiels de deux scénarios. Un
scénario se fonde sur la réduction des concentrations de gaz à effet de serre au milieu du
XXIe siècle (RCP4.5), et un autre se fonde sur la poursuite de hausses semblables à celles
que l’on observe aujourd’hui (RCP8.5).

Il y a deux hypothèses de réchauffement. Si les gaz à effet de serre sont réduits au milieu
du siècle, pour les deux scénarios la température de l’air moyenne dans le parc sera de 6,5
à 8°C pour le reste du XXIe siècle. Mais si la hausse se poursuit comme aujourd’hui, la
température de l’air moyenne dans le parc sera de 9 à 10°C de 2071 à 2100. La
température de l’air moyenne actuelle dans le parc est de 4 à 5°C. Aucun scénario de
réchauffement climatique réaliste ne prévoit que le parc conservera la température de l’air
moyenne observée aujourd’hui.

Pour contextualiser les changements de température projetés, le scénario de réduction des
gaz à effet de serre au milieu du siècle donnerait une température de l’air moyenne dans le
parc semblable à celle d’aujourd’hui à Peterborough (Ontario). La poursuite de
l’augmentation des gaz à effet de serre donnerait une température de l’air moyenne dans le
parc équivalente à celle d’aujourd’hui à Leamington, près de Windsor (Ontario). Les effets
généraux du réchauffement climatique sur les poissons et les écosystèmes d’eau douce
sont résumés ici, tout particulièrement concernant le parc provincial Algonquin.

Acknowledgements
We thank Lisa Buse for her editorial work to improve the clarity of the report.

Science and Research Information Report IR-14                                             iv
Contents
          Summary ........................................................................................................ iii
          Résumé .......................................................................................................... iv
          Acknowledgements ......................................................................................... iv
     Introduction ...........................................................................................................1
     The Keeling Curve ................................................................................................3
     Evidence for climate change in Algonquin Park ....................................................4
     Temperature baseline for Algonquin Park .............................................................6
     The ensemble model approach .............................................................................7
     Climate warming projection scenarios ...................................................................9
     Patterns of climate warming projected for Algonquin Park ..................................11
     Climate warming and freshwater ecosystems .....................................................18
     Conclusion ..........................................................................................................20
     References ..........................................................................................................21
     Appendix 1. The climate models .........................................................................24

Science and Research Information Report IR-14                                                                                    v
Science and Research Information Report IR-14 vi
Introduction

The scientific consensus on climate change, as expressed in the United Nations’
International Panel on Climate Change (IPCC), is that Earth’s climate has been
warming for several decades, slowly at first but now with increasing pace, due to human
produced carbon emissions. The latest IPCC summary (2014a; pg. 40) states:

     “Warming of the climate system is unequivocal, and since the 1950s, many of
     the observed changes are unprecedented over decades to millennia. The
     atmosphere and ocean have warmed, the amounts of snow and ice have
     diminished, and sea level has risen.”

     “Human influence on the climate system is clear, and recent anthropogenic
     emissions of greenhouse gases are the highest in history. Recent climate
     changes have had widespread impacts on human and natural systems.”

Based on NASA’s global land-ocean temperature index (NASA 2018), 16 of the 17
warmest years on record have occurred since 2001. The year 2016 was 0.99 °C
warmer relative to the average land-ocean temperature index covering the period 1951–
1980. Unless emissions of greenhouse gases such as carbon dioxide (CO2) are
reduced, warming will continue, with projected increases in global temperature of
approximately 1.5 to 5.5 °C for the balance of the 21st century (IPCC 2014a). Reducing
and mitigating carbon emissions will slow the pace of warming and potentially avert
serious human and ecological consequences.

Past climate analyses for Ontario’s parks pointed to increased warming and
precipitation for Algonquin Provincial Park (Lemieux et al. 2007). Temperatures in the
park were projected to increase by 0.7 to 3.4 °C in the 2020s, 2.0 to 7.1 °C in the 2050s,
and 3.3 to 10.6 °C in the 2080s. Precipitation in the park was projected to increase 2 to
20% over this century. This set of projections covered the park as a whole and was
based on an earlier IPCC (2000) report on emissions scenarios.

A more recent summary of climate change projections for Ontario points to a 4.7 to
7.9°C increase in average annual air temperature in the Lake Huron and Ottawa River
basins when compared to the 1971–2000 30 year period (McDermid et al. 2015).

Model scenarios have since been updated (IPCC 2014b), certainty with respect to
weight of evidence has increased (Cook et al. 2016), and the capacity to down-scale
global circulation models has improved regional-scale climate projections. The ability to
project climate effects at a grid scale of 10 x 10 km allows change to be evaluated
within park boundaries. Since the park landscape has different forest types, growing

Science and Research Information Report IR-14                                           1
conditions, and topographic patterns, a detailed examination of change within its boundaries is an important step in understanding patterns of climate change affecting all ecosystems in the park. In the 21st century, the effects of global warming will be observed throughout Earth’s ecosystems and not just in Algonquin Park. In soils, microbial decomposition will change along with microbial/plant interactions that are important for plants to thrive (Classen et al. 2015). In forests near Lake Ontario, the species composition of hardwood forests is shifting from beech-maple-birch to beech (more widespread and abundant saplings now) based on warmer temperatures and increased precipitation (Bose et al. 2017). In Canada’s boreal forest, climate warming is projected to result in longer growing seasons (1–30% increase by 2100) and increased fire frequency and insect outbreaks. Because permafrost underlies 40% of the boreal forest, warming will fundamentally change the freeze/thaw patterns of soils and affect/change forest composition spanning many decades (Price et al. 2013). In oceans, increasing CO2 is acidifying surface water and, along with warmer surface temperature, is bleaching coral reefs (Doney et al. 2009, Spalding and Brown 2015). Climate warming occurring now and projected over the 21st century is expected to reduce polar ice by amounts that in the past have significantly increased sea levels (Dutton et al. 2015). Globally, oceans are expected to rise due to melting of polar ice caps over the 21st century and beyond. In lakes, climate warming is already leading to shorter periods of ice cover in winter, warmer water in summer, and earlier spring spawning for many aquatic species (Ficke et al. 2007, Ghanbari et al. 2009, Hewitt et al. 2018). As warming continues, many changes in how ecosystems function are projected to occur (Settele et al. 2014). For plants and animals, change will include shifts in species distribution and abundance and altered interactions in species assemblages, such as mechanisms of predation and competition. Species response will differ based on their physiology and capacity to move or adapt to new environments. By the end of the 21st century, ecosystems may look and function quite differently than today. Given the importance of Algonquin Park in conservation and public interest, updated climate warming projections at a scale below the park boundary are needed. Such projections are now recognized as a key step in overcoming the past mismatch between climate projections at coarse scales and potential effects at fine scales in aquatic and terrestrial habitats (Maclean et al. 2017, Nadeau et al. 2017). The purpose of this report is to summarize recent climate warming projections for Algonquin Park. Summarizing projections is important for improving understanding of potential effects on the park’s organisms and ecosystems and to inform adaptation and mitigation efforts. Here we focus specifically on the effects of temperature changes on lakes. Science and Research Information Report IR-14 2
The Keeling Curve

Beginning in the late 1950s, Charles Keeling began recording CO2 concentration in the
atmosphere from a sampling location at the Mauna Loa Observatory in Hawaii, United
States. Carbon dioxide is widely recognized as a greenhouse gas contributing to global
warming; therefore increasing concentrations of this atmospheric gas promotes climate
warming. Keeling’s time series record has continued and represents the clearest
evidence of changing patterns of global CO2. This time series is plotted in Figure 1 from
the beginning of Keeling’s data record to the end of December 2017. It shows that CO2
has increased steadily over decades with greater pace in recent years. The zig-zag
pattern evident in the time series is based on peak CO2 concentration in spring (May)
and low CO2 in fall (October) each year in the Northern Hemisphere. From May
onwards, CO2 is taken in by photosynthesis in plants during the growing season and,
beginning in October, it is released through decomposition until leaf-out the following
spring. This pattern is repeated each year.

For the first time in human history, CO2 concentration has exceeded 400 ppm in the last
two years (Figure 1).

Figure 1. The Keeling Curve of carbon dioxide concentration (CO2; parts per million),
1958–2017. The dotted line represents 400 ppm of CO2, a threshold not previously
experienced in human history.

Science and Research Information Report IR-14                                           3
Evidence for climate change in Algonquin Park

Evidence for climate change occurring in Algonquin Provincial Park is based on two
long-term data sets. First, ice-out date at Sproule Bay, Lake Opeongo, is recorded each
spring by staff at the Harkness Laboratory of Fisheries Research. Second, for nearly a
century, temperature recorded at Haliburton, Madawaska, and North Bay, Ontario,
provide a time series on changes in average annual air temperature northwest,
southwest, and southeast of the park, respectively.

The ice-out date varies from year-to year. Since the 1950s, the trend is earlier open
water dates on Sproule Bay (Figure 2). The trend line indicates that ice-out has been
advancing by 1.7 days per decade resulting in 9-day earlier ice-out since the start of the
observation record. The jagged pattern in the time series is typical for ice-out data,
which can be highly variable from year to year requiring decades of observation to
monitor trends.

                      140

                      130

                      120
        Day of year

                      110

                      100

                       90
                                                           y = -0.1723x + 461.14
                       80
                         1960   1970   1980     1990    2000        2010           2020
                                                Year

Figure 2. Ice-out day of year for Sproule Bay, Lake Opeongo, in Algonquin Provincial
Park, Ontario, beginning in 1964. The trend line indicates that ice-out day is advancing
at a rate of 1.7 days per decade. The latest ice-free day in Sproule Bay was in 1972
(day 136) and the earliest was in 2012 (day 89).

Science and Research Information Report IR-14                                              4
The average annual air temperature recorded at weather stations in Haliburton (1888– 2016), Madawaska (1915–2016), and North Bay (1925–2014) provide the longest time series of air temperature near the park. As observed in the ice-out data, average annual air temperature varies from year to year (Figure 3). Over the decades of observation, the trend line demonstrates an increase in average annual air temperature of approximately 1 °C at the three sites, which is consistent with global patterns (NASA 2018). Figure 3. The long-term temperature record of average annual air temperature from the Haliburton, Madawaska, and North Bay weather stations. All show high variability from year to year but an overall increasing trend with grey areas indicating potential range of trend lines. Science and Research Information Report IR-14 5
Temperature baseline for Algonquin Park

Using data from North Bay, Madawaska, and other locations in south central Ontario, a
general map of average annual air temperature can be developed for the park (Cross et
al. 2012, Ridgway et al. 2017). Figure 4 illustrates the variation in average annual air
temperature across the park landscape for the period 1981 to 2010, inclusive. Figure 4
represents average temperature over this 30 year period and serves as the baseline for
comparing observed temperatures and detecting climate warming. In this study,
computer model results for this 30 year period are compared against climate projections
for three future periods: 2011–2040, 2041–2070, and 2071–2100.

Figure 4. The observed 30 year average annual air temperature for Algonquin
Provincial Park, Ontario, for the period 1981–2010. Data and model interpolation using
methods presented by Cross et al. (2012).

Science and Research Information Report IR-14                                            6
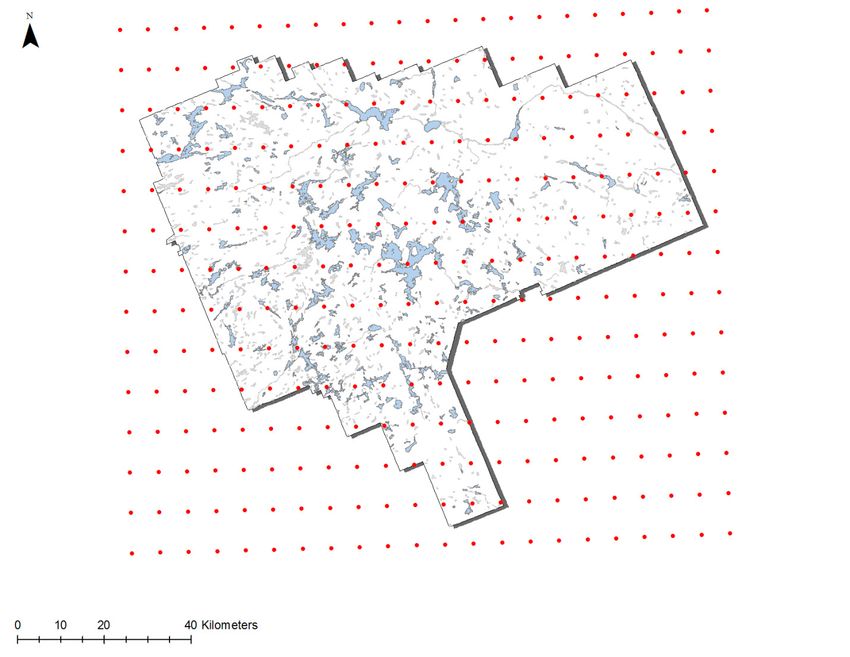
The ensemble model approach

Different research groups and governments worldwide have developed global
circulation models for the purpose of understanding climate change in their region of the
world. When making climate change projections combining models into an ensemble of
models provides a way to understand the ‘average’ projected change that will occur due
to increasing greenhouse gases.

The ensemble model approach was used in this study. Eight of 12 models for eastern
North America provided by the University of Victoria’s Pacific Climate Impacts
Consortium were selected as those most relevant to Canada and Ontario (see Appendix
1). These model projections describe change in climate based on best available
information as of 2017. Full details about the technical considerations and assumptions
of these models are available in IPCC reports (IPCC 2014a, b). Results from these 8
models combined are reported here as the average projection for the balance of this
century.

Two features of climate projection need to be understood when considering the study
results. First is the importance of distinguishing weather from climate. On any given day
or week, the weather may indicate that climate warming scenarios are out of step with
actual temperatures. As observed in the ice-out data (Figure 2), year-to-year variation is
relatively high but the trend is towards an earlier ice-out date. The difference is that
weather is what we experience in the short term (days, weeks, seasons) while climate is
the long term (years, decades, centuries, millennia) trend. In this study, computer
models were used to project climate through the 21st century.

Second, because oceans and atmosphere are fluids, each with a different density, how
they flow globally in response to one another is computationally intricate and best
captured at broad scales. The ability to downscale global circulation models to regional
scale makes it possible to address climate change at scales that are more relevant to
people, plants, and animals for the purposes of planning and to better understand
climate warming effects in ecosystems.

Downscaling circulation models to a 10 x 10 km grid results in 155 grid cells in
Algonquin Park and an additional 118 grid cells around the perimeter of the park (Figure
5). This gridding allows for more detailed climate projections across the park’s
landscape. Climate change projections for a given lake or location are based on
associating results for the closest grid node to that lake or location.

Science and Research Information Report IR-14                                              7
Figure 5. The grid system used in the ensemble climate model projections for
Algonquin Provincial Park, Ontario, and surrounding landscape. Each node (red)
represents a 10 x 10 km grid system for which climate change is evaluated. Maps of
climate change patterns are based on integrating model outcomes at each node.

Science and Research Information Report IR-14                                        8
Climate warming projection scenarios

For consistency, a common set of scenarios are used to evaluate climate change
projections around the world. These scenarios are referred to as representative
concentration pathways (RCP; IPCC 2014b).

Each RCP category reflects a difference between the Sun’s energy absorbed by Earth
and that radiated back to space relative to the state of absorption and loss in the pre-
industrial era. If energy radiated back to space is the same as that absorbed by Earth
then the net change is zero. If energy reaching Earth exceeds that radiated back to
space then more energy is retained in the atmosphere resulting in a net increase and
thus warming. If more energy is radiated back to space than is retained by Earth the net
negative change results in cooling.

Carbon dioxide has been present in the Earth’s atmosphere for a very long time,
resulting in conditions that have allowed life to flourish. However, increasing levels of
CO2 and other greenhouse gases are trapping more of the sun’s energy, amplifying the
warming effects beyond historical conditions. The potential outcomes of this warming
were evaluated for Algonquin Park based on the RCP categories described in Table 1.
These categories differ based on whether reductions in carbon emissions are
implemented early, mid-century, late, or not at all. Implementing reductions in carbon
emissions alters the trajectory of energy capture by the Earth’s atmosphere and
prevents further warming. Essentially, this means the rate of change in CO2
documented in the Keeling Curve slows and eventually levels out.

The RCP categories used in this analysis were RCP+8.5 (status quo continues) and
RCP+4.5 (CO2 peaks in 2040 then declines). The RCP+6.5 (CO2 peaks in 2060 then
declines) scenario was not analyzed but represents an intermediary between RCP+8.5
and RCP+4.5, which bound the projected average air temperature in Algonquin Park.
The RCP+2.6 category was not evaluated because it is based on CO2 peaking by 2020
followed by reduced emissions, which is no longer achievable, making that scenario
unrealistic. Since all RCP scenarios in this report are positive (+), the format used for
the balance of the report will be as RCP4.5, RCP8.5, etc. (Table 1).

Science and Research Information Report IR-14                                           9
Table 1. Description of the RCP (representative concentration pathways) used in the
climate warming projections in this study of Algonquin Park, Ontario. The number
associated with each category is the net change in the Sun’s energy retained in Earth’s
atmosphere in Watts per square metre (W per m-2). A Watt is the rate of energy change
(positive in this case) per unit time.
RCP category Description
RCP2.6 Carbon dioxide concentration peaks in 2010–2020 then declines.
This category was not examined in this study because it is no
longer a likely option.
RCP4.5 Carbon dioxide concentration peaks in 2040 and then declines.
RCP6.5 Carbon dioxide concentration peaks in 2060 and then declines.
This category is bounded by the RCP8.5 (upper bound) and
RCP4.5 (lower bound) projections so was not evaluated in this
study.
RCP8.5 Status quo: carbon dioxide concentration continues upward
trajectory at current rate.
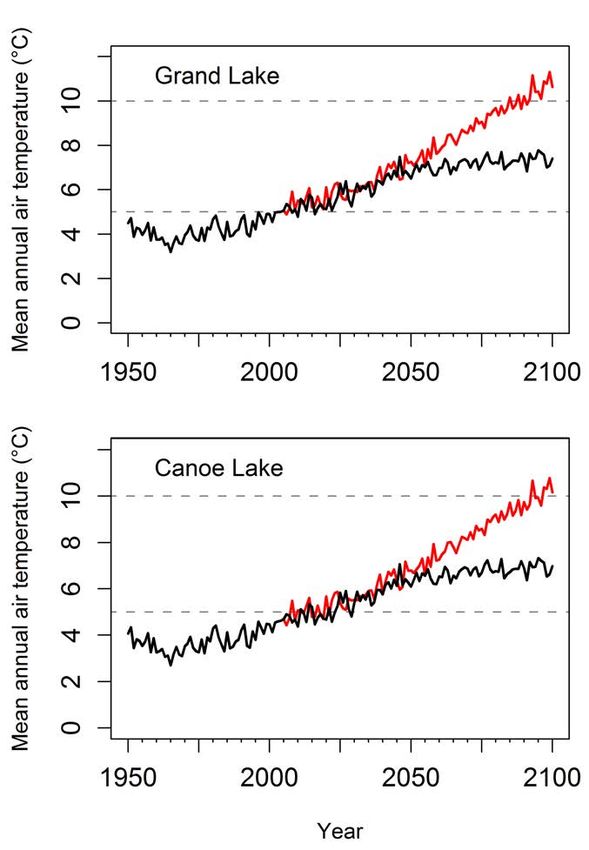
Science and Research Information Report IR-14 10Patterns of climate warming projected for Algonquin Park Climate was projected for each of the selected RCP scenarios at each node of the 10 x 10 km grid system overlain on Algonquin Park (Figure 5). To illustrate the projected trends, 2 nodes on 2 lakes were selected as examples of change in average air temperature during the 21st century. Because the ensemble models match historical observed air temperatures, trends in average annual air temperature are also presented starting in 1950. Trends for the selected lakes, which were Grand and Canoe, are shown in Figure 6. For each lake, climate ensemble models projected continued warming into mid-21st century for both RCP scenarios (Figure 6). The projections indicated that average annual air temperature today is warmer than that during the last decades of the 20th century—an observation consistent with earlier ice-out dates (Figure 2) and observed trends in average air temperature from nearby locations (Figure 3). Climate projections diverge in mid-century. Under the RCP4.5 scenario, greenhouse gas emissions are reduced and CO2 concentrations stabilize, effectively flattening the Keeling Curve. After this point, climate projections show average air temperature stabilizing at 6 to 7 °C (black trend lines; Figure 6). Under the RCP8.5 scenario, greenhouse gas emissions continue as today and CO2 concentrations continue to increase. By 2100, average annual air temperatures at both lakes is projected to be 10 °C or higher (red trend lines; Figure 6), with the Grand Lake area slightly warmer because of its lower elevation. The range in average annual air temperature of 6 to 7 °C (RCP4.5) and 10 °C (RCP8.5) represent the most likely range of possible outcomes in climate warming projections for the park. Any possibility of achieving a stable, lower average air temperature than in the RCP4.5 is now passing since that scenario requires action on greenhouse gases by 2020. Science and Research Information Report IR-14 11
Figure 6. Two examples of average air temperature trends near lakes in Algonquin
Provincial Park, Ontario, from the mid-20th to the end of the 21st century based on the
ensemble model projections. In each panel, the red line is projected temperature based
on a continuation of current carbon dioxide (CO2) concentration levels (RCP8.5) and the
black line is the projected trend given a global approach to reducing CO2 concentrations
by mid-21st century (RCP4.5). Dashed lines at 5 and 10 °C are shown for ease of
interpretation.

Science and Research Information Report IR-14                                        12
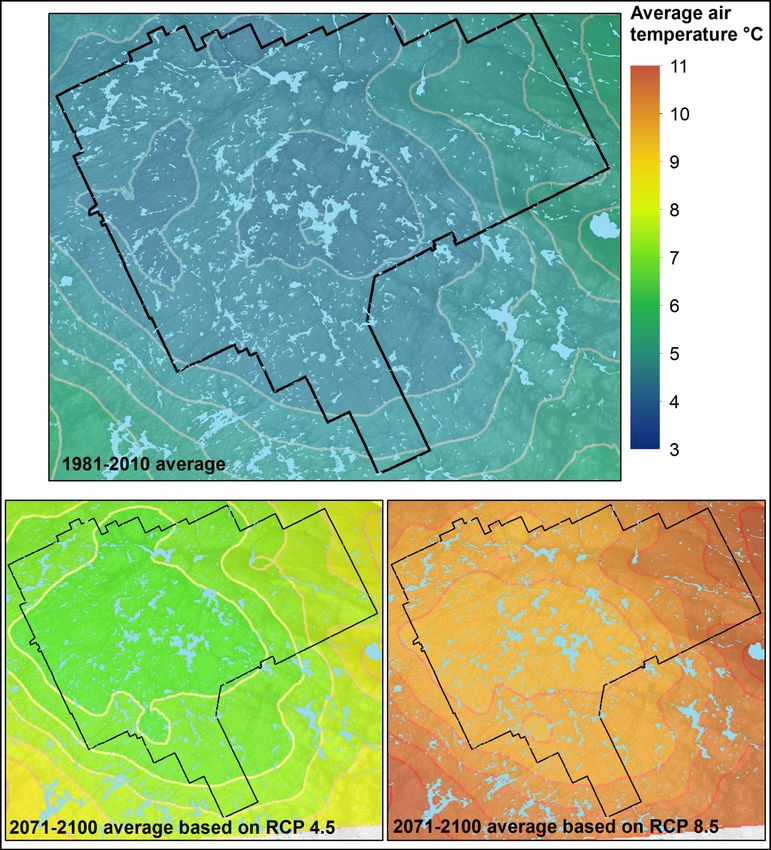
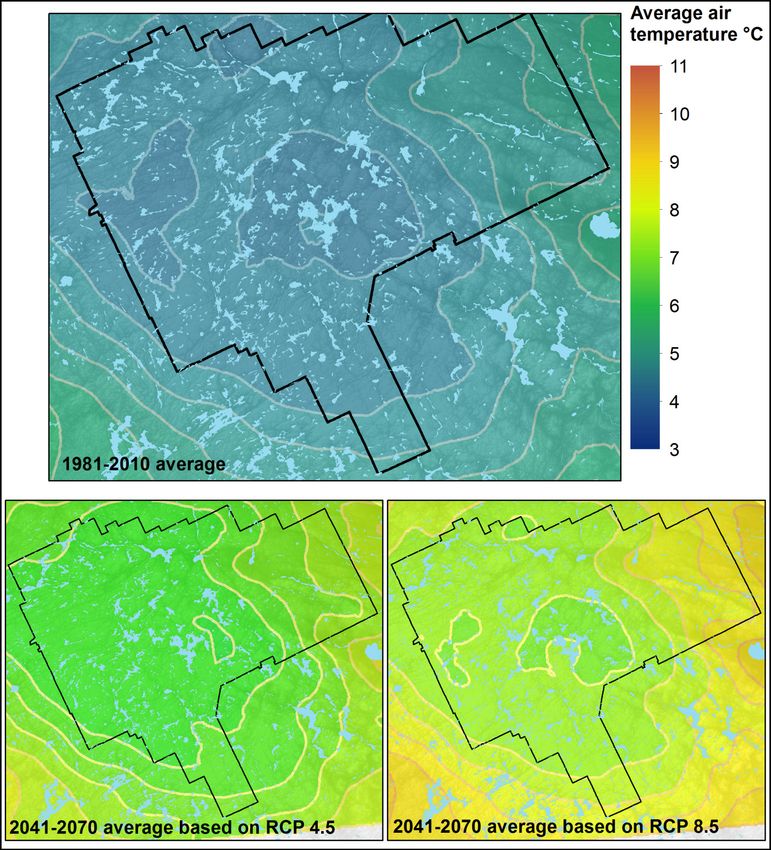
The climate projections for all grid nodes (Figure 5) for each RCP scenario were
averaged over several 30 year periods: 1981–2020, 2011–2040, 2041–2070, and
2071–2100. The average annual air temperature for each period was mapped with the
1981–2020 period serving as a reference condition against which to compare
projections for the subsequent 30 year periods. The map for the 1981–2020 period
matched observed conditions over the same period (Figure 4).

Projections for the period 2011–2040 are compared against the reference condition in
Figure 7 (upper panel). For both RCP scenarios, the maps are similar indicating a 30
year average air temperature of 5 to 6°C. The projections are similar at this point
because the assumption of reduction in CO2 concentration in the RCP4.5 scenario has
not come into full effect.

Projections for the period 2041–2070 are compared against the reference condition in
Figure 8 (upper panel). For both RCP scenarios, average air temperature is projected to
increase to 6.5 to 8°C. However, for the RCP8.5 scenario the increase is largely
confined to the central areas of the park with higher elevation (lower right panel). To the
east and south, the average air temperature is warmer ranging from 8 to 9°C.

Warming will occur in the park by 2011-2040 and 2041-2070 under both RCP
scenarios. The central area of Algonquin Park, which represents higher elevation, will
remain relatively cooler than the surrounding landscape of Ontario in each 30 year
period but above current average air temperatures as shown for the temperature trends
for Canoe and Grand Lakes (Figure 6).

Science and Research Information Report IR-14                                           13
Figure 7. The average air temperature of Algonquin Provincial Park, Ontario, based on
the ensemble climate projection model for the period 1981–2010 (top) and 2011–2040
based on the RCP4.5 climate projection (lower left) or the RCP8.5 climate projection
(lower right). The average air temperature for the period 1981–2010 ranges from 3.5 to
5 °C, for the 2011–2040 period for the RCP4.5 scenario ranges from 5.5 to 7 °C, and for
the 2011–2040 period for the RCP8.5 scenario ranges from 5.5 to 7 °C.

Science and Research Information Report IR-14                                       14
Figure 8. The average air temperature of Algonquin Provincial Park, Ontario, based on
the ensemble climate projection model for the period 1981–2010 (top) and 2041–2070
based on the RCP4.5 climate projection (lower left) or the RCP8.5 climate projection
(lower right). The average air temperature for the 1981–2010 period ranges from 3.5 to
5 °C, for the 2041–2070 period for the RCP4.5 scenario ranges from 6.5 to 8 °C, and for
the 2011–2040 period for the RCP8.5 scenario ranges from 7 to 8.5 °C.

Science and Research Information Report IR-14                                       15
Projections for the period 2071–2100 are compared against the reference condition in
Figure 9. By the end of the 21st century, differences in average air temperature between
the RCP4.5 and RCP8.5 scenarios become more obvious. Under RCP4.5 (Figure 9,
lower left panel), the pattern of average air temperature in the park remains in the
range of 6.5 to 8 °C, similar to the 2041–2070 period (Figure 8). This stability results
from the reductions in greenhouse gases envisioned in RCP4.5.

The lower right panel in Figure 9 shows the higher average air temperatures projected
to occur with continued growth in greenhouse gases – a continuation of the trend now
present in the Keeling Curve (Figure 1). The average air temperatures for this projection
range from approximately 9.5°C on the Algonquin Park dome to 10-11°C in the lower
elevation areas including the lower Petawawa River within eastern Algonquin Park.

To put the projected climate for Algonquin Park into context, projections were compared
to the 1981–2010 climate normals for Ontario (Environment and Natural Resources
Canada 2018). This allows projected average air temperature of the park to be
presented relative to current climate at a location in the province.

Under the RCP4.5 scenario, the climate of the park in 2071–2100 will approximate the
current average air temperature for Peterborough (6.9°C; Environment and Natural
Resources Canada 2018). As this scenario results in a stable but warmer temperature
by mid-century, it is possible that the park will reach these temperatures by mid-century.

Under RCP8.5 scenario, the climate of the park in 2071–2100 will approximate the
average air temperature of the Leamington-Windsor region (9.6–9.9°C; Environment
and Natural Resources Canada 2018). Based on the ensemble model projections, in
the late 21st century Algonquin Park’s climate will rest between a current average air
temperature defined by the locations of Peterborough and Leamington-Windsor.

Science and Research Information Report IR-14                                            16
Figure 9. The average air temperature of Algonquin Provincial Park based on the
ensemble climate projection model for the period 1981–2010 (top) and 2071–2100
based on the RCP4.5 climate projection (lower left) or the RCP8.5 climate projection
(lower right). Average air temperature for the 1981–2010 period ranges from 4 to 5 °C,
for the 2071–2100 period for the RCP4.5 scenario ranges from 7 to 8 °C, and for the
2071–2100 period for the RCP8.5 scenario ranges from 9 to 10 °C.

Science and Research Information Report IR-14                                       17
Climate warming and freshwater ecosystems

Many effects of climate warming have been observed or are projected to occur for fish
and freshwater ecosystems. Because hundreds of lakes in Algonquin Park are home to
cold water fish such as lake trout (Salvelinus namaycush), brook trout (Salvelinus
fontinalis), cisco (Coregonus artedi) and lake whitefish (Coregonus clupeaformis)
climate warming described in this report will affect these native species in several ways.
These effects are not restricted to Algonquin Park but are expected to occur globally
and are listed in Table 2. Observations over the past decades or climate model
projections are the source of the information reported in Table 2.

Table 2. Summary of effects of climate change on freshwater ecosystems such as lakes
and rivers (from Marcogliese 2001, Shuter et al. 2002, Lemieux et al. 2007, Sharma et
al. 2007, Dove-Thompson et al. 2011, Minns et al. 2012, Lynch et al. 2016, Comte and
Olden 2017, Myers et al. 2017).

Effect                  Description

Increased water         Lakes and rivers warm during the 21st century from general
temperature             atmospheric warming ranging from 3 to 7°C (depending on
                        modelling scenario). The boundary between upper warm layer
                        in lakes and deeper cold water layer will harden and reduce
                        mixing for longer duration each year. Reduced winds will result
                        in a shallower depth for the warm/cold water boundary.

Change in period of     Later ice formation on lakes in late fall/early winter and earlier
ice cover               ice-out dates now and continuing during this century. Overall
                        declines in the duration of ice cover for lakes; open water will
                        last 1 to 2 weeks longer by end of century.

Change in               Increased evaporation during longer warm season and
watershed               increased precipitation, depending on location, in central
environment             Canada. Main elements of environmental change are increasing
                        temperature, increased precipitation in many areas, and
                        increased flow in watersheds, perhaps on a seasonal basis.

Change in               Earlier spawning dates for spring spawning species. Migrations
spawning time           or movements to spawning areas are earlier for many species
                        using rivers.

Science and Research Information Report IR-14                                                18
Effect Description
Change in habitat Increased nutrient flux to lakes; increased duration and volume
of anoxia in lakes depending on productivity patterns; upper
thermal limits of various species results in reduced occupancy
due to warming waters. Loss of cold water habitat in lakes. Any
increase in loss of water levels will lead to drying in wetlands.
Population increase Declines in abundance for cisco, brook trout, and lake trout in
or decrease inland lakes due to warming; less so for cool-water fish;
warmwater species such as smallmouth bass (Micropterus
dolomieu) may be more abundant — subject to density-
dependent effects such as food limitation. For walleye (Sander
vitreum), warmer summers lead to more rapid growth and
earlier maturity — subject to available prey fish. Increased
walleye recruitment occurs with increases in spring warming
rate.
Change in species Northward expansion in range for species such as bass and
range sunfish as warm water species. A shift to dominance by warm
water species in many areas. Increase in number of species
due to warming because of range expansion for some species
within and among watersheds. Southward shifts observed for
small species, such as minnow species, due to loss of range
from expanding predators.
Change in species Potential for increase or decrease parasitism in prevalence
biology based on species response to temperature increase;
physiological limits exceeded by increasing water temperatures
or declines in late season dissolved oxygen.
Shallow Temperature of shallow groundwater approximates average
groundwater annual air temperature. Warmer air temperature can lead to
warming of shallow groundwater. Brook trout rely on shallow
groundwater for spawning and rearing so temperature increases
will affect the timing and potentially the suitability of this habitat
for brook trout populations.
Science and Research Information Report IR-14 19Conclusion The climate of Algonquin Park is projected to be warmer through the remainder of the 21st century. Average annual air temperature will rise beyond what is observed today (2018) to levels that match areas in southern Ontario. If rising greenhouse gas emissions continue as indicated by the Keeling Curve (RCP8.5 scenario), by the end of the 21st century the average annual air temperature of Algonquin Park will match the current average temperature of the Leamington–Windsor area of Ontario. Under a scenario of reduced greenhouse gases by mid-century (RCP4.5), the park’s temperature will match the current average annual air temperature of Peterborough. No reasonable climate scenario indicates that average annual air temperature of the park will remain as it is today. In resource planning, the range of climate projections among scenarios RCP4.5 to RCP8.5 (inclusive) should be considered as the probable outcomes for the future climate for Algonquin Park. The projection for 2011–2040 points to warming that is underway now. The most optimistic scenario of reducing greenhouse gas emissions by 2020 (RCP 2.6) or soon afterwards appears unlikely at this time, leaving the RCP4.5 scenario as the most optimistic projection. The final average annual air temperature for Algonquin Park stemming from climate warming in the 21st century will result from decisions about emissions and carbon dioxide management at global scale. The climate projections presented here indicate that changes in the park’s ecosystems are imminent. Warming of aquatic ecosystems such as lakes and streams will occur during the 21st century. Since surface groundwater temperatures approximate average annual air temperature, groundwater temperatures will also be higher by the end of the century. Science and Research Information Report IR-14 20
References

Bose, A.K., A. Weiskittel and R.G. Wagner. 2017. A three decade assessment of
      climate-associated changes in forest composition across the north-eastern USA.
      Journal of Applied Ecology 54: 1592–1604.
Chu, C. 2015. Climate vulnerability assessment for inland aquatic ecosystems in the
      Great Lakes basin. Ontario Ministry of Natural Resources, Applied Research and
      Development Branch, Peterborough, ON. Climate Change Research Report
      CCRR-43. 37 p.
Classen, A.T., K. Sundqvist, J.A. Henning, G.S. Newman, J.A.M. Moore, M.A. Cregger,
      L.C. Moorhead and C.M. Patterson. 2015. Direct and indirect effects of climate
      change on soil microbial and soil microbial-plant interactions: what lies ahead?
      Ecosphere 6(8): 130.
Comte, L. and J.D. Olden. 2017. Climatic vulnerability of the world’s freshwater and
     marine fishes. Nature Climate Change 7: 718–722.
Cook, J., N. Oreskes, P.T. Doran, W.R.L. Anderegg, B. Verheggen, E.W. Maibach, J.S.
      Carlton, S. Lewandowsky, A.G. Skuce, S.A. Green, D. Nuccitelli, P. Jacobs, M.
      Richardson, B. Winkler, R. Painting and K. Rice. 2016. Consensus on
      consensus: a synthesis of consensus estimates on human caused global
      warming. Environmental Research Letters 11(4): 048002.
Cross, J., D. Kaukinen, R. Sitch, S. Heringer, A. Smiegielski, D. Hatfield, G. MacIsaac
      and T. Marshall. 2012. Historic Climate Analysis Tool [Digital application].
      Version 2.5. Ontario Ministry of Natural Resources, Northwest Science and
      Information, Thunder Bay, ON.
Doney, S.C., V.J. Fabry, R.A. Feely and J.A. Kleypas. 2009. Ocean acidification: the
     other CO2 problem. Annual Review of Marine Science 1: 169–192.
Dove-Thompson, D., C. Lewis, P.A. Gray, C. Chu and W.I. Dunlop. 2011. A summary of
      effects of climate change on Ontario’s aquatic ecosystems. Ontario Ministry of
      Natural Resources, Applied Research and Development Branch, Peterborough,
      ON. Climate Change Research Report CCRR-11. 56 p.
Dutton, A., A.E. Carlson, A.J. Long, G.A. Milne, P.U. Clark, R. DeConto, B.P. Horton, S.
      Rahmstorf and M.E. Raymo. 2015. Sea-level rise due to polar ice-sheet mass
      loss during past warm periods. Science 349(6224): aaa4019.
Environment and Natural Resources Canada. 2018. Canadian Climate Normals 1981–
      2020. Station Data. 2018. Government of Canada, Environment and Natural
      Resources, Ottawa, ON. .
      Accessed March 14, 2018.
Ficke, A.D., C.A. Myrick and L.J. Hansen. 2007. Potential impacts of global climate
       change on freshwater fish. Reviews in Fish Biology and Fisheries 17: 581–613.

Science and Research Information Report IR-14                                             21
Ghanbari, R.N., H.R. Bravo, J.J. Magnuson, W.G. Hyzer and B.J. Benson. 2009.
Coherence between lake ice cover, local climate and teleconnections (Lake
Mendota, Wisconsin). Journal of Hydrology 374: 282–293.
Hewitt, B.S., L.S. Lopez, K.M. Gaibisels, A. Murdoch, S.N. Higgins, J.J. Magnuson,
A.M. Paterson, J.A. Rusack, H. Yao and S. Sharma. 2018. Historical trends,
drivers, and future projections of ice phenology in small north temperate lakes in
the Laurentian Great Lakes region. Water 10(1): 70.
[IPCC] Intergovernmental Panel on Climate Change. 2000. Special report on emissions
scenarios. Working Group III, Intergovernmental Panel on Climate Change,
Cambridge University Press, Cambridge, UK.
[IPCC] Intergovernmental Panel on Climate Change. 2014a. Summary for policymakers.
Contributions of working groups I, II and III to the Fifth Assessment Report of the
Intergovernmental Panel on Climate Change. Core writing team: R.K. Pachauri
and L.A. Meyer (eds). IPCC, Geneva, CH. 151 p.
[IPCC] Intergovernmental Panel on Climate Change. 2014b. Synthesis report.
Contributions of working groups I, II and III to the Fifth Assessment Report of the
Intergovernmental Panel on Climate Change Core writing team: R.K. Pachauri
and L.A. Meyer (eds). IPCC, Geneva, CH. 151 p.
Lemieux, C.J., D.J. Scott, P.A. Gray and R.G. Davis. 2007. Climate change and
Ontario’s provincial parks. Towards an adaptation strategy. Ontario Ministry of
Natural Resources, Applied Research and Development Branch, Peterborough,
ON. Climate Change Research Report CCRR-06. 81 p.
Lynch, A.J., B.J.E. Myers, C. Chu, L.A. Eby, J.A. Falke, R.P. Kovach, T.J. Krabbenhoft,
T.J. Kwak, J. Lyons, C.P. Paukert and J.E. Whitney. 2016. Climate change
effects on North American inland fish populations and assemblages. Fisheries
41: 346–361.
MacLean, I.M.D., A.J. Suggitt, R.J. Wilson, J.P. Duffy and J.J. Bennie. 2017. Fine-scale
climate change: Modelling spatial variation in biologically meaningful rates of
warming. Global Change Biology 23: 256–268.
Marcogliese, D.J. 2001. Implications of climate change for parasitism of animals in the
aquatic environment. Canadian Journal of Zoology 79: 1331–1352.
McDermid, J., S. Fera and A. Hogg. 2015. Climate change projections for Ontario: an
updated synthesis for policymakers and planners. Ontario Ministry of Natural
Resources and Forestry, Science and Research Branch, Peterborough, ON.
Climate Change Research Report CCRR-44. 27 p.
Minns, C.K.B.J. Shuter and J.L. McDermid. 2009. Regional projections for climate
change effects on Ontario lake trout (Salvelinus namaycush) populations. Ontario
Ministry of Natural Resources, Applied Research and Development Branch,
Peterborough, ON. Climate Change Research Report CCRR-14. 10 p.
Minns, C.K., B.J. Shuter and S. Fung. 2012. Regional projections of climate change
effects on ice-cover and open-water duration for Ontario lakes. Ontario Ministry
Science and Research Information Report IR-14 22of Natural Resources, Applied Research and Development Branch,
Peterborough, ON. Climate Change Research Report CCRR-27. 19 p.
Myers, B.J.E., A.J. Lynch, D.B. Bunnell, C. Chu, J.A. Falke, R.P. Kovach, T.J.
Krabbenhoft, T.J. Kwak and C.P. Paukert. 2017. Global synthesis of the
documented and projected effects of climate change on inland fishes. Reviews in
Fish Biology and Fisheries 27: 339–361.
Nadeau, C.P., M.C. Urban and J.R. Bridle. 2017. Coarse climate change projections for
species living in a fine-scaled world. Global Change Biology 23: 12–24.
[NASA] National Aeronautics and Space Administration. 2018. Global land-ocean
temperature index. National Aeronautics and Space Administration, Goddard
Institute of Space Studies. California Institute of Technology, Passadena, CA.
. Accessed Jan 19,
2018.
Price, D.T., R.I. Alfaro, K.J. Brown, M.D. Flannigan, R.A. Fleming, E.H. Hogg, M.P.
Girardin, T. Lakusta, M. Johnston, D.W. McKenney, J.H. Pedlar, T. Stratton, R.N.
Sturrock, I.D. Thompson, J.A. Trofymow and L.A. Venier. 2013. Anticipating the
consequences of climate change for Canada’s boreal forest ecosystems.
Environmental Reviews 21(4): 322–365.
Ridgway, M., T. Middel and A. Bell. 2017. Aquatic ecology, history, and diversity of
Algonquin Provincial Park. Ontario Ministry of Natural Resources and Forestry,
Science and Research Branch, Peterborough, ON. Science and Information
Report IR-10. 203 p.
Settele, J., R. Scholes, R. Betts, S. Bunn, P. Leadley, D. Nepstad, J.T. Overpeck and
M.A. Taboada. 2014. Terrestrial and inland water systems. Pp. 271–359 in Field,
C.B. and 15 co-editors (eds.). Climate Change 2014: Impacts, adaptation, and
vulnerability. Part A: Global and sectoral aspects. Contribution of working group II
to the Fifth Assessment Report of the Intergovernmental Panel on Climate
Change. Cambridge University Press, Cambridge, UK.
Shuter, B.J., C.K. Minns and N. Lester. 2002. Climate change, freshwater fish and
fisheries. Case studies from Ontario and their use in assessing potential impacts.
In: Fisheries in a Changing Climate. American Fisheries Society Symposium 32:
77–87.
Urban, M.C., G. Bocedi , A.P. Hendry , J.B. Mihoub, G. Pe'er, A. Singer, J.R. Bridle,
L.G. Crozier, L. De Meester, W. Godsoe, A. Gonzalez, J.J. Hellmann, R.D. Holt,
A. Huth, K. Johst, C.B. Krug, P.W. Leadley, S.C. Palmer, J.H. Pantel, A. Schmitz,
P.A. Zollner and J.M. Travis. 2016. Improving the forecast for biodiversity under
climate change. Science 353: 1113–1122.
Science and Research Information Report IR-14 23Appendix 1. The climate models
Climate models used in this report were obtained from the Pacific Climate Impacts
Consortium at the University of Victoria
(; accessed Jan 15,
2017).
The available climate models for eastern North America are listed below. Those
underlined indicate models chosen for this ensemble analysis.
• MPI-ESM-LR – The Max-Planck-Institute Earth System Model – at base resolution
• CCSM4.0 – Community Climate System Model
• INMCM4.0 – Institute of Numerical Mathematics Climate Model
• CSIRO-Mk3.6.0 – Commonwealth Scientific and Industrial Research Organisation
Climate System Model
• HadGEM2-CC – Hadley Global Environment Model 2 - Carbon Cycle
• GFDL-ESM2G – Geophysical Fluid Dynamics Laboratory – Earth System Model
• HadGEM2-ES – Hadley Global Environment Model 2 – Earth System
• MRI-CGCM3 – Meteorological Research Institute Coupled Global Climate Model
• ACCESS1-0 – Australian Community Climate and Earth System Simulator coupled
model
• CNRM-CM5 – Centre National de Recherches Météorologiques Climat Model
• CanESM2 – Canadian Centre for Climate Modelling and Analysis Earth System
Model
• MIROC5 – Center for Climate System Research Model for Interdisciplinary
Research on Climate
Model selection was based on the following publications:
McKenney, D.W., M.F. Hutchinson, P. Papadopol, K. Lawrence, J. Pedlar, K. Campbell,
E. Milewska, R. Hopkinson, D. Price and T. Owen. 2011. Customized spatial climate
models for North America. Bulletin of the American Meteorological Society 92(12):
1611–1622.
Werner, A.T. 2011. BCSD downscaled transient climate projections for eight select
GCMs over British Columbia, Canada. Pacific Climate Impacts Consortium,
University of Victoria, Victoria, BC. 63 p.
Science and Research Information Report IR-14 24(.2k P.R. 18 04 27) ISBN 978-1-4868-2179-2 (print) ISBN 978-1-4868-2180-8 (pdf)
You can also read