Contribution of food loss to greenhouse gas assessment of high-value agricultural produce: California production, U.S. consumption - IOPscience
←
→
Page content transcription
If your browser does not render page correctly, please read the page content below
LETTER • OPEN ACCESS

Contribution of food loss to greenhouse gas assessment of high-value
agricultural produce: California production, U.S. consumption
To cite this article: Yuwei Qin and Arpad Horvath 2021 Environ. Res. Lett. 16 014024

View the article online for updates and enhancements.

                               This content was downloaded from IP address 46.4.80.155 on 02/02/2021 at 04:41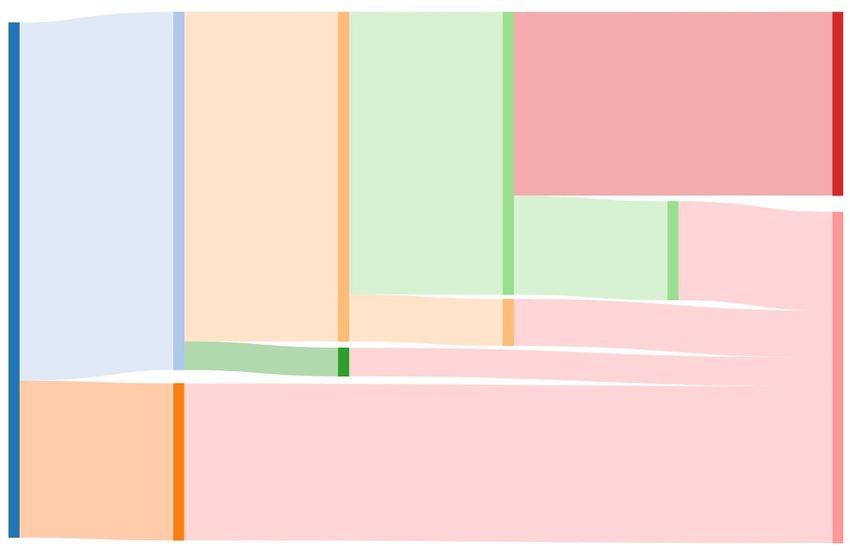
Environ. Res. Lett. 16 (2021) 014024 https://doi.org/10.1088/1748-9326/abcfdf
LETTER
Contribution of food loss to greenhouse gas assessment of
OPEN ACCESS
high-value agricultural produce: California production, U.S.
RECEIVED
21 August 2020 consumption
REVISED
20 October 2020 Yuwei Qin and Arpad Horvath
ACCEPTED FOR PUBLICATION
Department of Civil and Environmental Engineering, University of California, Berkeley, CA 94720, United States of America
2 December 2020
E-mail: yuweiqin@berkeley.edu
PUBLISHED
28 December 2020
Keywords: food production, food waste, fruits, vegetables, strawberry, climate change, GHG emissions
Supplementary material for this article is available online
Original content from
this work may be used
under the terms of the
Creative Commons
Attribution 4.0 licence. Abstract
Any further distribution Food loss (wasted and spoiled food) increases the burden on resources and environmental impacts
of this work must
maintain attribution to
throughout the entire food chain. This study describes and deploys a model and identifies data
the author(s) and the title sources for estimation of greenhouse gas (GHG) emissions associated with food loss from farm
of the work, journal
citation and DOI. production, delivery and refrigeration, retail sale, household consumption, and waste management
in the United States using four California-grown high-value produce as case studies. The ratios of
food wasted to food produced are 50%, 60%, 50%, and 64% for avocados, celery, lemons, and
strawberries, respectively, and the differences are largely influenced by consumer-level and on-farm
food loss. From the consumption perspective, this means, for example, that 1.8 units of
strawberries are wasted for every unit consumed. The packaging material is a significant
environmental offender, contributing, e.g. 52% to the total emissions (without food loss) for
strawberries. End-of-life analysis of wasted food and packaging covers the common waste
management practices: landfilling, composting, anaerobic digestion, incineration, and recycling.
Uncertainties in the data are assessed through Monte Carlo simulation. With the consideration of
food loss, the total GHG emissions from the entire life cycle of strawberries, celery, avocados, and
lemons increase by 93%, 62%, 56%, and 53% to 0.26, 0.038, 0.061, and 0.058 kg CO2 eq. per one
serving size, respectively. Emissions from the annually wasted strawberries, avocados, celery, and
lemons in California amount to 76, 24, 12, and 12 000 tons of CO2 eq., respectively. Fourteen
percent of the world’s population could have a serving of strawberries just from the annually
wasted strawberries in California. However, wasteful consumer action can be even more
significant. Emissions from a typical driving scenario to a store to purchase only one produce
exceeds the emissions associated with all four produce combined. Reducing food waste during
consumption and the environmental impacts of packaging should be prioritized.
1. Introduction Organization (FAO) of the United Nations [6]. On
average, 40% of edible food ends up uneaten, equal-
One of the challenges of the 21st century is to meet ing 181 kg of food per capita each year in the United
the food demand of the increasing world population States alone [7].
while achieving sustainability [1–3]. The world’s total Wasting food means wasting energy and mater-
food production was 20 Gt in 2013 [4], or 2.8 tons ials and creating unnecessary pollution along food
per person. The world food demand will double from supply chains. Several studies to date have evaluated
2005 to 2050 due to population growth and con- the environmental impacts associated with food loss.
sumption increase [5]. However, around a third of Kummu et al estimated that about 1/4 of the total use
the food is lost (e.g. at the farm) or wasted (spoiled, of water, cropland, and fertilizers are wasted due to
rejected based on appearance, or otherwise inedible) food losses at the global scale [8]. Hall et al confirmed
every year as estimated by the Food and Agriculture that the production of wasted food consumed more
© 2020 The Author(s). Published by IOP Publishing Ltd
Environ. Res. Lett. 16 (2021) 014024                                                             Y Qin and A Horvath

than 25% of the freshwater used in the United States        to better understand food loss and possible preven-
[9]. The FAO estimated that the annual carbon foot-         tion [30]. A qualitative approach was performed to
print from food loss was 3.3 Gt CO2 eq., contribut-         study food loss for fruits and vegetables in primary
ing 8.0% to the total anthropogenic greenhouse gas          (farm) production [31]. Corrado et al suggested a
(GHG) emissions in 2007 [10]. The GHG emissions             common methodological framework to model food
of post-harvesting food loss were estimated to be           loss in LCA studies [15].
1.4 kg CO2 . eq. per capita per day in the United States,        The studies that have incorporated quantitative
contributing 28% to the total carbon footprint of an        food loss assessment have seldom considered food
American’s diet on average [11] GHG emissions asso-         losses in all stages of the food supply chain, and most
ciated with rejected food due to cosmetic imperfec-         of them focused on the post-harvest, retail, or the
tion is believed to amount to 22.5 Mt CO2 eq. per year      consumption phases. On-farm food loss has gained
in the European Economic Area [12]. Rethink Food            attention recently, and the quantification of farm-
Waste through Economics and Data (ReFED) estim-             level food loss often relies on grower interviews [31–
ated that 9.2 billion kg of food was lost on the farm in    33]. Baker et al collected on-farm food loss data for
the United States [13]. Common causes of food loss          20 different crops from 123 field surveys in Califor-
include unsatisfactory quality of the food, deteriora-      nia [34]. Research on food loss at retail and consumer
tion during transportation or storage, excessive pur-       stages found that economic management practices,
chasing of food for home, and excessive ordering of         marketing considerations, and consumer behavior
food at restaurants [14, 15].                               are the main drivers of loss [35–40]. Parfitt et al
     As shown, while some high-level data and estim-        reviewed the worldwide post-harvest food waste stud-
ates of food loss are available, insufficient and incon-    ies and found that fresh vegetables and fruits are usu-
sistent data on food loss rates for specific foods and      ally the most wasted food items [14]. Buzby et al
regions remain major challenges of understanding the        analyzed the retail food losses for 61 fruits and 60
current food loss situation [16]. Case in point, most       vegetables using shipment data and sales data [36].
studies to date have used an average food loss ratio        Brancoli et al performed an LCA study for three food
collected for all food items to calculate the related       categories and assessed the impacts of waste treat-
impacts on the environment [17–19]. For example,            ment practices.
Moult et al assessed the GHG emissions of retail-                Food loss should be estimated from harvest to
level food waste for five types of food groups in the       final consumption in the food life cycle [6]. In
United Kingdom [20]. In addition, methodological            this study, we analyze five stages—production, deliv-
issues have also been limiting factors in revealing the     ery, retail sales, consumption at home, and waste
true environmental effects of food loss.                    management—and describe a life-cycle method to
     Life-cycle assessment (LCA) has been applied           analyze food loss using empirical data on high-value
to several studies to evaluate the environmental            produce to demonstrate how food loss contributes to
impacts associated with food production, delivery,          the total environmental impact. To our knowledge,
storage, and consumption. However, most LCA stud-           this study is the first to quantify the life-cycle GHG
ies only account for emissions from a part of the           emissions of food and food waste along the entire
supply chain and ignore food losses [15, 21–23].            food supply chain from farm-to-retail operations and
For example, Cerutti et al evaluated the cradle-to-         then to the individual consumer, and apply practical
market environmental impacts of apples in Italy [24].       waste management options to food and packaging
Knudsen et al analyzed fresh oranges and orange             wastes.
juice in Brazil [25]. The environmental impacts of
organic and conventional avocados were compared             2. Methods and data
in a cradle-to-gate LCA study [26]. Pergola et al
performed an energy, cost, and environmental ana-           Food loss is the reduction in food intended for human
lysis for lemon and orange and found that organic           consumption. We have evaluated food loss at four
farms had lower environmental impacts than con-             main stages, and the categorization of food loss stages
ventional farms [27]. However, these environmental          was inspired by the FLW Standard, the FAO’s defini-
analyses were only performed for the cradle-to-gate         tion, and the FUSIONS Definitional Framework for
or cradle-to-market cycles, and food loss was not           Food Waste [10, 41, 42]. Table 1 describes the four
considered.                                                 assessed food loss stages and figure 1 shows the
     Most of the studies that included food loss have       food loss stages and assessed processes. Although the
done it via mathematical modeling, without empir-           retail-to-consumer stage is not included in the envir-
ical data from measuring food loss in the field. Willi-     onmental assessment of food loss associated with
ams and Wikström developed a method to represent            produce because it would vary with the consumer’s
the linear relationship between the reduced environ-        driving distance, vehicle type, and total food pur-
mental impacts of packaging and food losses [28, 29].       chased per trip, we compared the estimated emis-
A hierarchical framework for food management dur-           sions of retail-to-consumer transportation and the
ing each stage in the food supply chain was proposed        total life-cycle emissions at the end of the analysis.

                                               2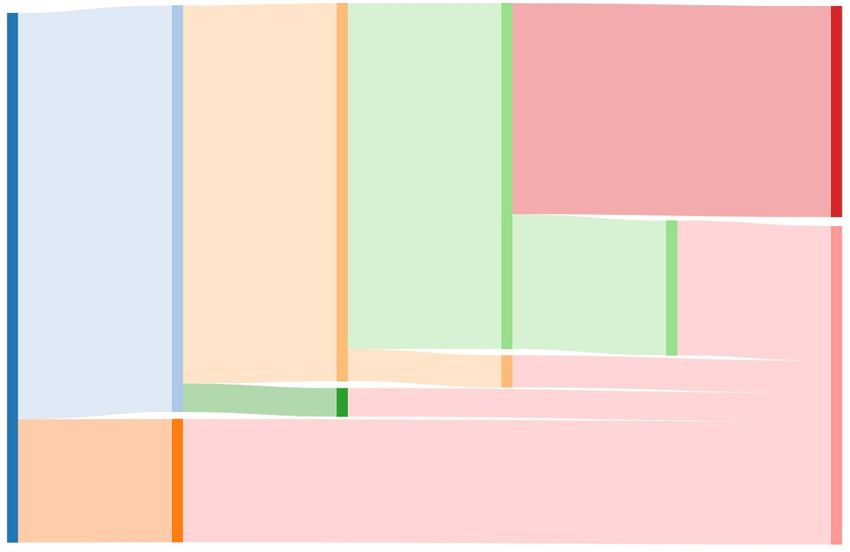
Environ. Res. Lett. 16 (2021) 014024                                                                               Y Qin and A Horvath

Table 1. Definition of the food loss stages and their coverages in    packaging, transportation, and refrigeration in the
the study.
                                                                      truck, retail store, and home.
Stage                        Definition                                   The emissions from waste management for
                                                                      wasted food and packaging materials for each phase
On-farm                      Crops not harvested and crops
                             left in the field
                                                                      can be calculated as:
Farm-to-retail               Food lost during transportation                                  ∑
                                                                                              5
                             from farm to retail                                 W i = ti +          rfn,i fn,i + rpn,i pn,i      (4)
                                                                                              n =1
Retail sales                 Food lost due to bad storage and
                             unsold food                              where ti denotes the emissions from transporting the
Consumer                     Food lost due to bad storage and
                                                                      food and packaging wastes in the food loss phase i; n
                             uneaten food at home
                                                                      is the waste management method (n = 1 is incinera-
                                                                      tion; n = 2 is landfilling; n = 3 is composting; n = 4
    For one unit of consumed food, the total emis-                    is anaerobic digestion; n = 5 is recycling); rfn,i is the
sions from cradle to grave are:                                       ratio of food waste management for the waste man-
                                                                      agement method n; fn,i is the emission factor of the
                          Et = Ec + El                          (1)   food waste management method n; rpn,i is the ratio
                                                                      of packaging waste management for the waste man-
where Ec denotes the cradle-to-grave emissions                        agement method n; pn,i is the emission factor of the
without food loss for one unit of consumed food;                      packaging waste management method n.
El is the cradle-to-grave emissions from food loss for
one unit of consumed food.                                            2.1. Data
     The life-cycle emissions without consideration of                The food loss ratios were obtained from the loss-
food loss (Ec ) for one unit of consumed food can be                  adjusted food availability (LAFA) dataset from the
calculated as:                                                        United States Department of Agriculture (USDA) and
                                                                      other literature [34, 43, 44]. The LAFA data have
     Ec = Epr + Epa + Et + Ert + Ere + Erh + Ew                 (2)   been used to estimate the amount and value of food
                                                                      loss at the retail and consumer levels in the United
where Epr is the emissions of food production; Epa
                                                                      States, and the food loss includes the loss from inad-
denotes the emissions of food packaging; Et is the
                                                                      equate climate control, pests, mold, and food waste
emissions of food transportation; Ert is the emis-
                                                                      [1, 45]. The production data were sourced from the
sions of food refrigeration in truck transportation;
                                                                      ‘cost and return studies’ from the University of Cali-
Ere is the emissions of food refrigeration in retail
                                                                      fornia, Davis [46–49]. Truck transportation was used
store; Erh is the emissions of food refrigeration at
                                                                      for transporting food from farm to retail, and for
home; Ew is the emissions of waste management
                                                                      transporting food and packaging wastes from the
of packaging materials for consumed food. The
                                                                      farm, retail, and home to waste management loc-
detailed calculation steps for production, packaging,
                                                                      ations [50]. The emissions from refrigeration dur-
transportation, and refrigeration in the truck, retail
                                                                      ing farm-to-retail transportation, retail operations,
store, and home of the consumer are included in
                                                                      and at the consumer’s home were estimated by the
the supplementary data (S2–S5, available online at
                                                                      volume of packaged food [41, 42, 51]. The detailed
https://stacks.iop.org/ERL/16/014024/mmedia).
                                                                      data and emission calculations for production, pack-
    The cradle-to-grave GHG emissions from food
                                                                      aging, transportation, and refrigeration can be found
loss (El ) can be calculated for one unit of consumed
                                                                      in the supplementary data (S3–S5). The GHG emis-
food as:
                                                                      sions from waste management practices of wasted
                            ∑
                            4                                         food and packaging materials were calculated from
                     El =         ri (ei + Wi )                 (3)   the U.S. Environmental Protection Agency’s (EPA)
                            i=1
                                                                      waste reduction model (WARM) [52]. The material-
where ri is the food loss ratio of food loss phase i                  specific emissions and energy factors used in the
(i = 1 is the on-farm phase; i = 2 is the farm-to-retail              WARM model are based on a life-cycle perspective.
phase; i = 3 is the retail phase; i = 4 is the consumer
phase); fi denotes the emissions of food production,                  3. Case study
transportation, and refrigeration of the wasted food
during phase i; and Wi is the parameter for emissions                 California is the top producer for many agricultural
associated with food waste management at phase i. e1                  products in the United States, accounting for 98%
includes the emissions of food harvesting; e2 includes                of avocados, 96% of celery, 89% of strawberries, and
the emissions from food harvest, packaging, trans-                    79% of lemons [53]. The key parameters and assump-
portation, and refrigeration in the truck; e3 includes                tions for the four high-value produce used in the
the emissions of food harvesting, packaging, trans-                   study are presented in table 2. The transportation
portation, and refrigeration in the truck and retail                  distances and refrigeration periods for the four pro-
store, e4 includes the emissions of food harvesting,                  duce are based on our estimates, and the uncertainties

                                                         3
Environ. Res. Lett. 16 (2021) 014024 Y Qin and A Horvath
Figure 1. Flow diagram of assessed food waste stages and processes in the study.
for those parameters and other parameters are con- interviews in California in 2017 [34]. The on-farm
sidered in the uncertainty analysis. The detailed pro- food loss ratios for avocados and lemons were estim-
duction data and emission factors are included in the ated based on interviews with Californian growers in
supplementary data S2 and S9. 2017 [44]. The food loss ratios at the farm-to-retail,
The food loss ratios at each phase are summarized retail, and consumer phases were extracted from the
in table 3. The food loss ratio is defined as the ratio of LAFA dataset [43].
wasted food to food available for final consumption. The total food losses for one unit of produced avo-
The on-farm food loss ratio represents the produce cados, celery, lemons, and strawberries are 50%, 60%,
left on the field after harvest as a proportion to the 50%, and 64%, respectively (table 3). For example,
food intended for human consumption. The farm- 2.5% avocados will be lost on farm when 1 kg was
to-retail food loss ratio denotes the ratio of food lost produced. Therefore, 0.975 kg leaves the farm. Then
before retail to the food sold at the farm. The retail- 6.0% will be lost during the transportation from farm
level food loss ratio represents the rate of unsold food to retail, followed by an additional loss of 19% in retail
to total food for sale. The consumer-level food loss and 33% in the consumer’s home. Therefore, of the
ratio is the percentage of uneaten food to purchased original 1 kg of avocados produced, only 50% will be
food. eaten.
The on-farm food loss ratios for strawberries On-farm food loss ratios vary significantly across
and celery were estimated from in-field surveys and the different produce, while the consumer-level loss
4Environ. Res. Lett. 16 (2021) 014024 Y Qin and A Horvath
Table 2. Key parameters and assumptions used in the study [41, 42, 50, 51, 54, 55].
Parameter Unit Avocado Celery Lemon Strawberry
Transportation distance km 300 300 300 300
from farm to retail
Transportation distance km 2 2 2 2
from retail to consumer
Transportation distance of km 30 30 30 30
waste
Refrigeration period in d 0 7 0 3
retail
Refrigeration period at d 0 4 0 2
home
Emission factor of truck kg CO2 eq. kg−1 km−1 0.00036 0.00036 0.00036 0.00036
transportation [50]
Emission factor of kg CO2 eq. km−1 0.61 0.61 0.61 0.61
passenger car [54]
Transportation kg CO2 eq. m−3 km−1 0.0025 0.0025 0.0025 0.0025
refrigeration [41]
Retail refrigeration [42, 51] kg CO2 eq. m−3 d−1 2.0 2.0 2.0 2.0
Home refrigeration [55] kg CO2 eq. m−3 d−1 0.80 0.80 0.80 0.80
Table 3. Food loss ratios for avocados, celery, lemons, and strawberries [34, 43, 44].
Avocado Celery Lemon Strawberry
On-farm loss [34, 45] 2.5% 23% 2.0% 31%
Farm-to-retail loss [44] 6.0% 7.0% 4.0% 8.0%
Retail-level loss [44] 19% 8.5% 5.1% 14%
Consumer-level loss [44] 33% 39% 44% 35%
Table 4. Waste management ratios for food and packaging wastes.
Anaerobic
Incineration Landfilling Composting Digestion Recycling
On-farm food waste 0% 50% 50% 0% 0%
Farm-to-retail food waste [56] 50% 0% 25% 25% 0%
Retail-level food waste [56] 50% 0% 25% 25% 0%
Consumer-level food waste [56] 33% 51% 8.0% 8.0% 0%
Plastic packaging waste [57] 17% 70% 0% 0% 13%
Paperboard packaging waste [57] 5.0% 22% 0% 0% 73%
ratios are similar. Consumer-level food loss is the management ratios were collected from the EPA’s
top contributor to total food losses of three of four container- and packaging product-specific data [57].
produce, contributing about four-fifths for lemons
and one-half for avocados and celery, respectively.
On-farm losses for strawberries and celery contribute 3.1. Uncertainty assessment
about a half and a third to the total, respectively. Monte Carlo simulation was performed to explore
The end-of-life analysis in the study considers all the uncertainties in the 32 parameters used in our
the common waste management practices, including model. The uncertainty sources included food loss
landfilling, composting, anaerobic digestion, inciner- ratios, transportation distances, refrigeration times,
ation, and recycling. The waste management ratios and emission factors for materials, electricity, fuels,
for food and packaging wastes are presented in table 4. refrigeration, and waste management covering the
The food waste ratios at the farm-to-retail, retail, and four food supply phases. The ranges of on-farm
consumer levels were based on a study of waste man- food loss ratios were based on the existing liter-
agement at different post-harvest phases [56]. Due to ature [32, 34]. We assumed uncertainty ranges of
lack of data, on-farm food waste management ratios 20% for the emission factors of materials, electricity,
are based on our estimates. Because the produce left fuels, refrigeration, and transportation, and uncer-
in the field is usually tilled back into the soil [44], tainty ranges of 50% for the emission factors of food
we assumed half of the on-farm food waste was land- and packaging waste management and refrigeration
filled and half was composted. The packaging waste time. The probability distribution functions of the
5Environ. Res. Lett. 16 (2021) 014024 Y Qin and A Horvath
Figure 2. Sankey diagram for the production and food loss of 1 kg of avocado consumption. Ec covers the life-cycle emissions for
consumed food from production, packaging, transportation, and refrigeration in the truck, retail store, and consumer’s home. El
covers the cradle-to-grave emissions from total food loss.
Figure 3. Sankey diagram for the production and food loss of 1 kg of celery consumption.
parameters for the four produce are presented in the four stages of the food availability and food loss
supplementary data (tables S9.1–S9.4). We conducted phases for 1 kg of avocados, celery, lemons, and straw-
10 000 iterations for each produce. The ranges which berries consumed. For example, in order to consume
contain 95% uncertainty intervals of the simulated 1 kg of strawberries, 2.8 kg of strawberries need to be
results are presented as error bars in figures 7 and 8. grown on the farm; 0.85 kg will be wasted on the field;
0.16 kg will be spoiled during the transportation from
4. Results farm to retail; 0.25 kg will be thrown away at retail
stores, and 0.54 kg will be forgone at home.
From the consumption perspective, 1.0, 1.5, 1.0, and We have calculated the GHG emissions for
1.8 units of produce are wasted for every unit of avo- one serving size of consumed food without food
cados, celery, lemons, and strawberries consumed, loss, Ec , which included production, packaging,
respectively. Figures 2–5 are Sankey diagrams for the transportation, refrigeration during transportation,
6Environ. Res. Lett. 16 (2021) 014024 Y Qin and A Horvath
Figure 4. Sankey diagram for the production and food loss of 1 kg of lemon consumption.
Figure 5. Sankey diagram for the production and food loss of 1 kg of strawberry consumption.
retail operations, and home refrigeration. The U.S. For strawberries and celery, refrigeration is needed for
serving sizes for strawberry and celery are 144 g (1 storage during retail and at home. For avocados and
cup) and 51 g (1/2 cup), respectively [58]. Due to lemons, refrigeration is not required but is often prac-
unavailable guidance, we used 1 lemon and 1/2 avo- ticed, thus we calculated the emissions under both
cado as serving sizes. scenarios of refrigeration.
The results in table 5 show that, without the con- We also estimated the GHG emissions associated
sideration of food loss, the life-cycle emissions for with food loss, El , for avocados, celery, lemons, and
one serving size of avocados, celery, lemons, and strawberries through equation (1). The results of the
strawberries are 0.039, 0.023, 0.038, 0.13 kg CO2 eq., GHG emissions for one serving size are presented in
respectively. The emissions for 1 kg of food consump- table 6. (Results for 1 kg can be found in the sup-
tion can be found in the supporting data (table S6). plementary data.) The food harvesting process con-
Packaging contributes 52% of the total emissions for tributes a large portion of emissions associated with
strawberries without the consideration of food loss. food loss among all the processes in the food life
7Environ. Res. Lett. 16 (2021) 014024 Y Qin and A Horvath
Table 5. GHG emissions (in kg CO2 eq.), Ec , associated with one serving size of consumed avocados, celery, lemons, and strawberries
without considering food loss. Color bars denote the magnitudes of the numbers.
Phase Process Avocado Celery Lemon Strawberry
On-farm Food harvesting 0.021 0.0052 0.016 0.035
Packaging manufacturing 0.010 0.0045 0.0057 0.070
Farm-to-retail Farm-to-retail transportation 0.011 0.011 0.018 0.031
Farm-to-retail refrigeration 0.00038 0.00035 0.00060 0.0010
Retail Retail refrigeration 0 0.0032 0 0.0038
Consumer Consumer refrigeration 0 0.00074 0 0.0010
Packaging waste transportation 0.00010 0.000077 0.000082 0.00047
Packaging waste management −0.0033 −0.0018 −0.0028 −0.0078
Total 0.039 0.023 0.038 0.13
Table 6. GHG emissions (in kg CO2 eq.), El , associated with food loss of one serving size of consumed avocados, celery, lemons, and
strawberries. Color bars denote the magnitudes of the numbers. Note that the emissions of the transportation between retail and
consumer were not included in the result below, but the emissions from driving were compared with the total emissions (without
driving) in the latter part of the results section.
Phase Process Avocado Celery Lemon Strawberry
On-farm Food harvesting 0.0010 0.0030 0.00064 0.030
Waste transportation 0.000054 0.00064 0.000073 0.0027
On-farm food waste manage- 0.00023 0.0027 0.00030 0.011
ment
Farm-to-retail Food harvesting 0.0024 0.00070 0.0013 0.0055
Packaging manufacturing 0.0012 0.00061 0.00044 0.011
Farm-retail transporta- 0.0013 0.0015 0.0015 0.0050
tion + refrigeration
Waste transportation 0.00014 0.00016 0.00015 0.00056
Farm-to-retail food and pack- −0.0040 −0.0045 −0.0043 −0.015
aging waste management
Retail Food harvesting 0.0073 0.00079 0.0015 0.0090
Packaging manufacturing 0.0036 0.00069 0.00054 0.018
Farm-retail transporta- 0.0039 0.0017 0.0018 0.0082
tion + refrigeration
Retail refrigeration 0 0.00048 0 0.00096
Waste transportation 0.00041 0.00018 0.00018 0.00091
Retail food and packaging waste −0.012 −0.0051 −0.0052 −0.025
management
Consumer Food harvesting 0.010 0.0033 0.013 0.019
Packaging manufacturing 0.0050 0.0029 0.0045 0.038
Farm-retail transporta- 0.0055 0.0073 0.015 0.017
tion + refrigeration
Retail refrigeration 0 0.0020 0 0.0020
Consumer refrigeration 0 0.00047 0 0.00055
Waste transportation 0.00058 0.00075 0.0015 0.0019
Consumer food and packaging −0.0053 −0.0060 −0.012 −0.016
waste management
Total 0.022 0.014 0.020 0.13
cycle, contributing 51% emissions to the total emis- compost is then applied to soil) can store more
sions from lost strawberries. Because the food loss carbon than it emits to the atmosphere, and recycling
ratios at the consumer level are the highest among the of wastes can avoid emissions from raw material
food loss phases for avocados, celery, and lemons, the production.
emissions at the consumer level contribute the largest Figure 6 shows the total emissions associated
portion of the total emissions. The consumer level is with one serving size of consumed food under four
also the last phase, which means it cumulates all the scenarios: production, production and packaging,
emissions from the previous phases. Thus, the con- cradle to grave without food loss, and cradle to
sumer phase is the phase that contributes the most to grave with food loss. The emissions from produc-
the total emissions for one serving size of avocados tion and packaging include the emissions from pro-
(74%), celery (74%), and lemons (95%). Waste man- duction; the emissions from cradle to grave without
agement can lead to negative GHG emissions because food loss include the emissions from production
incineration can generate energy, composting (if the and packaging; and emissions from cradle to grave
8Environ. Res. Lett. 16 (2021) 014024 Y Qin and A Horvath
Figure 6. GHG emissions of one serving size of avocados, celery, lemons, and strawberries under four emission scenarios.
‘Production’ represents the emissions from on-farm production; ‘production and packaging’ represents the emissions from
on-farm production and packaging materials; ‘cradle to grave without food loss’ represents the emissions from on-farm
production, packaging materials, transportation, and refrigeration; ‘cradle to grave with food loss’ represents the emissions from
on-farm production, packaging materials, transportation, refrigeration, food and packaging waste management, and food loss.
Error bars represent 95% uncertainty ranges from Monte Carlo simulations.
Figure 7. GHG emissions of avocados, celery, lemons, and strawberries were based on California’s consumption in 2017 under
four emissions scenarios. ‘Production’ represents the emissions from on-farm production; ‘production and packaging’ represents
the emissions from on-farm production and packaging materials; ‘cradle to grave without food loss’ represents the emissions
from on-farm production, packaging materials, transportation, and refrigeration; ‘cradle to grave with food loss’ represents the
emissions from on-farm production, packaging materials, transportation, refrigeration, food and packaging waste management,
and food loss. Error bars represent 95% uncertainty ranges from Monte Carlo simulations.
with food loss include the emissions from cradle cradle-to-grave emissions by 93%, 62%, 56%, and
to grave without food loss. The results of the 95% 53% for strawberries, celery, avocados, and lemons,
uncertainty interval from the Monte Carlo simula- respectively. With the consideration of food loss,
tion are presented in the error bars in the figure. the total emissions of avocados, celery, lemons, and
The result of energy consumption and the uncer- strawberries for one serving size were found to be
tainty values are included the supplementary data 0.061, 0.038, 0.058, and 0.26 kg CO2 eq., respect-
(S7–S9). The emissions from food loss increase the ively. If we assume that the avocados and lemons are
9Environ. Res. Lett. 16 (2021) 014024 Y Qin and A Horvath
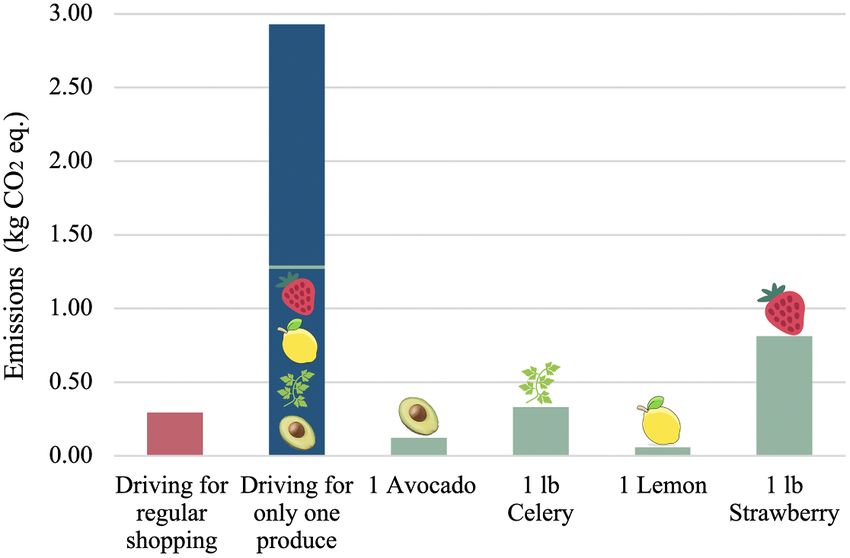
Figure 8. Comparison between the emissions of driving for shopping and cradle-to-grave emissions of one package size of
avocado, celery, lemon, and strawberry consumption, including food loss consideration.
refrigerated during storage at retail stores and homes, truck to represent the emissions of a typical passenger
the total emissions from cradle to grave with food vehicle in the United States [54]). The GHG emissions
loss consideration will increase by 5.8% and 8.7%, for one package of produce from a regular grocery
respectively. shopping trip were 0.29 kg CO2 eq., which is about
Figure 7 shows the GHG emissions from the con- the total emissions associated with two avocados. If
sumptions of the four produce in California. Con- the entire driving is for purchasing only one produce,
sidering California’s total population and per capita the emissions from driving amount to about 2.9 kg
consumption of the four produce [43], 158 000 tons CO2 eq., which exceeds the total emissions associated
of strawberries go to waste to fulfill the consump- with all four produce combined.
tion needs for strawberries just in California in a
year, equaling 1.1 billion serving sizes of strawberries. 5. Discussions and conclusions
1.2 billion serving sizes of celeries, 1.1 billion serving
sizes of avocados, and 590 million serving sizes of This study focused on the environmental impacts of
lemons. Indeed, 14% of the world’s population could produce in California, including food loss, but the
have a serving of strawberries just from the annu- results are applicable to other states in the United
ally wasted strawberries in California. The emissions States because the food loss ratios at farm-to-retail,
from the annual food loss of avocados, celery, lem- retail, and consumer levels represent U.S. averages,
ons, and strawberries in California are 24, 12, 12, and and the waste management data are also based on
76 000 tons of CO2 eq., respectively. a national model. A few factors would need to be
In our calculation of cradle-to-grave emissions of adjusted in an analysis for another state, including
food consumption, emissions associated with driving the transportation distances between farms and retail
from retail to home were not included. To compare points [59–61], the on-farm food loss ratios, and the
the total calculated emissions for the produce with the emissions associated with growing [62], harvesting,
emissions from driving to purchase them, we alloc- refrigeration [63] and waste management [64].
ated 10% of the emissions from driving to each food The food loss ratios vary from 50% to 64% for
item. We also calculated the emissions from driving the four high-value produce, and the differences are
when only one produce is purchased. largely influenced by the on-farm food loss ratios as
Figure 8 shows the emissions from driving asso- the consumer-level losses are similar. However, data
ciated with a regular shopping trip when multiple about on-farm food loss ratios are quite limited, and
items are purchased, driving only for one produce, only a few crops have on-farm food loss ratios due to
and the cradle-to-grave emissions of one package size the difficulties of tracking and measuring food losses
of the four produce, including food loss considera- in the field. Studies for all agricultural products and
tion. (The driving distance from home to the store a database focusing on on-farm food loss would be
and back was assumed to be 4.8 km each way, and necessary to understand comprehensively the envir-
we used the life-cycle emission factor of a light-duty onmental impacts associated with food loss.
10Environ. Res. Lett. 16 (2021) 014024 Y Qin and A Horvath
Our analysis extended the previous research on 1739676. Any opinions, findings, and conclusions or
the environmental impacts of high-value produce recommendations expressed in this material are those
including the farm-to-retail, retail, and consumer of the authors and do not necessarily reflect the views
phases and food loss consideration. Compared with of the National Science Foundation. The authors are
a previous study by Bell et al which focused on the thankful to Meghna Thomas for her help in data col-
environmental impacts from the production of the lection.
four produce [65], our study has found that the
total GHG emissions of avocados, celery, lemons, and ORCID iD
strawberries using conventional water were increased
by 180%, 630%, 290%, and 190%, respectively. Com- Yuwei Qin https://orcid.org/0000-0002-3467-
pared with the study by Qin and Horvath [66] which 0286
included impacts of production with newer data
and packaging materials, the emissions estimates in References
this study were increased by 96%, 290%, 170%, and
150% for avocados, celery, lemons, and strawberries, [1] Kantor L S, Lipton K, Manchester A and Oliveira V 1997
respectively. Clearly, food loss contributes to a stag- Estimating and addressing America’s food losses Food Rev.
20 2–12
gering proportion of environmental impacts.
[2] Lipinski B, Hanson C, Lomax J, Kitinoja L, Waite R and
When food is wasted after harvesting, packaging Searchinger T 2013 Reducing food loss and waste World
materials waste also increases. For example, GHG Resour. Inst. Work. Paper pp 1–40
emissions associated with packaging contribute 52% (https://www.academia.edu/download/34564759/WRI-
UNEP_Reducing_Food_Loss_and_Waste.pdf)
to the cradle-to-grave emissions (with the food loss
[3] Oelofse S H and Nahman A 2013 Estimating the magnitude
consideration) for strawberries. Although the recyc- of food waste generated in South Africa Waste Manag. Res.
ling rate of plastic containers has increased in recent 31 80–86
years, the recycling rate of plastic containers (13% [4] FAO 2017 FAOSTAT statistics database (FAO) (available at:
http://faostat.fao.org/)
in the United States) is still very low compared with
[5] Tilman D, Balzer C, Hill J and Befort B L 2011 Global food
paperboard containers’ recycling rate (73%) [57]. demand and the sustainable intensification of agriculture
Strategies to reduce packaging emissions can play an Proc. Natl Acad. Sci. 108 20260–4
important role in improving the overall sustainability [6] Gustavsson J, Cederberg C, Sonesson U, Van Otterdijk R and
Meybeck A 2011 Global food losses and food waste—extent,
of food consumption. Such strategies include using
causes and prevention (Rome: FAO) (available at:
less environmentally burdensome packaging materi- https://www.fao.org/3/a-i2697e.pdf)
als or simply less of them where feasible. [7] Gunders D and Bloom J 2017 Wasted: how America is losing
Several solutions can help reduce food loss and up to 40 percent of its food from farm to fork to landfill
(Natural Resources Defense Council New York) (available at:
mitigate emissions. Selection of fresh produce based
https://www.nrdc.org/sites/default/files/wasted-food-IP.pdf)
on quality, not on the appearance of fresh fruits [8] Kummu M, De Moel H, Porkka M, Siebert S, Varis O and
and vegetables, by the retailers and the consumers Ward P J 2012 Lost food, wasted resources: global food
could reduce shunned food. A recent study found supply chain losses and their impacts on freshwater,
cropland, and fertiliser use Sci. Total Environ. 438 477–89
that about 20% of the harvest products are rejec-
[9] Hall K D, Guo J, Dore M and Chow C C 2009 The
ted at the farm due to imperfect ‘cosmetic’ appear- progressive increase of food waste in America and its
ance [67]. Approaches to reducing the food loss due environmental impact PloS One 4 e7940
to imperfect appearance include discounting cosmet- [10] FAO 2013 Food Wastage Footprint: Impacts on Natural
Resources (FAO)
ically imperfect produce and secondary processing
[11] Heller M C and Keoleian G A 2015 Greenhouse gas emission
those imperfect produce into juice or other processed estimates of US dietary choices and food loss J. Ind. Ecol.
food items or ingredients. Rational purchasing—only 19 391–401
purchasing the amount of food needed—is another [12] Porter S D, Reay D S, Bomberg E and Higgins P 2018
Avoidable food losses and associated production-phase
way to reduce food loss and save money. Future stud-
greenhouse gas emissions arising from application of
ies should also explore how different packaging tech- cosmetic standards to fresh fruit and vegetables in Europe
niques and transportation distances influence food and the UK J. Clean. Prod. 201 869–78
loss. [13] ReFED 2016 A roadmap to reduce US food waste by 20
percent Rethink Food Waste through Economics and Data
(available at: https://www.refed.com/downloads/
Data availability statement ReFED_Report_2016.pdf)
[14] Parfitt J, Barthel M and Macnaughton S 2010 Food waste
All data that support the findings of this study are within food supply chains: quantification and potential for
included within the article (and any supplementary change to 2050 Philos. Trans. R. Soc. B 365 3065–81
[15] Corrado S, Ardente F, Sala S and Saouter E 2017 Modelling
information files).
of food loss within life cycle assessment: from current
practice towards a systematisation J. Clean. Prod. 140 847–59
Acknowledgments [16] Shafiee-Jood M and Cai X 2016 Reducing food loss and
waste to enhance food security and environmental
sustainability Environ. Sci. Technol. 50 8432–43
This material is based upon work supported by [17] Wang K and Nakakubo T 2020 Comparative assessment of
the National Science Foundation under Grant No. waste disposal systems and technologies with regard to
11Environ. Res. Lett. 16 (2021) 014024 Y Qin and A Horvath
greenhouse gas emissions: a case study of municipal solid https://www.ers.usda.gov/publications/pub-
waste treatment options in China J. Clean. Prod. 260 120827 details/?pubid=44309)
[18] Ribeiro A P, Rok J, Harmsen R, Carreón J R and Worrell E [37] Buzby J C, Hyman J, Stewart H and Wells H F 2011 The
2019 Food waste in an alternative food network—a value of retail- and consumer-level fruit and vegetable losses
case-study Resour. Conserv. Recycl. 149 210–9 in the United States J. Consum. Aff. 45 492–515
[19] Djekic I, Miloradovic Z, Djekic S and Tomasevic I 2019 [38] Kader A A 2004 Increasing food availability by reducing
Household food waste in Serbia—attitudes, quantities and postharvest losses of fresh produce V Int. Postharvest Symp.
global warming potential J. Clean. Prod. 229 44–52 vol 682 pp 2169–76
[20] Moult J A, Allan S R, Hewitt C N and Berners-Lee M 2018 [39] Brancoli P, Rousta K and Bolton K 2017 Life cycle assessment
Greenhouse gas emissions of food waste disposal options for of supermarket food waste Resour. Conserv. Recycl. 118 39–46
UK retailers Food Policy 77 50–58 [40] Moreno L C, Tran T and Potts M D 2020 Consider a broccoli
[21] Cerutti A K, Beccaro G L, Bruun S, Bosco S, Donno D, stalk: how the concept of edibility influences quantification
Notarnicola B and Bounous G 2014 Life cycle assessment of household food waste J. Environ. Manage. 256 109977
application in the fruit sector: state of the art and [41] Hanson C, Lipinski B, Robertson K, Dias D, Gavilan I,
recommendations for environmental declarations of fruit Gréverath P, Ritter S, Fonseca J, VanOtterdijk R and
products J. Clean. Prod. 73 125–35 Timmermans T 2016 Food Loss and Waste Accounting and
[22] Maraseni T N, Cockfield G, Maroulis J and Chen G 2010 An Reporting Standard (World Resources Institute)
assessment of greenhouse gas emissions from the Australian [42] Östergren K, Gustavsson J, Bos-Brouwers H, Timmermans T,
vegetables industry J. Environ. Sci. Health B 45 578–88 Hansen O-J, Møller H, Anderson G, O’Connor C, Soethoudt
[23] Khoshnevisan B, Rafiee S and Mousazadeh H 2013 H and Quested T 2014 FUSIONS definitional framework for
Environmental impact assessment of open field and food waste Europäische Union (available at:
greenhouse strawberry production Eur. J. Agron. https://www.eu-fusions.org/phocadownload/Publications/
50 29–37 FUSIONS%20Definitional%20Framework%20for%20Food
[24] Cerutti A K, Galizia D, Bruun S, Mellano G M, Beccaro G L %20Waste%202014.pdf)
and Bounous G 2011 Assessing environmental sustainability [43] USDA Economic Research Service 2019 Loss-adjusted food
of different apple supply chains in Northern Italy Towards availability (LAFA) data system (USDA) (available at:
Life Cycle Sustainability Management (Berlin: Springer) https://www.ers.usda.gov/data-products/food-availability-
pp 341–8 per-capita-data-system/loss-adjusted-food-availability-
[25] Knudsen M T, de Almeida G F, Langer V, de Abreu L S and documentation/)
Halberg N 2011 Environmental assessment of organic juice [44] Campbell D and Munden-Dixon K 2018 On-farm food loss:
imported to Denmark: a case study on oranges (Citrus farmer perspectives on food waste J. Extension 56 3
sinensis) from Brazil Org. Agric. 1 167 [45] Kantor L S 1998 A Dietary Assessment of the US Food
[26] Astier M, Merlín-Uribe Y, Villamil-Echeverri L, Garciarreal Supply: Comparing per Capita Food Consumption with
A, Gavito M E and Masera O R 2014 Energy balance and Food Guide Pyramid Serving Recommendations. (US
greenhouse gas emissions in organic and conventional Department of Agriculture, Economic Research Service)
avocado orchards in Mexico Ecol. Indic. 43 281–7 (https://doi.org/10.22004/ag.econ.34079)
[27] Pergola M, D’Amico M, Celano G, Palese A, Scuderi A, [46] Bolda M P, Tourte L, Murdock J and Summer D A 2016
Di Vita G, Pappalardo G and Inglese P 2013 Sustainability Sample costs to produce and harvest strawberries: central
evaluation of Sicily’s lemon and orange production: an Coast Region, Santa Cruz and Monterey Counties Univ.
energy, economic and environmental analysis J. Environ. Calif. Agric. Nat. Resour. (available at: https://coststudyfiles.
Manage. 128 674–82 ucdavis.edu/uploads/cs_public/e7/6d/e76dceb8-f0f5-4b60-
[28] Williams H and Wikström F 2011 Environmental impact of bcb8-76b88d57e272/strawberrycentralcoast-2016-final2-5-
packaging and food losses in a life cycle perspective: a 1-2017.pdf)
comparative analysis of five food items J. Clean. Prod. [47] O’Connell N V, Kallsen C E, Klonsky K M and Tumber K P
19 43–48 2015 Sample costs to establish an orchard and produce
[29] Wikström F and Williams H 2010 Potential environmental lemons Univ. Calif. Agric. Nat. Resour. (available at:
gains from reducing food losses through development of https://coststudyfiles.ucdavis.edu/uploads/cs_public/a1/
new packaging—a life-cycle model Packag. Technol. Sci. 39/a139af36-5c70-48ec-8367-bc534c314eb3/lemons-vs-
23 403–11 2015.pdf)
[30] Papargyropoulou E, Lozano R, Steinberger J K, Wright N [48] Takele E, Bender G and Vue M 2011 Avocado sample
and Bin Ujang Z 2014 The food waste hierarchy as a establishment and production costs and profitability analysis
framework for the management of food surplus and food for San Diego and Riverside Counties Univ. Calif. Agric. Nat.
waste J. Clean. Prod. 76 106–15 Resour. (available at: https://coststudyfiles.ucdavis.edu/
[31] Beausang C, Hall C and Toma L 2017 Food waste and losses uploads/cs_public/53/39/5339d98f-f575-4eab-8482-
in primary production: qualitative insights from horticulture b3162d71a8fd/avocadosdrorganic_reports2011.pdf)
Resour. Conserv. Recycl. 126 177–85 [49] Takele E, Daugovish O and Vue M 2013 Costs and
[32] Johnson L K, Dunning R D, Bloom J D, Gunter C C, Boyette profitability analysis for celery production in the Oxnard
M D and Creamer N G 2018 Estimating on-farm food loss at Plain, Ventura County, 2012-2013 Univ. Calif. Agric. Nat.
the field level: a methodology and applied case study on a Resour. (available at: https://coststudyfiles.ucdavis.edu/
North Carolina farm Resour. Conserv. Recycl. 137 243–50 uploads/cs_public/3c/da/3cda417c-e970-4882-be23-
[33] Gillman A, Campbell D C and Spang E S 2019 Does on-farm f97b785acb3d/costs-and-profitability-analysis-for-celery-
food loss prevent waste? insights from California produce production-in-the-oxnard-plain-ventura-county-2012-
growers Resour. Conserv. Recycl. 150 104408 13.pdf)
[34] Baker G A, Gray L C, Harwood M J, Osland T J and Tooley J [50] Taptich M N and Horvath A 2014 Bias of averages in
B C 2019 On-farm food loss in northern and central life-cycle footprinting of infrastructure: truck and bus case
California: results of field survey measurements Resour. studies Environ. Sci. Technol. 48 13045–52
Conserv. Recycl. 149 541–9 [51] Fricke B and Becker B 2010 Energy use of doored and open
[35] Buzby J C and Hyman J 2012 Total and per capita value of vertical refrigerated display cases Int. Refrigeration and Air
food loss in the United States Food Policy 37 561–70 Conditioning Conf. (available at:
[36] Buzby J C, Wells H F, Axtman B and Mickey J 2009 http://docs.lib.purdue.edu/iracc/1154)
Supermarket loss estimates for fresh fruit, vegetables, meat, [52] U.S. Environmental Protection Agency 2016 Documentation
poultry, and seafood and their use in the ERS loss-adjusted for greenhouse gas emission and energy factors used in the
food availability data (USDA) (available at: waste reduction model (WARM) (Washington, DC: EPA,
12Environ. Res. Lett. 16 (2021) 014024 Y Qin and A Horvath
Office of Resource Conservation and Recovery) (available at: [60] Taptich M and Horvath A 2015 Freight on a low-carbon diet:
https://www.epa.gov/warm/documentation-waste- accessibility, freightsheds, and commodities Environ. Sci.
reduction-model-warm) Technol. 49 11321–8
[53] California Department of Food and Agriculture 2018 [61] Facanha C and Horvath A 2005 Environmental asses-
California Agricultural Statistics Review 2017–2018 State of sment of logistics outsourcing J. Manage. Eng.
California (available at: https://www.cdfa.ca.gov/ 21 27–37
statistics/PDFs/2017-18AgReport.pdf) [62] Stokes-Draut J, Taptich M, Kavvada O and Horvath A 2017
[54] Nahlik M J, Kaehr A T, Chester M V, Horvath A and Taptich Evaluating the electricity intensity of evolving water supply
M N 2016 Goods movement life cycle assessment for mixes: the case of California’s water network Environ. Res.
greenhouse gas reduction goals J. Ind. Ecol. 20 317–28 Lett. 12 114005
[55] Energy Star 2020 Certified residential refrigerators US [63] Cicas G, Hendrickson C T, Horvath A and Matthews H S
Environmental Protection Agency and US Department of 2007 A regional version of a U.S. economic input-output
Energy (available at: https://www.energystar.gov/ life-cycle assessment model Int. J. Life Cycle Assess.
productfinder/product/certified-residential- 12 365–72
refrigerators/results) [64] Vergara S, Damgaard A and Horvath A 2011 Boundaries
[56] Tonini D, Albizzati P F and Astrup T F 2018 Environmental matter: greenhouse gas emission reductions from alternative
impacts of food waste: learnings and challenges from a case waste treatment strategies for California’s municipal solid
study on UK Waste Manage. 76 744–66 waste Resour. Conserv. Recycl. 57 87–97
[57] U.S. Environmental Protection Agency 2019 Advancing [65] Bell E M, Stokes-Draut J R and Horvath A 2018
sustainable materials management: 2017 fact sheet EPA Environmental evaluation of high-value agricultural
(available at: https://www.epa.gov/sites/production/ produce with diverse water sources: case study from
files/2019-11/documents/2017_facts_and_figures_ Southern California Environ. Res. Lett. 13 025007
fact_sheet_final.pdf) [66] Qin Y and Horvath A 2020 Use of alternative water
[58] U.S. Department of Agriculture, Agricultural Research sources in irrigation: potential scales, costs, and environ-
Service 2019 FoodData Central (USDA) (available at: mental impacts in California Environ. Res. Commun.
https://fdc.nal.usda.gov) 2 055003
[59] Bell E M and Horvath A 2020 Modeling the carbon footprint [67] de Hooge I E, van Dulm E and van Trijp H C 2018 Cosmetic
of fresh produce: effects of transportation, localness, and specifications in the food waste issue: supply chain
seasonality on US orange markets Environ. Res. Lett. considerations and practices concerning suboptimal food
15 034040 products J. Clean. Prod. 183 698–709
13You can also read