Agriculture and deforestation - The EU Common Agricultural Policy, soy, and forest destruction - Fern
←
→
Page content transcription
If your browser does not render page correctly, please read the page content below
Agriculture and
deforestation
The EU Common Agricultural
Policy, soy, and forest destruction

Proposals for Reform

SUMMARY
Agriculture and deforestation
The EU Common Agricultural Policy, soy, and forest destruction
Proposals for Reform

Authors: Mark Gregory, Nicole Polsterer

Editor: Ed Fenton

Design: Steve Paveley

This summary document has been written by Fern in-house. It is based on a more extensive study
commissioned by Fern and written by Adrian Muller and Lin Bautze of the Research Institute of
Organic Agriculture (FiBL), Switzerland.

The full report is available at www.fern.org/CAPreform

This publication is printed on 100 per cent recycled paper.

This publication has been produced with the assistance of the European Union, the UK
Department for International Development, and the Ford Foundation. The contents of this
publication are the sole responsibility of Fern and can in no way be taken to reflect the
views of the European Union, the UK Government or the Ford Foundation.

May 2017

Cover photo: © Daniel Beltra /Greenpeace
The EU Common Agricultural Policy, soy, and forest destruction

1. Introduction

The EU has made multiple time-bound commitments to ending the region’s role in global
deforestation. The pledge first appeared in a policy document on climate change in 2008 (which set a
target of halving deforestation by 2020 and eliminating it by 2030); it was subsequently reinforced by
the EU’s decision to sign up for the New York Declaration on Forests at the UN climate summit in
2014, and its endorsement of UN Sustainable Development Goal number 15.1 2 3

The biggest cause of forest loss – accounting for around 70 per cent – is agricultural deforestation,
notably for beef, soy, palm oil and commercial timber.4 Other crops including cocoa and rubber are
also significant causes of forest destruction.

Soy ranks as the second largest agricultural driver of deforestation after cattle products. According to
a study for the European Commission, soy expansion was responsible for 19 per cent of global forest
loss linked to the growing of crops between 1990 and 2008, along with nearly half (47 per cent) of the
deforestation embodied in products imported into the European Union.5

This report looks at the linkages between the EU Common Agricultural Policy (CAP) and the
expansion of soybean cultivation, which has been the largest source of agricultural deforestation
over which the EU has a direct influence.

The EU is involved mainly because European farmers rely on imported soy from Brazil, Argentina and
Paraguay to use as animal feed, mostly for pigs and chicken but also for cattle, other farm animals
and farmed fish. Of all the soy meal consumed in the EU, 83 per cent goes in concentrate feed for pigs
and poultry.6

As the EU embarks on another round of CAP reform – intended to shape the policy framework after
2020 – this report assesses the extent to which extent the CAP is driving deforestation. It also looks at
how changes to the CAP and some other policies might actively reduce the deforestation footprint of
EU agriculture.

                                                                                                        3
The EU Common Agricultural Policy, soy, and forest destruction

2. The CAP and the GATT

The CAP and its impact on soy imports

The Common Agricultural Policy, founded in 1962, remains a central feature of the EU. It costs more
than 50 billion euros a year to run, consumes 40 per cent of the EU budget, and has shaped European
farming for more than half a century. At the same time, due to the EU’s significance as an importer
and exporter of farm products, the CAP has had – more by accident than design – a profound impact
on agriculture in many other parts of the world, including places where agricultural expansion has
been and continues to be a big driver of deforestation.

The current version of the CAP was put in place in 2013, with three ultimate objectives: enhanced
competitiveness, improved sustainability and greater effectiveness. The CAP consists of two principal
elements, referred to as ‘pillars’ in EU terminology.7

Pillar one covers various direct payments to farmers and forms of financial assistance classified as
market support measures. The main direct payment is a basic income support, calculated according
to the number of hectares farmed. In addition, farmers may qualify for direct payments linked to the
type of farm and for achieving specified goals. For example, young farmers and farmers in mountain
regions get extra help, and there are ‘green’ payments for agricultural practices seen as beneficial to
the climate or environment (adopting these practices has been a mandatory condition of assistance
under the CAP since 2013). Market support measures covered under Pillar one include, for example,
payments to farmers hit by a sudden drop in crop prices and financial help to build storage facilities,
enabling farmers to wait for the best prices before selling their products. Pillar two focuses more
generally on supporting rural development. The two-pillar approach was not new in 2013. It dates
back to the Agenda 2000 reforms adopted at the turn of the century.

The current version of the CAP represents the latest step in a reform process that has over time
radically changed the way financial help to EU agriculture is given. The original policy created a
system based on payments for producing particular agricultural products, backed up by guaranteed
prices for those products. More recent iterations of the CAP have steadily reduced the link between
production and payments to farmers – a process known as decoupling.

At the moment, the CAP has a budget of around EUR 55 billion a year (at 2011 values), of which about
70 per cent goes on decoupled (i.e. not linked to specific products) direct payments to farmers.8
These direct payments include around EUR 12 billion a year reserved for ‘greening’ practices
(activities seen as having climate or environmental benefits).9 Greening measures come under three
headings: crop diversification, maintaining permanent grassland helping to provide forage for
ruminants (animals that can eat grass) and cultivating ecological focus areas, which are intended to
help maintain or increase biodiversity.

It is largely unknown whether the CAP 2013 reforms will achieve their environment and climate aims.
The evidence so far is not encouraging. For example, research suggests that crop diversification
measures will only affect 2 per cent of the EU’s arable area (because most EU farmers already cultivate

4
The EU Common Agricultural Policy, soy, and forest destruction

three or more crops), while modelling studies indicate that the introduction of ecological focus areas
may only increase species diversity on farmland by an additional 1 per cent.10

Debate has already begun on the next round of reform, which will determine what the CAP will look
like after 2020. Some are calling for very radical changes, ranging from scrapping the CAP altogether
to broadening its focus to cover the whole area of rural development (as opposed to just agriculture),
or the entire food system, in which case it would become more of a Common (Sustainable) Food
Policy. Others want the CAP to evolve further along the two pillar approach with decoupled direct
payments remaining in place, further cuts in coupled payments linked to production, and greater
emphasis on the greening component in financial assistance given to farmers. A mid-term review is
due by the end of 2018.

The future shape of the CAP is relevant to soy imports from outside the EU because it has a major
influence on the behaviour of farmers within the EU and on the markets they supply within the EU,
which in turn affects what food and feed products the EU imports from abroad. Briefly (more details
are set out in the full report), it can be said that past iterations of the CAP have tended to encourage
EU farmers to produce meat and to a lesser extent to produce grain. In contrast, the CAP has
provided relatively few incentives for local production of protein crops, such as soy, with the result
that these products are more likely to be imported from elsewhere. In the case of soy, this means
South America, where much of the crop is grown in places challenged by deforestation.

The GATT and its impact on soy imports

Parallel to the establishment of the CAP in the early 1960s, negotiations under the Dillon Round of
the General Agreement on Tariffs and Trade (GATT) in 1962 led to substantial cuts in the level of
import tariffs set by the EU on protein-rich non-grain feed for the livestock sector (including

                                                                                                           5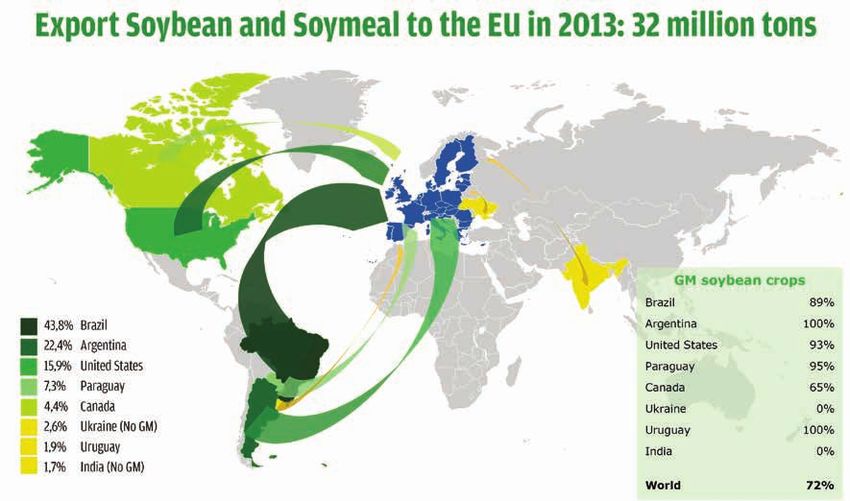
The EU Common Agricultural Policy, soy, and forest destruction

soybeans and other oilseeds and products). These products were allowed to enter EU Member States
almost duty-free on the grounds that they were essential for the EU livestock sector and did not
compete with EU production. The changes in the tariff regime created incentives for farmers to
import soy meal and other non-grain concentrate feed products from countries outside the EU, while
their own (at that time) subsidised grain production was sold for export.11 12

    Key points – the GATT and EU soy imports

    •   In the 1960s, the Dillon Round of the General Agreement on Tariffs and Trade (GATT) led to
        almost duty-free imports into EU Member States of protein-rich non-grain feed for the
        livestock sector.13 14

    •   Farmers imported non-grain concentrate feed products and flooded the international markets
        with subsidised grain production thereby depressing prices abroad.15 16

    •   In the 1980s, the CAP price support scheme of guaranteed minimum prices kept grain prices
        two to three times higher for EU farmers than world market prices.17

    •   In 2011, the EU abolished the protein premium, a direct payment of about EUR 56 per hectare
        for crops such as peas, field beans and sweet lupins.18 However from 2014 Member States have
        been allowed to issue ‘Voluntary Coupled Payments’ to specific sectors, which amounted to
        443 million euros for protein crops in 2015.19

However, the impact of the CAP and international trade rules are not the only reasons that EU farmers
tend to rely on imported soy to feed their livestock. The EU ban since 2001 on using meat and bone
meal in animal feed is also a factor. This came as a result of the BSE (bovine spongiform
encephalopathy, also known as mad cow diesease) crisis in which these feeds were identified as a
source of infection. The ban led to the use of an additional 1.5 million tons of soybean meal to
substitute for meat and bone meal.20

6
The EU Common Agricultural Policy, soy, and forest destruction

3. EU consumption of soy

EU farming is strong on meat and dairy production. In 2013, animal products accounted for more
than 40 per cent of the value of all farm products in the EU.21 One of the major inputs is concentrate
feed, i.e. protein- and energy-rich products such as soy or cereals. Pigs and poultry are wholly reliant
on this type of food. However, even ruminants reared in the EU (e.g. beef cattle and dairy cows),
which could thrive on just grass and forage, have an element of feed concentrates in their diets, in
order to obtain high yields and rapid weight gain so as to meet the existing demand for animal
products. Current high yields in ruminant milk and meat production are possible only when there is a
significant proportion of these concentrates in feeding rations.

 Key points – EU soy consumption

 •   Soy is a major input for concentrates used in animal feed.

 •   70 per cent of the protein feed used in the EU is imported.22 97 per cent of the soy used in
     feeds in the EU is imported.23

 •   83 per cent of soy meal in the EU is for concentrate feed for pigs and poultry.24

 •   Soy meal makes up more than 35 per cent of the content of concentrates fed to broiler
     chickens.25

Animal protein makes up about 60 per cent of human diets in the EU. Consumption of animal
products in the EU is currently quite high on average, but differs widely between countries, with
annual per capita meat consumption ranging from 13 to 26 kg for beef, for example, or from 28 to
60 kg for pork and 15 to 28 kg for poultry.26 27 Countries with an unusually high concentration of meat
in the diet include Austria, Luxembourg and Spain, while the data suggest that consumers in
Bulgaria, Slovakia and Romania eat less meat than the EU average (see Figure 1).

There has been a significant change in European eating habits in recent years. Consumption of pork
and poultry (mostly chicken) has grown much faster than demand for meat and dairy products
produced from ruminant animals (e.g. beef). This has led to increased demand for high energy
concentrate feed relative to grassland-based fodder.28Soybean meal is a commonly used concentrate
feed, because it is relatively easy to crop under a wide range of climatic and environmental
conditions. It also contains more protein than other feed crops. Most of the soybean meal used within
the EU goes to the pig and poultry sectors. While some soy is grown locally, the vast bulk of EU
consumption is supplied by imports.29

                                                                                                       7
The EU Common Agricultural Policy, soy, and forest destruction
Table 1: Soybean meal needed for the EU-27 consumption of different types of livestock
products, 2007
Livestock product Total Soy meal Soy meal
consumption per unit needed
1,000 tonnes 1,000 tonnes kg/person
Beef and veal 8,704 232 grams/kg 2,020 4.1
Milk 39,015 21 grams/litre 806 1.6
Pork 20,693 648 grams/kg 13,416 27.1
Poultry meat 10,641 967 grams/kg 10,294 20.8
Eggs 131,697 32 grams/egg 4,212 8.5
Cheese 8,070 186 grams/kg 1,500 3.0
Other products & 3,586 7.2
exports**
Total 35,834 72.4
*Milk in million litres and eggs in million eggs. ** Other products: livestock products from all other animals (sheep, goats, ducks, etc.).
Exports: all types of livestock products exported outside the EU-27.
Source: Van Gelder et al. (2008, page 8)
Producing concentrate feed, depending on how its constituent crops are grown, can have serious
negative impacts on the environment. One such impact, given the EU’s dependence on imports, is
deforestation abroad. The effects can be especially serious in tropical regions with consequences for
biodiversity, greenhouse gas emissions, soil erosion and local communities. The impacts resulting
from high volume of imports into the EU of animal feed in the form of soybeans cropped on recently
deforested areas in Brazil, Argentina and Paraguay are a prime example.30 31
Figure 1: Animal products – per capita supply for all EU Member States, 2011
Meat supply EU Member States (kg /per capita /year)*
120
100
80
60
40
20
0
Lithuania
Portugal
Netherlands
United Kingdom
Luxembourg
Bulgaria
Italy
Romania
Denmark
Latvia
Spain
France
Belgium
Hungary
Croatia
Slovenia
Malta
Czech Republic
Estonia
Slovakia
Germany
Ireland
Sweden
Cyprus
Poland
Finland
Greece
Austria
Pig Poultry Bovine Mutton & Goat
Source: FAOSTAT (2016b)
* Meat supply is the domestically available quantity of meat, which is production plus imports minus exports plus stock changes. This figure is
readily available from FAOSTAT. The difference to consumption is food wastage and other losses along the value chain.
8
The EU Common Agricultural Policy, soy, and forest destruction

EU soy imports from forest risk countries Brazil, Argentina and Paraguay

While the EU produces most (90 per cent) of the animal products it consumes, its self-sufficiency in
animal feed is very low. 70 per cent of the protein feed for animals reared in the EU is imported.32 As
described earlier, the CAP and GATT rules on international trade have led to disincentives for
European farmers to fill this production gap with protein crops grown locally. As for soybeans, only
about three per cent of soybeans used as feed concentrate is produced within the EU. About half of
all EU imports of protein crops for feedstuffs come from Brazil and Argentina.33

Figure 2: Soybean and soybean product exports to the EU

(This is a modified version of a table that appeared in: EUROPEAN COMMISSION 2015. GMOs: Commission’s proposal on Food/Feed.
ec.europa.eu/food/plant/docs/20150422_plant_gmo_new_authorisation_gmo_food_feed_proposal_en.pdf

Soy is the biggest source of protein feed imported to support meat and dairy production in the EU. It
enters the EU in various forms, including soybeans and soymeal, both of which may be further
processed in the EU.

The three major source countries for soybeans and soymeal coming into the EU are Brazil, Argentina
and the USA, followed by Paraguay (see Figure 2). Imports of soybeans and soymeal from South
America account for nearly three quarters of total EU soy imports.34 In passing, it is worth noting that
the EU is the only major market that demands non-genetically modified soy. Genetically modified
varieties account for nearly three quarters of global soybean output.

Analysis of FAOSTAT data suggests that for the EU to become self-sufficient in soy an additional 12–13
million hectares of farm land in the EU would need to be used for soy cultivation – more than 10 per
cent of the total EU arable land area. Instead EU demand is mostly met by soy grown on land in South
America. According to our analysis, it requires 5.2 million hectares of land in Brazil, 2.7 million
hectares in Argentina and 0.9 million hectares in Paraguay to cultivate the soy these countries export
to the EU. In total this is an area about the size of Austria.

The amount of potential leverage the EU has over deforestation caused by soy expansion in South
America is linked to its importance as a market relative to other markets for the region’s soy. By this

                                                                                                                           9
The EU Common Agricultural Policy, soy, and forest destruction
measure, the EU emerges as a significant but not dominant player. Analysis of 2016 FAOSTAT data
suggests that soy exports to the EU accounted for around 17 per cent of total soy production in Brazil,
14 per cent of production in Argentina and 26 per cent of production in Paraguay.
While soy imports for animal feed are the most important element in the potential deforestation
impact of EU livestock production and consumption, they are not the only factor. The EU is not wholly
self-sufficient in meat and dairy products. In 2011–13 imports were equivalent to about 15 per cent of
domestic production for beef and veal, 22 per cent for poultry and 12–17 per cent for pig meat. For
eggs and fresh milk the figures were 1 per cent and 5 per cent respectively.35 Beef imports in
particular may make a significant contribution to the EU’s deforestation footprint.
Key points – EU soy imports from South America
• 73 per cent of EU soy imports come from Brazil, Argentina and Paraguay.36
• 44 per cent of the total is from Brazil, accounting for 4.8 million hectares.37
• The share of soy quantity exported to the EU is highest in Paraguay (26 per cent).38
• Major importers and traders in the EU are the Netherlands, Germany, France, Spain and Italy.39
The Netherlands has a strong trade function for soybeans and soybean meal in the EU,
exporting mainly to Germany, Belgium and the UK (while Germany exports mainly to the
Czech Republic, Poland and Denmark). Belgium also re-exports around 50 per cent of
soybeans and soymeal.
Table 2: Soybean export quantities and shares in EU imports, 2013
Exporter Total soya Quantity Quantity % of Area needed Yield (t/ha)
production exported exported to EU soy to produce (average
(Mt) to the EU the EU (% imports the soy that 2010-2014,
(Mt) production) is exported FAOSTAT)
to the EU
(million ha)
Brazil 81.7 14 17% 44% 4.8 mln ha 2.9
Argentina 49.3 7 14% 22% 2.7 mln ha 2.6
US 91.4 5.1 6% 16% 1.7 mln ha 2.9
Paraguay 9.1 2,4 26% 7% 0.9 mln ha 2.6
Canada 5.4 1.3 24% 4% 0.5 mln ha 2.9
Ukraine 2.8 1 36% 3% 0.5 mln ha 1.9
Yields: derived by summing production over 5 years and then dividing by the sum of the areas over the same 5 years.
Source: Cuypers et al. (2013), FAOSTAT (2016)
Deforestation in countries that export soy to the EU
Deforestation due to agriculture has many causes. The most direct driver is the profit per hectare that
can be obtained by converting forest land for other uses. The greater the profit that can be made
from clearing forest, the greater are the incentives to do so, which explains why higher crop yield
increases can lead to increased deforestation even though existing agricultural land is used more
10The EU Common Agricultural Policy, soy, and forest destruction
efficiently.39 If higher yields drive up the profitability of crop growing, in areas where land can easily
be cleared, this can lead to increased deforestation, as concentrate feed production becomes more
competitive in these areas, by comparison with other areas where deforestation may not be an issue.
Thus the production and demand for animal products in the EU, as well as global trade
developments, can result in a situation where forest clearing for soybean production for exports to
the EU becomes a profitable activity, leading to increased deforestation.
A second key driver of deforestation is infrastructure development, predominantly road-building.41
Where forest areas become more easily accessible, the costs of forest clearance, cropping the land
and marketing the products all decrease, thus increasing incentives for deforestation (again because
of increased profits per hectare).
Other causes of deforestation include the indirect effects of land use change not immediately
associated with forest loss.42 Converting pasture to soy cultivation in parts of Brazil means less room
for cattle which can lead to deforestation to create new pasture for cattle somewhere else; in other
words displaced deforestation.
Policy-related and institutional factors also play a major role in deforestation. For example, badly
designed regulation can create perverse incentives to cut down forests (e.g. support payments that
actively promote the growing of crops associated with forest loss). Similarly, lack of secure tenure
rights for communities, inadequate regulation to protect forests and/or poor implementation of what
may look like good regulation on paper can also lead to deforestation.43 44 45
11The EU Common Agricultural Policy, soy, and forest destruction
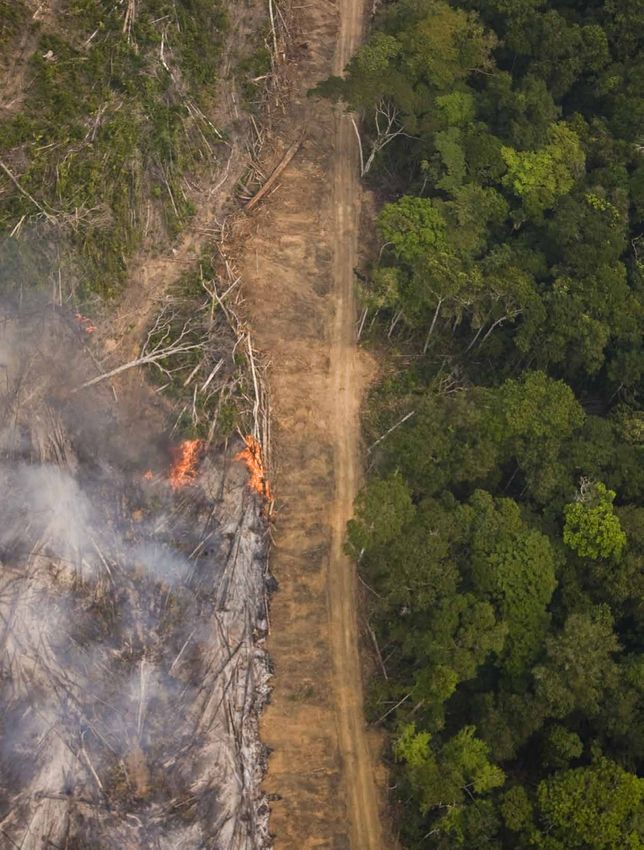
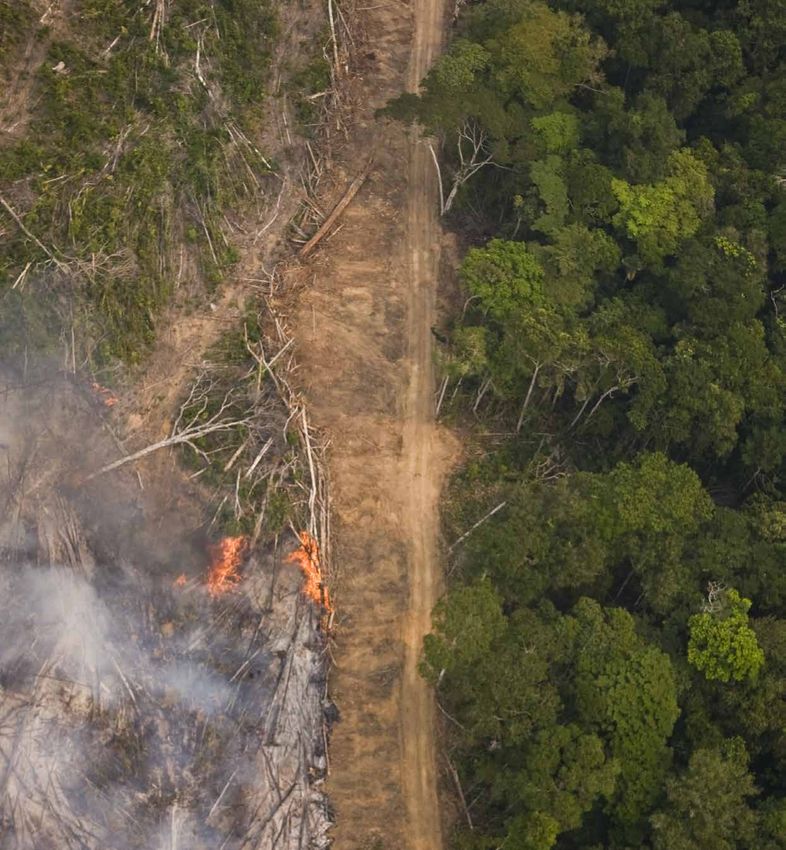
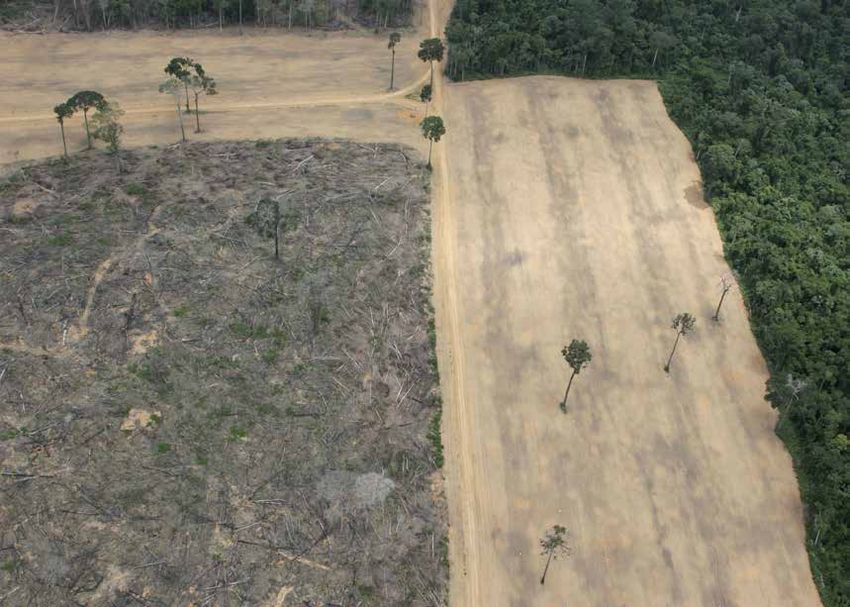
Illegal deforestation in the Amazon
Credit : © Greenpeace / Daniel Beltrá
A study published in 2016 estimated that more than a third of the soy imported into the EU from
Brazil came from areas of high deforestation risk.46
Discussion of the CAP and soy in South America should be seen in the wider context of the overall
deforestation footprint of EU consumption of agricultural products imported from parts of the world
where forest destruction is a concern. According to a 2013 study for the European Commission, EU
crop imports were responsible for around 7.4 million hectares of deforestation between 1990 and
2008, while the deforestation embodied in crop and livestock imports combined amounted to 8.7
million hectares in this period. The largest share of the deforestation attributed to crop imports in the
EU is derived from oil crops, mainly soy. Thus, based on the correlation between deforestation and
cropping areas described above, soybean cakes and soybeans were responsible for 60 per cent of
deforestation linked to EU crop imports. The study estimated that EU consumption of agricultural
products accounted for about 7 per cent of total global deforestation from all causes over the period
1990–2008.47
Key points – deforestation in countries that export soy to the EU
• In Brazil, the overall rate of deforestation was about 80 per cent lower in 2013 than its 2004
peak.48
• But deforestation in the Amazon has begun to climb rapidly again, with the rate of
deforestation 29 per cent higher in 2016 than 2015, and 24 per cent higher in 2015 than 2014.49
• Leakage effects from the Soy Moratorium, which only applies to the Amazon, may be
displacing soy production to other regions without an overall reduction in land clearing.50 51
• In Argentina and Paraguay, deforestation rose from 0.2m ha/year before 2000 to about 0.4m
ha/year since the mid-2000s.52
12The EU Common Agricultural Policy, soy, and forest destruction
The same 2013 study analysed how the embodied deforestation of the EU27 may develop in the
future. Based on the assumption that the EU population will slightly increase and that consumption
patterns do not change, by 2030 an additional 3–4 million hectares of agricultural land will be
needed to meet EU demand. Of course there is no guarantee that meat-eating habits will remain the
same as now. The study found that if consumers across the EU were to move to an Austrian diet –
highly meat concentrated – an additional 16 million hectares of agricultural land would be needed to
meet demand, i.e. almost 10 per cent of the current agricultural area in the EU of about 175 million
hectares. On the other hand, if the EU as a whole adopted Bulgarian tastes – a country with currently
low per capita meat consumption – the amount of land required to meet demand would actually fall
by 40 million hectares (i.e. almost minus 25 per cent), and a fully vegetarian diet would lead to a
reduction by 55 million hectares, i.e. by about a third.53
Figure 3: Crops and countries of origin for deforestation embodied in EU27 crop imports
EU27 Net Imported Deforestation in crops: 7.4 Mha
20% Brazil -Soybean Cake Nigeria -CocoaBeans
23%
1% Brazil -Soybeans Indonesia -Natural Rubber
1% Argentina -Soybean Cake Argentina -Soybeans
1%
Indonesia -PalmOil Indonesia -Coffee Green
2%
2% Paraguay -Soybeans Cameroon -CocoaBeans
2%
18% Ghana -CocoaBeans Indonesia -CocoaBeans
2%
Brazil -Nuts Other
3%
3% Malaysia -PalmOil
9% 9%
4%
Source: Cuypers et al. (2013, page 60)
13The EU Common Agricultural Policy, soy, and forest destruction 4. Recommendations What could beneficially be modified under current CAP rules? While previous rounds of CAP reform have greatly reduced payments to EU farmers linked to production of particular products, some such payments remain. The continuation of the beef premium and a number of animal product related market support measures, clearly make the activities they finance more attractive than they would be without such payments. Remaining ‘coupled’ payments for animal products, which are purely linked to production should, therefore, be abandoned (e.g. the calf slaughter premium), while these and other payments should be more closely tied to achieving broader environmental goals, making feeding practices more sustainable or improving animal welfare. Abolishing direct payments made per head of animal would be a disincentive to animal production, leading to a corresponding reduction in demand for animal feed. There could also be more ‘greening’ of general payments. A further shift of CAP payments from pillar one (direct agricultural support payments and market measures) to pillar two (rural development) would support the prioritisation of specific environmental measures based on notions of ‘public money for public goods’, such as low-input, organic or integrated production schemes as well as legume/protein crop increases. This shift would have potential effects on feed imports. A further option would be to reduce livestock production based on protein feed imports. What would need to be addressed under a new post-2020 food and farm policy? To improve the CAP’s ability to mitigate deforestation, more could be achieved by amending the CAP itself than by abolishing the few remaining parts of the existing CAP that provide what are at most only modest incentives to production systems that lead to deforestation. Amendments of the CAP that work towards more strict and effective greening measures are likely to have greater leverage on livestock production and feed import volumes. This could bring a number of advantages – not least mitigation of what is referred to as the nitrogen surplus. Excessive nitrogen concentration has several negative effects: it endangers plant diversity, causes eutrophication (promoting the growth of algae and other plant life, which take oxygen from the water, causing the death of fish and molluscs), and accelerates climate change. Farming methods used widely in the EU lead to excessive quantities of nitrogen entering the soil, water and air from a variety of sources, including animal manure and mineral fertilisers. When livestock is fed on imported protein, the manure it produces introduces extra nitrogen to the local ecosystem. Pasture-fed livestock, on the other hand, takes up nitrogen from the ecosystem (through feeding) as well as introducing it via manure, meaning the overall local nitrogen levels are more balanced.54 14
The EU Common Agricultural Policy, soy, and forest destruction

Changes to the CAP could make agricultural support more strictly conditional on reducing nitrogen
surpluses, improving animal health and welfare, and the efficient use of available resources. It would
also act to reduce concentrate feed use in feeding rations for animal production, with an increased
focus on sustainable grassland utilisation. In general, support could increasingly be targeted towards
less intensive production systems such as organic production, grassland-based livestock systems or
permaculture.

This would need to be accompanied by measures to reduce overall EU consumption of animal
products, to achieve impact reductions at the global level rather than merely relocating negative
environmental consequences through replacing domestic production with imports. To achieve truly
sustainable agricultural production systems in the EU, the CAP should be linked much more to the
demand side and to general food policy, meaning that it might become a common food systems
policy rather than being focused on agricultural production.

What additional measures could be taken besides the CAP or a new post-2020
food and farm policy?

Additional measures could include reducing imports of livestock from countries with deforestation
risk; labelling the origin of feedstock, so informing consumers and producers; increasing domestic
protein feed crop production; reducing livestock production based on protein feed imports; and
increasing the use of wastage, residues and by-products as animal feed.

Increasing import tariffs for forest risk commodities or lowering tariffs for sustainably produced
commodities could be another policy option. At present, under international trade rules adopted in
the 1960s, soy enters the EU virtually free of import duties. Raising tariffs in general may be difficult,
but lowering duties –specifically for legally and sustainably produced commodities – is possible, and
has been done in the past for sustainable timber under the EU’s Generalised Scheme of Preferences.
Fern research published in 2015 explored how this idea could be made to work for soy products. If
this approach were to be adopted, there would need to be a requirement that imports of soy into the
EU could be shown to have been legally and sustainably produced.55

                                                                                                       15
The EU Common Agricultural Policy, soy, and forest destruction 5. Conclusion The current CAP does not directly incentivise production that leads to deforestation as there are no specific subsidies for imported feedstuffs. However, some parts of the CAP, such as the beef premium and animal product related market support measures, clearly make these activities more attractive. Abandoning these payments could, therefore, result in somewhat lower livestock production, and a reduction in corresponding feed imports and the associated potential risk of deforestation. More can be achieved, however, by amending the CAP as part of the current reform process and turn the CAP into a Food and Farm Policy. Such changes could make agricultural support conditional on reducing nitrogen surpluses, increasing animal health and welfare, and the efficient use of available resources. Such a policy would focus on measures that would lead to reduced incentives for livestock production, e.g. internalisation of external costs, support for grassland-based production systems, and increased support for organic agriculture and permaculture. Addressing demand is critical. As long as consumers want high quantities of cheap animal products, and as long as producers are allowed to meet this demand, concentrate-based mass production of livestock will dominate. Lower consumption levels and a move towards a true circular economy will be crucial. The EU therefore needs to develop policies that reduce the consumption of forest-risk commodities, preferably as part of an EU Action Plan to address deforestation and strengthen the circular economy. Such an EU Action Plan should be based on lessons learned from the EU FLEGT Action Plan and other EU initiatives to regulate supply chains, as discussed in a recent Fern research paper.56 This Action Plan should also elaborate possible incentives for legal and sustainable production and consumption of soy and other feedstuffs, possibly including the development of sustainability criteria for feed imports – to be negotiated and agreed with all stakeholders in producer countries. These criteria should include indicators on deforestation, respect for customary land tenure, but also on indirect land use change to address conversion. Such criteria could be used as the basis for cross compliance measures under the CAP. In conclusion, amendments to the current CAP could contribute to reducing deforestation, but much more can be expected from a reformed CAP if those reforms focus on reduced nitrogen surpluses and increased animal health and welfare. Even then, reducing the EU’s consumption of animal products is essential, and trade policies to reduce consumption and ensure the production and consumption of only legally and sustainably sourced feedstuff will be vital in order to reduce the EU’s deforestation footprint. 16
The EU Common Agricultural Policy, soy, and forest destruction

6. Endnotes

1   European Commission; Addressing the challenges of deforestation and forest degradation to tackle climate change and
    biodiversity loss: http://eur-lex.europa.eu/legal-content/EN/TXT/?uri=CELEX:52008DC0645
2   New York Declaration on Forests; Action Statements and Action Plans; September 2014: http://www.un.org/
    climatechange/summit/wp-content/uploads/sites/2/2014/07/New-York-Declaration-on-Forest-%E2%80%93-Action-
    Statement-and-Action-Plan.pdf
3   UN Sustainable Knowledge Platform: https://sustainabledevelopment.un.org/sdg15
4   Lawson S. 2014. Forest Trends; Consumer Goods and Deforestation. http://www.forest-trends.org/documents/files/
    doc_4718.pdf
5   Cuypers D et al. 2013. The impact of EU consumption on deforestation. European Commission. http://ec.europa.eu/
    environment/forests/pdf/1.%20Report%20analysis%20of%20impact.pdf
6   Van Gelder JW et al. 2008. Soy consumption for feed and fuel in the European Union; research paper for Friends of the
    Earth Netherlands. Profundo. https://milieudefensie.nl/publicaties/rapporten/soy-consumption-for-feed-and-fuel-in-
    the-european-union
7   European Commission; CAP explained – direct payments to farmers. https://ec.europa.eu/agriculture/sites/agriculture/
    files/direct-support/direct-payments/docs/direct-payments-schemes_en.pdf
8   European Commission; The Common Agricultural Policy (CAP); 2016: http://ec.europa.eu/agriculture/cap-overview/
    index_en.htm
9   European Commission. 2015. EU agriculture spending focused on results; Brussels: http://ec.europa.eu/agriculture/
    sites/agriculture/files/cap-funding/pdf/cap-spending-09-2015_en.pdf
10 Hart K. 2015. Green direct payments: implementation choices of nine Member States and their environmental
   implications. Institute for European Environmental Policy (IEEP), London
11 Peeters A. 2012. Reform of the CAP: progress for grasslands and livestock farming. Options Méditerranéennes Series A:
   Mediterranean Seminars. 29-34.
12 Hasha G. 2002. Livestock Feeding and Feed Imports in the European Union: A Decade of Change, US Department of
   Agriculture, Economic Research Service
13 Ibid.
14 Peeters A, op. cit.
15 Hasha G, op. cit.
16 Peeters A, op. cit.
17 Hasha G, op. cit.
18 Bues A et al. 2013. The environmental role of protein crops in the new Common Agricultural Policy. In: European
   Parliament Brussels.
19 European Commission. 2015. Voluntary coupled support – Sectors mostly supported. Notification of decisions taken
   by Member States by 1 August 2014. Informative Note 30 July 2015. [Online] Available: http://ec.europa.eu/agriculture/
   sites/agriculture/files/direct-support/direct-payments/docs/voluntary-coupled-support-note_en.pdf
20 Hasha G, op. cit.
21 FEFAC. 2014. The feed chain in action: animal nutrition – the key to animal performance, health and welfare. In:
   European Feed Manufacturers’ Federation. Brussels.
22 FEFAC. 2015. The compound feed industry in the EU livestock economy. European Feed Manufacturers’ Federation.
23 EUROSTAT 2016 data.
24 Van Gelder JW et al., op. cit.
25 Ibid.
26 FAOSTAT. 2016a. Commodity balances in primary crop equivalents: http://faostat3.fao.org/download/FB/BC/E
27 FAOSTAT. 2016b. Food and Agriculture Organization of the United Nations Statistics Division: official homepage. http://
   faostat3.fao.org/home/E

                                                                                                                        17
The EU Common Agricultural Policy, soy, and forest destruction 28 Hasha G, op. cit. 29 Hasha G, op. cit. 30 Cuypers JW et al., op. cit. 31 Khatun K. 2012. Reform or reversal: implications of the Common Agricultural Policy (CAP) on land use, land use change, and forestry (LULUCF) in developing countries. Conservation Letters, 5, 99-106. 32 FEFAC, European Feed Manufacturers’ Federation. 2015. The compound feed industry in the EU livestock economy. Source: PROLEA. 33 EUROSTAT data, 2016. 34 European Commission. 2015. GMOs: Commission’s proposal on food/feed. ec.europa.eu/food/plant/docs/20150422_ plant_gmo_new_authorisation_gmo_food_feed_proposal_en.pdf 35 The authors calculated these figures from 2016 FAOSTAT data. 36 Cuypers JW et al., op. cit. 37 Ibid. 38 Ibid. 39 FAOSTAT. 2016. op. cit. 40 Barretto AGOP et al. 2013. Agricultural intensification in Brazil and its effects on land-use patterns: an analysis of the 1975–2006 period. Global Change Biology, 19, 1804-1815. 41 Hansen MC et al. 2013. High-resolution global maps of 21st-century forest cover change. Science, 342, 850-853. 42 Andrade de Sá et al. 2013. Dynamics of indirect land-use change: empirical evidence from Brazil. Journal of Environmental Economics and Management, 65, 377-393. 43 Macedo MN et al. 2012. Decoupling of deforestation and soy production in the southern Amazon during the late 2000s. Proceedings of the National Academy of Sciences, 109, 1341-1346. 44 Arima EY et al. 2014. Public policies can reduce tropical deforestation: Lessons and challenges from Brazil. Land Use Policy, 41, 465-473. 45 Hecht SB. 2012. From eco-catastrophe to zero deforestation? Interdisciplinarities, politics, environmentalisms and reduced clearing in Amazonia. Environmental Conservation, 39, 4-19. 46 Godar J et al. 2016. Balancing detail and scale in assessing transparency to improve the governance of agricultural commodity supply chains. Environmental Research Letters, 11, 035015. 47 Cuypers JW et al., op. cit. 48 Gibbs HK et al. 2015. Brazil’s Soy Moratorium. Science, 347, 377-378. 49 Henders S et al. 2015. Trading forests: land-use change and carbon emissions embodied in production and exports of forest-risk commodities. Environmental Research Letters, 10, 125012. 50 Gibbs HK et al. 2015, op. cit. 51 Gibbs HK et al. 2016. Did ranchers and slaughterhouses respond to zero-deforestation agreements in the Brazilian Amazon? Conservation Letters, 9, 32-42. 52 Henders S et al., op. cit. 53 Cuypers JW et al., op. cit. 54 http://ec.europa.eu/eurostat/statistics-explained/index.php/Agri-environmental_indicator_-_gross_nitrogen_balance 55 Brack, D. 2015. Duty free – making EU tariffs work for people and forests. Fern. http://www.fern.org/sites/fern.org/files/ Duty%20Free.pdf 56 Pritchard, J. 2016. Developing EU measures to address forest risk commodities. http://www.fern.org/sites/fern.org/files/ Developing%20EU%20measures_0.pdf 18
Fern office UK
1C Fosseway Business Centre, Stratford Road,
Moreton in Marsh, GL56 9NQ, UK
Fern office Brussels
Rue d’Edimbourg, 26, 1050 Brussels, Belgium
www.fern.org
You can also read