Assessment of Dehydration as a Commercial-Scale Food Waste Valorization Strategy - MDPI
←
→
Page content transcription
If your browser does not render page correctly, please read the page content below
sustainability

Article
Assessment of Dehydration as a Commercial-Scale
Food Waste Valorization Strategy
Jon T. Schroeder 1 , Ava L. Labuzetta 1,2 and Thomas A. Trabold 1, *
 1    Golisano Institute for Sustainability, Rochester Institute of Technology, Rochester, NY 14623, USA;
      js9683@g.rit.edu (J.T.S.); allp2i@rit.edu (A.L.L.)
 2    New York State Pollution Prevention Institute, Rochester Institute of Technology, Rochester, NY 14623, USA
 *    Correspondence: tatasp@rit.edu; Tel.: +1-585-475-4696

 Received: 8 June 2020; Accepted: 21 July 2020; Published: 24 July 2020

 Abstract: Using a commercially available dehydration unit, this study aimed to valorize various food
 waste streams from different sources in the Rochester, New York area. Dehydration of the food waste
 collected for the study helped reduce the weight of the feedstock by 70–90%, as the incoming waste
 streams were relatively wet. The output was materially characterized against end uses such as cattle
 feed, fish feed, and compost. The results demonstrated that, other than fertilizer, the remaining five
 end uses (compost, fish feed, cattle feed, pyrolysis, and pelletized fuel) were potentially compatible
 with varying waste feedstocks based on the parameters analyzed. Fish feed in particular was found to
 be the most compatible end use, as a number of attributes, including protein, fell within the optimal
 range of values. Pelletized fuel was also determined to be a viable application, as six out of eight
 sources of dehydrated food waste had higher heating values above the minimum U.S. standard level
 of 18.61 MJ/kg. Ultimately, this analysis showed that the composition of the food waste needs to
 be matched to an end-use application and sale of the product for dehydration to be a worthwhile
 valorization strategy.

 Keywords: food waste; dehydration; valorization; compost; fish feed; cattle feed; biochar

1. Introduction
      The global food system requires enormous inputs of natural resources. In the United States,
the food system accounts for 20% of energy use, 50% of freshwater consumption, and as much as 13%
of greenhouse gas emissions [1]. Despite the high levels of embodied water and energy, an alarming
fraction of food is wasted, with 30–40% of food produced never consumed by humans [1]. Because of
the severe system inefficiencies, food waste has been recognized as a significant problem demanding
urgent action, and many regions now restrict food waste treatment in landfills and publicly owned
treatment works (POTW). However, to enable food waste generators to comply with increasingly strict
waste management regulations, alternatives that are more environmentally, economically, and socially
sustainable need to be developed and deployed at scale.
      Much of the recent food waste valorization research has focused on systems that produce secondary
food products, fertilizers, chemicals or fuels [2–4]. These systems in principle can extract greater
value from food waste material than the incumbent technologies, but only a few have moved beyond
lab-scale validation. Their economic potential is based upon operation of large, centralized facilities
that may present other sustainability challenges, such as the greenhouse gas emissions associated with
truck transport. Much less effort has been applied to developing food waste management options that
offer economic viability at the scale of a single commercial food waste generator.
      Some prior research has investigated the potential of dehydration as a means of upcycling food
waste, mainly in the context of animal feed production [5,6]. Hall [7] conducted a comprehensive

Sustainability 2020, 12, 5959; doi:10.3390/su12155959                         www.mdpi.com/journal/sustainability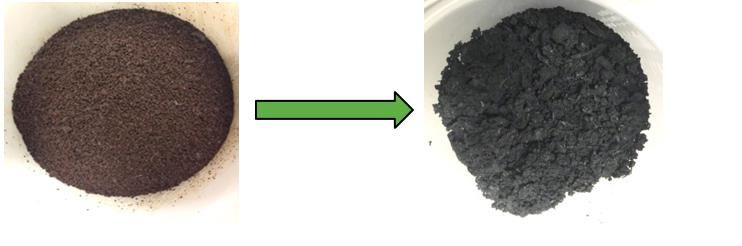
Sustainability 2020, 12, 5959                                                                        2 of 13

analysis of food waste conversion in a centralized animal feed production plant and reported that
net greenhouse gas emissions can be significantly reduced by displacing conventional animal feed,
even when the incoming feedstock requires a large energy input for drying. Sotiropoulos and
co-workers [8–11] investigated food waste dehydration at the residential scale in Greece and reported
an average mass reduction of approximately 70% with the associated energy cost being lower than for
conventional food waste treatment. The low water content of the post-dehydration material was also
found to slow decomposition and minimize odors, thus enabling less frequent waste collection [8].
Moreover, it was determined that the physical and chemical properties of the dried food material
give it potential as a feedstock for value-added products like compost and biofuels (biomethane and
bioethanol). Karthikeyan et al. [12] documented how dehydration and other pretreatment methods
can enhance the performance of anaerobic digestion and dark fermentation processes. By suppressing
premature decomposition, the carbon content of the base substrate was preserved while minimizing
the presence of unwanted microorganisms and contributing to higher methane and hydrogen yields.
Despite the clear advantages of both dehydration and mechanical pretreatment (i.e., grinding to reduce
particle size and increase surface area), Karthikeyan et al. [12] have also acknowledged that most
published literature is based on laboratory-scale experiments, and more data are needed at pilot scale
in combination with comprehensive energy and economic assessments.
     There may be value in dehydration at the source of food waste generation to reduce mass and
transport costs for downstream upcycling processes such as animal feed production, composting,
or anaerobic digestion. Moreover, enhanced economic and social sustainability benefits may be
created by enabling the food waste generator to extract additional value from materials that are part
of their own operation. For example, Sotiropoulos et al. [13] have demonstrated the potential of
distributed management of residential food waste resources through the combination of dehydration
and simultaneous saccharification and fermentation (SSF). Balaskonis et al. [11] conducted an economic
analysis of household-scale food waste dehydration deployed throughout a major Greek municipality,
and determined that savings in the order of 6 million euros could be achieved relative to the conventional
landfilling system.
     In this paper, we have extended the prior research on food waste dehydration by assessing waste
streams obtained at different stages of the food supply chain, including two food manufacturers,
a retail grocery store, and four food service operations (cafeteria, food bank, restaurant and hospital).
Moreover, the characteristics of these diverse food waste resources were quantified to understand their
potential for valorization after dehydration in a variety of end-use applications: fertilizer, compost,
biochar, fish feed, cattle feed and pelletized fuel. For each food waste material tested, our objective
was to assess a wide variety of potential valorization pathways as opposed to acquiring extensive data
relevant to a single pathway. Therefore, the quantitative analysis presented below was not based on
large sample populations, but rather was intended to identify opportunities for potential economic
value of dehydrated food waste, and thereby encourage future research and development efforts.
The novelty of our research stems from the wide variety of food waste resources dehydrated and
multiple potential end-uses considered for each, based on evaluation of the results of an extensive
37-parameter characterization test suite described below and in the Supplementary Materials file.

2. Materials and Methods

2.1. Food Waste Input and Output Characterization
     The New York State Pollution Prevention Institute (NYSP2I) at the Rochester Institute of Technology
(RIT) worked with five Rochester, New York area entities to collect food waste samples representative
of potential clients in different sectors of the food supply chain. A 22.7 kg (50 lb.) sample was collected
from each client in 18.9 L (5 gallon) buckets and returned to our laboratory. Two of the five samples
(grocery and food bank) were comprised of only pre-consumer food waste, whereas three other samples
were a mixture of both pre- and post-consumer food waste (Table 1). Two locally available food
Sustainability 2020, 12, x FOR PEER REVIEW 3 of 13
whereas three other samples were a mixture of both pre- and post-consumer food waste (Table 1).
Sustainability 2020, 12, 5959 3 of 13
Two locally available food processing wastes, tofu okara and cherry pomace, were also included in
the study because of their high nutritional content and potential as value-added secondary food
products after
processing dehydration.
wastes, tofu okara and cherry pomace, were also included in the study because of their
high nutritional content and potential as value-added secondary food products after dehydration.
Table 1. Summary of food waste collected.
Table 1. Summary of food waste collected.
Source Food Waste Type Collected
Cafeteria
Source Food WastePre- Typeand Post-Consumer
Collected
Restaurant Pre- and Post-Consumer
Cafeteria Pre- and Post-Consumer
Food Bank Pre-Consumer (Canned Goods)
Restaurant Pre- and Post-Consumer
Hospital Pre- and Post-Consumer
Food Bank Pre-Consumer (Canned Goods)
Grocery Store Pre-Consumer
Hospital Pre- and Post-Consumer
Juice Manufacturer
Grocery Store Cherry Pomace
Pre-Consumer and Pits (Pre-Consumer)
Tofu Manufacturer
Juice Manufacturer Tofu Okara 1 (Pre-Consumer)
Cherry Pomace and Pits (Pre-Consumer)
1 Okara isTofu Manufacturer
the insoluble part of soybeans thatTofu after1 steam
Okara
remains (Pre-Consumer)
cooking for tofu production.
1 Okara is the insoluble part of soybeans that remains after steam cooking for tofu production.
Each sample was collected the day that it was to be processed through the dehydration unit
described in Section 2.2. Four samples of both the input and output material, as well as one sample
of theEach sample water,
condensate was collected
were taken the day
fromthat
eachitof wastheto be processed
original through
five batches the dehydration
(Figure 1). One sample unit
of
described
each of theindehydrated
Section 2.2. food
Fourprocessing
samples ofwastes
both the input pomace
(cherry and output andmaterial, as well
tofu okara) wasas one sample of
taken.
the condensate
Both the input water,andwere taken
output from each
samples were of tested
the original
for thefive
samebatches
suite (Figure 1). One sample
of 37 parameters, of each
summarized
of the dehydrated food processing wastes (cherry pomace and tofu okara) was
in Table S1 of the Supplementary Materials file. Three of the 37 parameters were tested in triplicate taken.
in ourBoth the input
in-house and output
laboratory (pH,samples were tested
total volatile solids,forandthe same
total suite and
solids), of 37the
parameters,
remainingsummarized
parameters
in Table S1 of the Supplementary Materials file. Three of
were tested at Dairy One Labs in Ithaca, New York. Data for post-dehydrationthe 37 parameters were tested in triplicate
material in
densities,
our
totalin-house laboratory
solids (TS), and total(pH, total volatile
volatile solids,all
solids (TVS), and total solids),
measured and the remaining
in triplicate, are provided parameters
in Tableswere
S2–
tested at Dairy One Labs in Ithaca, New York. Data for post-dehydration material
S4. Parameters were chosen based on the potential end uses of the product and what characteristics densities, total solids
(TS),
wereand total volatile
deemed important.solids
For(TVS), all measured
example, one potentialin triplicate,
end useareof provided in Tables
the material S2–S4. Parameters
was fertilizer, for which
were chosen
nitrogen (N),based on the potential
phosphorous (P), andend uses of the
potassium (K) product andimportant
content are what characteristics were deemed
factors. Therefore, these
important. For example, one potential end use of the material was fertilizer,
parameters were added to the suite of parameters to test. Full details of the analytical methods used for which nitrogen (N),
phosphorous (P), and potassium (K) content are important factors. Therefore,
for measurement of the 37 characterization parameters are provided in Table S6 of the Supplementary these parameters were
added to the suite of parameters to test. Full details of the analytical methods used for measurement of
Materials.
the 37 characterization parameters are provided in Table S6 of the Supplementary Materials.
2.2. Ecovim Product Application Assessment
2.2. Ecovim Product Application Assessment
The experimental platform used throughout the research was the commercial-scale Ecovim-
The experimental platform used throughout the research was the commercial-scale Ecovim-66
66 (Figure 2) configured to mechanically agitate and dehydrate food and other organic wastes in
(Figure 2) configured to mechanically agitate and dehydrate food and other organic wastes in batches up
batches
to up tokg),
66 lb (29.9 66 lb (29.9 kg),
reducing thereducing the input
input material material mass/volume
mass/volume between
between 70–90% 70–90%
within within
a 24-h a 24-
period [14].
hr period [14].
Figure
Figure 1. Dehydrated output
1. Dehydrated and condensate
output and condensate water
water samples
samples from
from five
five food
food waste
waste sources.
sources.Sustainability 2020, 12, 5959 4 of 13
Sustainability 2020, 12, x FOR PEER REVIEW 4 of 13
Figure 2. Ecovim-66
Figure 2. Ecovim-66 system.
system.
We determined the major opportunities for end markets and performed a detailed literature review
We determined the major opportunities for end markets and performed a detailed literature
to ascertain how the Ecovim-66 output material could be used, based on key characteristics needed.
review to ascertain how the Ecovim-66 output material could be used, based on key characteristics
For each potential end market use, we defined “optimal” ranges of key parameters. For example,
needed. For each potential end market use, we defined “optimal” ranges of key parameters. For
feed for dairy cows requires carbohydrate and protein levels to be within a certain range. Using the
example, feed for dairy cows requires carbohydrate and protein levels to be within a certain range.
data collected by Dairy One, the characteristics of the output materials were compared to these ranges
Using the data collected by Dairy One, the characteristics of the output materials were compared to
to determine if the dehydrated food was a potential match for that end market. Qualitative information
these ranges to determine if the dehydrated food was a potential match for that end market.
was also included in the analysis where appropriate. Though food safety would be an important
Qualitative information was also included in the analysis where appropriate. Though food safety
requirement in utilizing the dehydrated material in animal feed markets, analysis specifically related
would be an important requirement in utilizing the dehydrated material in animal feed markets,
to food safety was outside the scope of this assessment.
analysis specifically related to food safety was outside the scope of this assessment.
3. Results and Discussion
3. Results and Discussion
3.1. End Use Application Assessment
3.1. End Use Application Assessment
Based primarily on literature research, we investigated several potential end markets for the
Based primarily
dehydrated food waste, on including
literature useresearch,
directlyweasinvestigated several potential
fertilizer replacement, feedstockend for
markets for the
composting,
dehydrated
direct food waste,
or supplemental including
animal use directly
feed, pelletized asand
fuel, fertilizer
input forreplacement,
pyrolysis tofeedstock for composting,
produce biochar. Table S5
direct or supplemental animal feed, pelletized fuel, and input for pyrolysis
provides the descriptions of the input and output materials from each of the original five sources. to produce biochar. Table
S5 provides the descriptions of the input and output materials from each of
This section discusses the results in the context of potential end uses of the dehydrated food the original five sources.
wasteThis sectionTables
products. discusses
2–7 aretheeach
results in the
specific tocontext of potential
one end-use end uses
application. of the
The key dehydrated
parameters for food
that
application are listed in the left-most column, and test results for each of the dehydrated samples that
waste products. Tables 2–7 are each specific to one end-use application. The key parameters for run
application
are listed in are
theirlisted in the left-most
corresponding column,
columns. and test
Values results for
are bolded eachfall
if they of the dehydrated
within samples
the optimal rangerun of
are listed in their corresponding columns. Values are bolded if they fall within
values for that parameter in the given application, and each is discussed in more detail in the narrative the optimal range of
values for that parameter in the given application, and each is discussed
of its respective section. Analytical methods applied for the 37 parameters measured in this study are in more detail in the
narrative of
described in its respective
Table S6. section. Analytical methods applied for the 37 parameters measured in this
study are described in Table S6.
3.2. Fertilizer
3.2. Fertilizer
The first end use investigated was using the dehydrated food waste directly as a fertilizer substitute.
The first
Fertilizers, unlikeendsoil
useamendments,
investigated are wasused
using the dehydrated
purely food content,
for their nutrient waste directly as a fertilizer
which includes both
substitute.
macro- Fertilizers, unlike
and micronutrients. soilare
There amendments, are used
six macronutrients thatpurely for theirand
plants require, nutrient content,
three of which
these (carbon,
includes both
hydrogen, andmacro-
oxygen) andaremicronutrients.
provided by airThere are six The
and water. macronutrients
remaining three that plants require,
(nitrogen, and three
phosphorous,
of these
and (carbon,arehydrogen,
potassium) provided and oxygen)
by soil, aretherefore
and are providedkey by parameters
air and water. The on
labelled remaining three
commercially
(nitrogen,fertilizers
available phosphorous, and potassium)
[15]. Calcium, magnesium, are provided
and sulfurby aresoil,
alsoand are therefore
required for plant key parameters
growth, though
labelled on commercially available fertilizers [15]. Calcium, magnesium, and sulfur are also required
for plant growth, though they are needed in much smaller amounts [15]. In addition to the nutrientSustainability 2020, 12, 5959 5 of 13
they are needed in much smaller amounts [15]. In addition to the nutrient requirements of soil, pH and
moisture content are two key chemical and physical characteristics of soil that are also important for
healthy plant growth. Macronutrients are denoted in fertilizer products by displaying the percentage
of the nutrient by weight in the fertilizer. For example, a fertilizer with an NPK of 10-5-10 has 10% N,
5% P, and 10% K content by weight. However, nutrient requirements for crops are typically displayed
in units of mass, which indicates the physical amount of a nutrient that a plant will take up during its
growth period. Therefore, the amount of fertilizer to be added to a crop depends on the total mass of
the nutrient needed, the concentration of that nutrient in the fertilizer, and the amount of that nutrient
already present in the soil.
Though the types of macronutrients required are fairly consistent across plant types, the target
level of each of these parameters can change depending on the type of crop being grown. For example,
growing rice would require a fertilizer highest in K in comparison to a fertilizer used to grow soybeans,
which would require higher N content. It is apparent that the desired NPK ratio of a given fertilizer
depends heavily on the target end application. For more general use, on a household or recreational
gardening level, an “all purpose” fertilizer is often used, which commonly has a 5-5-5 NPK ratio.
The relevant results from the dehydrated food waste testing are compared to an all-purpose fertilizer,
as summarized in Table 2. None of the dehydrated output materials showed optimal NPK levels to be
used directly as a fertilizer. Of the NPK values, nitrogen showed the highest value, while phosphorus
and potassium levels were consistently well below the optimal values.
Because the Ecovim-66 dehydration system output nutrient levels were lower than what is
typically required for a fertilizer, more material could be added to supply the necessary mass of
nutrient required. Though theoretically possible, this is not ideal, because a plant needs the nutrients
concentrated within an area where they can be reached. If the concentrations are too low, the area the
plant would need to cover to absorb those nutrients becomes too large, leading to malnourishment.
Thus, the nutrient levels measured in the dehydrated food waste streams indicated that they would
not be suitable for use directly as a fertilizer.
In addition to nutrient levels, pH was considered, because it is directly related to plant health and
the ability for microbial activity to thrive in soils. The majority of plants grow best in soils that are
slightly acidic to neutral, with pH values between 5.5 and 7 (see Table S7). Comparing the ideal soil
pH to the measured pH for the dehydrated food output, it was found that most of the dehydrated
foods had pH values below the optimal range, indicating that they are too acidic for most plant growth.
However, the tofu processing waste did show a pH value within the optimal range. It should be noted
that certain plants, such as blueberries, require more acidic soils than average and will do well in a pH
range of 4.5–5.5 [16], which is where most of the dehydrated food waste pH values fell.
Table 2. Attribute comparison between dehydrated food waste and fertilizer. (Bolded cells indicate
value within optimal range).
Optimal Food Juice Tofu
Relevant Attributes Restaurant Cafeteria Hospital Grocery
Value Bank Processor Processor
Nitrogen (N) (%) 5 3.65 3.38 3.06 3.22 3.46 4.02 4.38
Phosphorus (P) (%) 5 0.34 0.26 0.36 0.31 0.30 0.20 0.31
Potassium (K) (%) 5 1.19 1.26 0.68 0.79 0.95 0.82 1.13
pH 5.5–7.0 4.8 4.5 4.6 4.8 4.6 3.7 5.8
3.3. Feedstock for Composting
Composting of dehydrated food waste material was also investigated as a follow-on process to
dehydration. Key parameters for successful composting include carbon, nitrogen, moisture content,
and pH levels (Table 3). The microbes that perform the composting process of breaking down the
organic material require a ratio of approximately 25–30 parts carbon to one part nitrogen, or a C:N
ratio of 25–30:1 [17]. When this C:N ratio is achieved, the microbes are most efficient in breaking down
the organic material. If the C:N ratio is too high, the composting process can slow down significantly.Sustainability 2020, 12, 5959 6 of 13
If it is too low, the microbes are not able to use all the nitrogen and it is emitted to the atmosphere in
the form of ammonia, causing an unpleasant smell. The optimum moisture content is also determined
by the microbes that break the material down, which require a moisture content between 40–65% [18].
Too high a moisture content may cause the compost to convert to an anaerobic reaction, producing an
unpleasant smell, whereas moisture content that is too low will limit the microbial activity and slow
the process down.
Based on these results, dehydrated food waste is not an ideal input for composting on its own.
However, it could be composted if mixed with other organics. In fact, most compost feedstocks are not
exact matches for composting alone, but instead need to be combined with materials to obtain the
correct balance of carbon, nitrogen, and moisture content. For example, yard waste, which is high in
carbon content and low in moisture content, can be combined with raw food waste, which is high in
nitrogen and moisture content to produce a successful compost.
Table 3. Attribute comparison between dehydrated food waste and compost. (Bolded cell indicates
value within optimal range).
Relevant Optimal Food Juice Tofu
Restaurant Cafeteria Hospital Grocery
Attributes Range Bank Processor Processor
C:N 25–30:1 12.6:1 14.6:1 17:1 15.7:1 15.3:1 12.7:1 11.8:1
pH 5.5–8.5 4.8 4.5 4.6 4.8 4.6 3.7 5.8
Moisture (%) 40–60 7 4.7 2.4 4.4 2.9 20.2 0.6
3.4. Pyrolysis (Biochar Production)
The dehydrated food waste material was also analyzed for its potential use as a pyrolysis feedstock
to produce biochar. Pyrolysis is a thermochemical process that essentially heats biomass material (in
this case food waste) to a high temperature in the absence of oxygen [19]. Biochar is one of the main
products of pyrolysis, with syngas and bio-oil being others. It is very similar to charcoal and typically
used as a soil amendment. Depending on the feedstock and intended end use, the pyrolysis process
can be optimized to favor one of the three aforementioned outputs. To move toward a closed-loop
food system, pyrolysis used to process nutrient-rich organics usually optimizes the biochar portion so
that the nutrients can be recycled back into the food chain through use as a soil amendment while also
adding stability and water retention properties [20].
Like the previous applications discussed, ideal characteristics of biochar depend strongly on
the intended application. For example, if a soil has high pH, then biochar with a low pH would be
beneficial to balance the alkalinity. If the user wants to increase water retention of the soil, high-surface
area biochar is preferable. However, consistency of the pyrolysis input material is the most significant
factor when producing biochar because the pyrolysis process is tailored to fit the specific characteristics
of the feedstock. This means that pyrolyzing mixed food waste on a large scale would be difficult, while
homogeneous waste streams (such as from a food processor) may prove better fits for pyrolysis [21].
Water content can be high in certain feedstocks, such as food. The higher the water content, the more
thermal energy that is needed. Therefore, a drying stage could be integrated upstream of the pyrolysis
process and make use of the available waste heat. Based on this, a threshold of 15% moisture content
was chosen as the optimal range [22]. As seen in Table 4, six of the seven dehydrated materials tested
fell below that moisture level.
Table 4. Attribute comparison between dehydrated food waste and pyrolysis input. (Bolded cell
indicates value within optimal range).
Relevant Optimal Food Juice Tofu
Restaurant Cafeteria Hospital Grocery
Attributes Range Bank Processor Processor
Moisture (%)Sustainability 2020, 12, 5959 7 of 13
Sustainability 2020, 12, x FOR PEER REVIEW 7 of 13
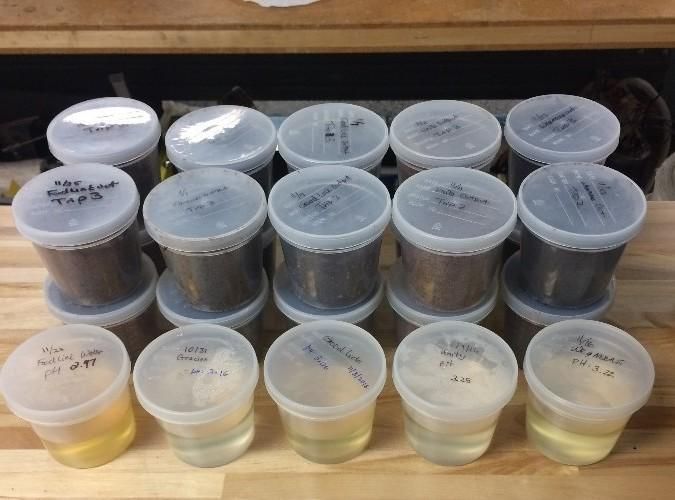
To examine this application further, we produced biochar with a sample of the dehydrated food
To examine
waste material thisuniversity
from the application further,The
cafeteria. we material
produced biochar
was heated with
at aarate
sample
of 5 ◦of
C the
perdehydrated
minute up tofood
waste
◦ material from the university cafeteria. The material was heated at a rate
500 C where it was then held at constant temperature for one hour. The pyrolysis process produced of 5 °C per minute a up
to 500
biochar °C of
yield where it wasbythen
25 ± 0.4% heldAatphoto
weight. constant temperature
of the dehydratedfor one
food hour.
input and The pyrolysis
resulting process
biochar
produced
output can beaseen
biochar yield 3.
in Figure of Based
25 ± 0.4% by weight.
on these A photo
results, it was of the dehydrated
concluded food inputfood
that dehydrated and waste
resulting
canbiochar
be usedoutput can bebiochar
to produce seen in Figure
and then 3. Based on these
potentially results,
applied asitawas
soilconcluded
amendment, thatdepending
dehydratedonfood
the waste
content can
ofbe used constituents
certain to produce biochar
includingandsodium,
then potentially
chlorine,applied as a soil
and sulfur. amendment,
Concerns depending
of consistency
on the content of certain constituents including sodium, chlorine, and sulfur.
imply that the mixed food waste would be better for small-batch biochar production, whereas foodConcerns of consistency
imply that
processing the mixed
waste, which food waste
is much morewould be better forcould
homogeneous, small-batch
be better biochar
suitedproduction,
for commercial whereas
scalefood
processing
biochar waste, which is much more homogeneous, could be better suited for commercial scale
production.
biochar production.
Figure 3. Dehydrated food waste (cafeteria) and resulting biochar.
Figure 3. Dehydrated food waste (cafeteria) and resulting biochar.
3.5. Fish Feed
3.5. Fish Feed
Different types of fish require feed with different nutrient levels, and these change throughout the
lifespan Different
of the animaltypesasofwell.fish require
However, feed with
there is different
still a range nutrient
within levels,
which and
mostthese
feedchange throughout
requirements
willthe
fall,lifespan of thebelow
as outlined animalinasTablewell.5.However,
In general, therefishisare
stillfed
a range
eitherwithin which
complete most
diets orfeed requirements
supplemental
will
diets, the fall, as outlined
former below in for
being necessary Table most 5. In general, fish
farm-raised fishare fed either
because theycomplete
are not abledietsto or supplemental
forage freely
diets, the
on natural former
feeds. Forbeing necessary
fish raised for most farm-raised
in environments with access fishtobecause
naturaltheyfoodare notponds
(e.g., able toorforage
outdoor freely
on natural feeds. For fish raised in environments with access
raceways), feed is designed only to supplement the naturally available food, and requires a lower to natural food (e.g., ponds or outdoor
raceways),
nutrient content, feed is designed
usually only to
with a focus onsupplement
providing extra the naturally available food,and
protein, carbohydrates, andlipids
requires
[23]. a lower
nutrient
Complete content,
dietsusually with a focus
will contain the idealon providing
levels ofextra protein,
protein, carbohydrates,
lipids, carbohydrates,and lipids [23].
minerals,
Complete diets will contain the ideal levels of protein,
phosphorous, and water, which make up the essential ingredients in fish feed [23]. Table 5 compares lipids, carbohydrates, minerals,
the phosphorous,
optimal rangesand water,essential
of these which make up the to
ingredients essential
the resultsingredients
measured in fish feed dehydrated
for each [23]. Table 5outputcompares
the optimal
material. ranges of these
The dehydrated foodsessential
generally ingredients
matched well to the withresults measuredlevels
the required for each dehydrated
of nutrients output
for fish
material.
feed. The dehydrated
Three sources (cafeteria, foods generally
hospital, matched
and tofu well with
processor) the required
satisfied levels
five of the sixofcategories
nutrients andfor fish
onefeed.
source Three sources
(grocery (cafeteria,
store) satisfiedhospital,
all six. andThetofu processor)
category that was satisfied
most five of the six
frequently categories and
mismatched wasone
source (grocery
carbohydrate levels, store)
where satisfied
the outliers all showed
six. Thehighercategory levels that
thanwas most frequently mismatched was
required.
carbohydrate
One categorylevels, to notewhere the outliers
is protein content,showed higher levels
as it is usually the mostthan required.ingredient in fish feed.
expensive
Even though One all
category to note is foods
the dehydrated protein content,
fell as itoptimal
within the is usually the of
range most expensive
18–50%, ingredient
they were in fishat
consistently feed.
Even though all the dehydrated foods fell within the optimal range
the lower end of the spectrum, ranging between about 18–27%. Most aquaculture feeds fall above this of 18–50%, they were consistently
at the
range lower end
for specific fish,ofbut
thethat
spectrum,
is also ranging between about
largely dependent on the18–27%. Most aquaculture
environment in which they feeds fall above
are reared
this
(high vs.range for specific
low density) and fish,
whatbut kindthat is also
of diet theylargely dependent onherbivorous,
have (omnivorous, the environment in which they
or carnivorous) [23].are
reared
A recent (high
trendvs.shows
low density)
an increased and use what kind of
of lipids diet foods,
in fish they have
in large(omnivorous,
part to try toherbivorous,
offset costs or
carnivorous)
of protein, so the[23].
levels of lipids in most of the dehydrated foods showed encouraging levels [23].
AlthoughAfound recentintrend
almost shows an feed,
all fish increased use of lipids
carbohydrates in fish
are not foods,toinaquaculture
essential large part to try as
diets to they
offsetare
costs
of protein, so
an inexpensive the levels
source of lipids
of energy. Becausein most of the higher
of this, dehydrated levels foods showed encouraging
of carbohydrates found across levels
most[23].
Although
of the dehydrated found in almost
food all fish feed,
waste outputs are not carbohydrates
of major concern. are not essential to aquaculture diets as they
are an inexpensive source of energy. Because of this, the higher levels of carbohydrates found across
most of the dehydrated food waste outputs are not of major concern.Sustainability 2020, 12, 5959 8 of 13
Table 5. Attribute comparison between dehydrated food waste and fish feed. (Bolded cell indicates
value within optimal range).
Relevant Optimal Food Grocery Juice Tofu
Restaurant Cafeteria Hospital
Attributes Range Bank Store Processor Processor
Protein (%) 18–50 21.2 20.1 18.7 19.3 21.1 20 27.2
Lipid (%) 10–25 6.7 21.5 21.2 13.6 23.6 6.8 18.7
Carbohydrate (%) 15–20 25.6 27.6 14.8 27 20.6 18.4 46.1
Ash (%)Sustainability 2020, 12, 5959 9 of 13
Table 6. Cont.
Optimal Maximum Food Juice Tofu
Relevant Attributes Restaurant Cafeteria Hospital Grocery
Range Tolerable Level Bank Processor Processor
Micro Minerals (ppm)
Copper (ppm) 10 100 4 4 3 3 3 29 6
Iron (ppm) 50 1000 53 63 36 48 37 150 48
Manganese (ppm) 20–40 1000 8 22 8 11 9 14 11
Zinc (ppm) 30 500 29 21 18 24 31 15 23
3.7. Pelletized Fuel
We further investigated the energy content of the dehydrated food waste in terms of heating
potential if used as a pelletized fuel. This was performed by testing the material for gross caloric value,
also referred to as higher heating value (HHV), with units of MJ/kg (Table 7). Cherry pits were another
waste stream that was identified, along with the juice processing waste mentioned in the previous
sections. However, the pits were only tested for energy content and are therefore only included in the
pelletized-fuel data summary.
Table 7. Attribute comparison between dehydrated food waste and pelletized fuel. (Bolded cell
indicates value within optimal range).
Optimal Food Juice Tofu
Relevant Attributes Restaurant Cafeteria Hospital Grocery Cherry Pits
Range 1 Bank Processor Processor
Higher heating value
>18.61 18.10 20.59 22.51 20.79 23.19 16.91 21.86 22.86
(MJ/kg)
1 From Chandrasekaran et al. [29].
It was observed that six of the eight materials showed HHVs greater than those found in
typical pelletized fuels. We did not perform testing of the dehydrated food output in a pellet stove,
and therefore cannot conclude whether the food waste would give off an odor when burned. Of the
materials analyzed, cherry pits proved to be best suited for an end use of pellet fuel because they
would provide a consistent, homogeneous waste stream with an already established market. However,
on a pure energy-per-weight basis, nearly all the dehydrated food wastes analyzed could be used as
pellet fuels, with only juice processor waste having HHV significantly below the minimum 18.61 MJ/kg
value based on the U.S. standard, which is in the same range as several European standards [29].
3.8. Variability Assessment
The results from both the input and output parameters were analyzed to understand how
dehydration of the food waste affected the variability of the output material properties. Since consistency
is a key factor when considering the end use of the dehydrated food waste, it was important to
understand if a highly variable input could be dehydrated to reduce the variability.
Fourteen key parameters were analyzed for the variability assessment, based on characteristics
important for the end uses investigated. These can be seen in the first column in Table 8.
Percent variability was first analyzed for the input and output materials alone by dividing the
difference between the maximum and minimum measured value for that parameter by the average
measured value. This analysis was performed by identifying the maximum and minimum measured
value for a given parameter within each input and output report. A difference was then calculated,
which was divided by the average of the five values in each category. For example, the maximum
measured value of crude protein of the inputs from all five sources was 7, while the minimum value
was 2.7, resulting in a difference of 4.3 (row 2, column 2, Table 8). The average crude protein across all
five sources was 5.28. So, dividing 4.3 by 5.28, we find a percent difference of 81% (row 2, column
3, Table 8). This calculation was performed for all 14 parameters for the inputs as well as outputs.
These percentages represent the variability across all five sources of food waste in terms of the 14
parameters analyzed. To analyze how this variability changed after dehydration, the percent differenceSustainability 2020, 12, 5959 10 of 13
of the output was subtracted from that of the input for each parameter (column 6, Table 8). A positive
percentage indicates that the variability decreased from input to output, whereas a negative percentage
indicates the variability increased. As can be seen in Table 8, the variability was decreased in 10 of the
14 parameters analyzed. Thus, it is reasonable to conclude that the Ecovim-66 system decreased the
variability of the food waste for most parameters considered.
Table 8. Attribute variation before and after dehydration of food waste.
Input Difference Input % Difference Output Difference Output % Difference Input−Output
Relevant Attributes
(Max−Min) (Max−Min/Average) (Max−Min) (Max−Min/Average) % Difference
Crude Protein (CP) 4.3 81.1% 2.5 12.4% 68.7%
Water Soluble Carbohydrates (WSC) 2.7 96.4% 8.7 93.9% 2.5%
Total Digestible Nutrients (TDN) 22 100% 26 30.3% 69.7%
Net Energy Maintenance 0.3 106.6% 0.4 40.5% 66.1%
Calcium (Ca) 1.8 441.2% 1.7 311.2% 130.0%
Phosphorus (P) 0.2 169.6% 0.1 31.8% 137.8%
Potassium (K) 0.1 46.7% 0.6 59.5% −12.8%
Sodium (Na) 0.1 59.3% 1.1 104.6% −45.3%
Iron (Fe) 6 62.5% 25 55.1% 7.4%
Zinc (Zn) 5 89.3% 12 50.8% 38.4%
Copper (Cu) 0 0.0% 1 28.6% −28.6%
Manganese (Mn) 2 100.0% 13 116.1% −16.1%
Sulfur (S) 0.1 156.3% 0.04 17.9% 138.4%
Gross Energy 1150 94.6% 1,217 24.2% 70.4%
One other food waste study found similar parameters that fall within the ranges we show
(see Table S8). Balaskonis et al. [11] found that with three household food waste dehydrators,
70–78% mass reductions were achieved; our analysis found 69–91% mass reductions across five food
sources. Volatile Solids (VS) for Balaskonis et al. [11] ranged from 85–95% for dehydrated output;
our study averaged 79–93%. The pH values for Balaskonis et al. [11] were slightly higher, ranging
from 4.71 to 5.58; our pH levels for five out of the seven sources ranged from 4.5 to 4.8. This variation
could reasonably be explained by the specific composition of food waste and the acidity of different
materials being dehydrated. As we witnessed, the pH levels of the liquid running out of the machine
were lower to start, so as the material dried, it became less acidic. Finally, the total organic carbon
(TOC) average for our study was 48.1% excluding food processors; Balaskonis et al. [11] found a range
of 47.6–54.9% TOC across three dehydrators. These parameters show that other researchers have found
similar results to ours which lends further credence to our work.
4. Conclusions
The bulk of the food waste dehydration analysis focused on characterizing various materials
to better understand how the variability of the inputs affects the variability in the outputs, and to
investigate alternative uses for the dehydrated food waste. The analysis of the end markets indicated
that dehydrated food waste was suitable for approximately half of the end uses analyzed. Based on
the parameters tested, the dehydrated material was analyzed for its suitability for use as a fertilizer,
input to composting, several types of animal feed, pelletized fuel, as well as input to pyrolysis to
produce biochar. Of these end uses, fish feed, pelletized fuel, and biochar were the best-suited
end uses. The materials showed nutrient levels that were well matched to fish feed in particular.
The macronutrients required for cattle feed were also well matched with most of the dehydrated
food wastes.
Most of the dehydrated materials showed high energy density, meaning that the MJ/kg of the
materials was quite high, lending itself well to being an effective substitute for pelletized fuel. Of the
dehydrated materials, cherry pits were most suited for this application because the opportunity to be
used in a higher value scenario (e.g., animal feed) is much lower in comparison to the mixed food waste.
Additionally, considering that there is an established market for cherry pits as pellet fuel, this is an
attractive option. The dehydrated food waste also showed promise as an input material for pyrolysis.Sustainability 2020, 12, 5959 11 of 13
The two applications having to do with agriculture (fertilizer or input for compost) were not well
matched to the measured characteristics of the dehydrated food waste, though the dehydrated food
could be composted if mixed with the appropriate organics. Low pH values presented a significant
challenge in this area, as they consistently fell below the necessary range of soil pH required for
the majority of plants. Moreover, even the best suited end uses come with barriers. In every case,
consistency in the properties of the dehydrated food waste presented the largest challenge, which is
critical if the material is to be sold on a commercial level. Even though the dehydration process
generally decreased variability of the material properties, variation was still found between dehydrated
outputs from different mixed food wastes. For animal feed, this concern can be mitigated by working
directly with local farms rather than commercially selling a product. In addition, laws related to animal
feeding in New York State prohibit post-consumer food of any kind from being fed to animals, so extra
care would need to be taken by the customer to properly separate food if the desired end use is to
produce animal feed.
Food waste dehydration provides a unique food waste management solution that should be
considered as a viable alternative to the established pathways of direct composting and anaerobic
digestion. In addition to providing a compact and simple to use on-site solution, it mitigates concerns
of storing raw food waste, which can be of concern, especially in urban or vermin-prone environments.
This also allows for the flexibility of less frequent pick-ups. Thus, producing a product from organic
waste that can be sold and utilized in a more beneficial way than pure landfilling is an outcome that
more institutions can strive for by utilizing food waste dehydration technologies.
Supplementary Materials: The following are available online at http://www.mdpi.com/2071-1050/12/15/5959/s1:
Table S1: Full list of parameters tested; Table S2: Measured density of output materials from five sources;
Table S3: Total solids and total volatile solids triplicate measurement data for output (dehydrated food waste);
Table S4: Total solids and total volatile solids triplicate measurement data for input (raw food waste); Table S5:
Data collection for five sources of food waste processed through Ecovim-66; Table S6: Parameter analytical
methods; Table S7: Optimal ranges; Table S8: Measured output sample parameters.
Author Contributions: All the experiments were designed and performed by A.L.L. and J.T.S., and all three
authors contributed to data analysis and manuscript preparation. All authors have read and agreed to the
published version of the manuscript.
Funding: The New York State Pollution Prevention Institute (NYSP2I) at the Rochester Institute of Technology
(RIT) contributed to this research through its Green Technology Accelerator Center (GTAC). Funding was provided
by the Environmental Protection Fund as administered by the NYS Department of Environmental Conservation.
© 2020 Rochester Institute of Technology. Any opinions, results, findings, and/or interpretations of data contained
herein are the responsibility of Rochester Institute of Technology and its NYS Pollution Prevention Institute and
do not necessarily represent the opinions, interpretations or policy of New York State.
Acknowledgments: The authors would like to extend special thanks to Myron and Leah Alexander (OWARECO,
LLC) for providing the Ecovim-66 unit to the NYSP2I team for the experimental campaign described in this
paper. We also acknowledge Dan Smith for his leadership role through the GTAC program, Kathleen Draper for
providing her expertise on the subject of biochar, and Steven Barber for providing food processing samples and
valuable information for the analysis.
Conflicts of Interest: The authors declare no conflict of interest. The funders had no role in the design of the
study; in the collection, analyses, or interpretation of data; in the writing of the manuscript, or in the decision to
publish the results.
References
1. Rethink Food Waste through Economics and Data. A Roadmap to Reduce U.S. Food Waste by 20 Percent.
Available online: https://www.refed.com/downloads/ReFED_Report_2016.pdf (accessed on 13 December 2016).
2. Lin, C.S.K.; Pfaltzgraff, L.A.; Herrero-Davila, L.; Mubofu, E.B.; Abderrahim, S.; Clark, J.H.; Koutinas, A.A.;
Kopsahelis, N.; Stamatelatou, K.; Dickson, F.; et al. Food waste as a valuable resource for the production
of chemicals, materials and fuels: Current situation and global perspective. Energy Environ. Sci. 2013, 6,
426–464. [CrossRef]
3. Hegde, S.; Lodge, J.S.; Trabold, T.A. Characteristics of food processing wastes and their use in sustainable
alcohol production. Renew. Sustain. Energy Rev. 2018, 81, 510–523. [CrossRef]Sustainability 2020, 12, 5959 12 of 13
4. Xu, F.; Li, Y.; Ge, X.; Yang, L.; Li, Y. Anaerobic digestion of food waste: Challenges and opportunities.
Bioresour. Technol. 2018, 247, 1047–1058. [CrossRef] [PubMed]
5. Pinacho, A.; García-Encina, P.A.; Sancho, P.; Ramos, P.; Márquez, M.C. Study of drying systems for the
utilization of biodegradable municipal solid wastes as animal feed. Waste Manag. 2006, 26, 495–503.
[CrossRef] [PubMed]
6. San Martin, D.; Ramos, S.; Zufía, J. Valorisation of food waste to produce new raw materials for animal feed.
Food Chem. 2016, 198, 68–74. [CrossRef] [PubMed]
7. Hall, M. Techno-environmental analysis of generating animal feed from wasted food products.
Master’s Thesis, Rochester Institute of Technology, Rochester, NY, USA, July 2016.
8. Sotiropoulos, A.; Malamis, D.; Loizidou, M. Dehydration of domestic food waste at source as an alternative
approach for food waste management. Waste Biomass Valoriz. 2015, 6, 167–176. [CrossRef]
9. Sotiropoulos, A.; Bava, N.; Valta, K.; Vaakalis, S.; Panaretou, V.; Novacovic, J.; Malamis, D. Household
food waste dehydration technique as a pretreatment method for food waste minimization. Int. J. Environ.
Waste Manag. 2016, 17, 273–286. [CrossRef]
10. Sotiropoulos, A.; Malamis, D.; Michailidis, P.; Krokida, M.; Loizidou, M. Research on the drying kinetics
of household food waste for the development and optimization of domestic waste drying technique.
Environ. Technol. 2016, 37, 929–939. [CrossRef] [PubMed]
11. Balaskonis, A.; Vakalis, S.; Sotiropoulos, A. Comparison of 3 household food waste dryers in the context of
food waste prevention and bioeconomy. SN Appl. Sci. 2019, 1, 648. [CrossRef]
12. Karthikeyan, O.P.; Trably, E.; Mehariya, S.; Bernet, N.; Wong, J.W.; Carrere, H. Pretreatment of food waste for
methane and hydrogen recovery: A review. Bioresour. Technol. 2018, 249, 1025–1039. [CrossRef] [PubMed]
13. Sotiropoulos, A.; Vourka, I.; Erotokritou, A.; Novakovic, J.; Panaeetou, V.; Vakalis, S.; Thanos, T.; Moustakas, K.;
Malamis, D. Combination of decentralized waste drying and SSF techniques for household biowaste
minimization and ethanol production. Waste Manag. 2016, 52, 353–359. [CrossRef] [PubMed]
14. Ecovim. Available online: http://www.ecovimusa.com/products/ (accessed on 5 January 2017).
15. Handbook of Plant Nutrition; Barker, A.V.; Pilbeam, D.J. (Eds.) CRC Press: Boca Raton, FL, USA, 2015.
16. Longstroth, M. Soil Test before You Plant Blueberries. Available online: https://www.canr.msu.edu/news/
soil_test_before_you_plant_blueberries (accessed on 17 January 2017).
17. Dickson, N.; Richard, T.; Kozlowski, R. Composting to Reduce the Waste Stream-A Guide to Small Scale Food and
Yard Waste Composting; Northeast Regional Agricultural Engineering Service: Ithaca, NY, USA, 1991.
18. Cooperband, L. The Art and Science of Composting. Available online: https://www.cias.wisc.edu/wp-
content/uploads/2008/07/artofcompost.pdf (accessed on 23 January 2017).
19. Vakalis, S.; Sotiropoulos, A.; Moustakas, K.; Malamis, D.; Vekkos, K.; Baratieri, M. Thermochemical
valorization and characterization of household biowaste. J. Environ. Manag. 2017, 203, 648–654. [CrossRef]
[PubMed]
20. Biochar for Environmental Management: Science, Technology and Implementation, 2nd ed.; Lehmann, J.;
Joseph, S. (Eds.) Routledge: London, UK, 2015.
21. Ahmed, I.I.; Gupta, A.K. Pyrolysis and gasification of food waste: Syngas characteristics and char gasification
kinetics. Appl. Energy 2010, 87, 101–108. [CrossRef]
22. Joseph, S.; Taylor, P.; Cowie, A. Basic Principles and Practice of Biochar Production and Kiln Design.
Available online: https://biochar.international/guides/basic-principles-of-biochar-production/#introduction
(accessed on 25 January 2017).
23. Craig, S.; Helfrich, L.A.; Kuhn, D.; Schwarz, M.H. Understanding Fish Nutrition, Feeds, and Feeding.
Available online: https://fisheries.tamu.edu/files/2019/01/FST-269.pdf (accessed on 7 November 2016).
24. Rust, M.; Barrows, F.T.; Hardy, R.W.; Lazur, A.M.; Naughten, K.; Silverstein, J.T. The Future of Aquafeeds.
Available online: https://spo.nmfs.noaa.gov/sites/default/files/tm124.pdf (accessed on 7 November 2016).
25. Nutrient Requirements of Beef Cattle, 8th ed.; National Academies Press: Washington, DC, USA, 2016.
26. Hall, J.B. Nutrition and Feeding of the Cow-Calf Herd: Production Cycle Nutrition and Nutrient Requirements
of Cows, Pregnant Heifers and Bulls. Available online: https://www.pubs.ext.vt.edu/400/400-012/400-012.
html (accessed on 10 November 2016).
27. Hilton, W.M. Merck Vet Manual. Available online: https://www.merckvetmanual.com/management-and-
nutrition/nutrition-beef-cattle/nutritional-requirements-of-beef-cattle (accessed on 13 December 2016).Sustainability 2020, 12, 5959 13 of 13
28. University of Georgia Extension. Mineral Supplements for Beef Cattle. Available online: https://secure.caes.
uga.edu/extension/publications/files/pdf/B%20895_4.PDF (accessed on 11 January 2017).
29. Chandrasekaran, S.R.; Hopke, P.K.; Rector, L.; Allen, G.; Lin, L. Chemical composition of wood chips and
wood pellets. Energy Fuels 2012, 26, 4932–4937. [CrossRef]
© 2020 by the authors. Licensee MDPI, Basel, Switzerland. This article is an open access
article distributed under the terms and conditions of the Creative Commons Attribution
(CC BY) license (http://creativecommons.org/licenses/by/4.0/).You can also read