Horowhenua Waste Minimisation and Management Plan
←
→
Page content transcription
If your browser does not render page correctly, please read the page content below
Horowhenua
Waste Minimisation
and Management Plan

              Horowhenua Waste Minimisation and Management Plan   1
2 Horowhenua District Council
Contents   Part A - Strategy

           1. Introduction		                                       4

           2. The Waste Situation	                                5
               2.1 Infrastructure and Services		                 5
               2.2 Volume and Composition of Waste              12
               2.3 Summary of District-Specific Issues          18

           3. Policies, Plans and Regulation                    19
               3.1 Summary of Guiding Policies, Plans           19
               and Legislation that Affect the WMMP
               3.2 Statutory Requirements                       20

           4. Vision Goals, Objectives and Targets               21
               4.1 Background		                                  21
               4.2 Visions, Goals, Objectives and Targets        22
               4.3 Council’s Intended Role                       25
               4.4 Protecting Public Health                      25

           5. Options for Achieving Effective and               26
              Efficient Waste Management and
              Minimisation
               5.1 Introduction                                 26
               5.2 Identifying Options                          27
               5.3 Options for the Future                       29

           6. Funding the Plan                                  31
               6.1 Plan the Implementation Funding              31
               6.2 Grants and Advances of Monies                31
               6.3 Waste Minimisation Levy Expenditure          31

           7. Monitoring, Evaluating and                        32
              Reporting Progress
               7.1 Monitoring and Evaluation                    32
               7.2 Reporting                                    33

           Part B - Action Plan

           8. Introduction		                                     34

           9. Funding structure	                                34
               9.1 Plan Implementation Funding	                 34
               9.2 Grants and Advances of Monies                34
               9.3 Waste Minimisation Levy Expenditure          35

           10. Targets and Measurements                         35
           11. Action Plan                                       38
               11.1 Action Planning Tables		                     40

           12. Applicability                                     44

                             Horowhenua Waste Minimisation and Management Plan   3
Part A - Strategy
1. Introduction
Purpose of the Plan
This Waste Minimisation and Management Plan             This WMMP fulfils Council’s obligations under the
(WMMP) sets out how the Council will progress           Waste Minimisation Act (WMA) (2008). The plan
efficient and effective waste management and            uses the waste hierarchy (Figure 1) as a guide to
minimisation in the Horowhenua District.                prioritising activity, focussing on reducing waste
It paves the way forward, considering current policy    before recycling or recovery of materials. Where
and legal framework and the Horowhenua District         materials cannot be recycled or recovered the focus
vision, with an overarching suite of guiding goals      is on safe treatment and disposal.
and objectives.

         Figure 1: The Waste Hierarchy.

Scope of Plan                                           and management activity in the Horowhenua District
                                                        from 2018 to 2024.
This WMMP and associated Waste Assessment
covers solid waste generated in the Horowhenua          Plan Review
District.
                                                        Once adopted this plan needs to be reviewed no
                                                        later than 6 years from adoption. The plan will
Current Status of Plan
                                                        be reviewed within this timeframe, or earlier if a
March 2018                                              change in circumstances provokes a review of
                                                        Horowhenua’s waste minimisation and management
This document will be revised and updated following
                                                        policy framework.
public consultation prior to being adopted by Council
as a framework and guide for waste minimisation

4    Horowhenua District Council
2. The Waste Situation
2.1 Infrastructure and Services
2.1.1 Collection
The collection system for the Horowhenua District is
represented schematically in Figure 2.

Figure 2: Horowhenua District waste collection system (2016 figures).

2.1.1.1 Residential Collection                           the district (95% of residents have access to a
                                                         kerbside service). Alternatively, the public may
Levin Container Rubbish (LCR) collects refuse
                                                         take household refuse and recycling to the transfer
bags throughout the district on behalf of Council.
                                                         stations across the district, see Section 2.1.2.1.
LCR also provides a kerbside recycling service as
a sub-contractor to EnviroWaste Services Limited
(ESL). LCR, Low Cost Bins, ESL, Lucy’s Mini Bins         Collection frequency is generally weekly although
and Waste Management NZ Limited (WMNZ) offer             commercial services are offered on a fortnightly
wheelie bin collection services for households on        or monthly basis. Garden waste collections are
a commercial basis. LCR collect Council bags and         available on a commercial basis.
their own wheelie bins at the same time. This allows
LCR to service rural areas with the higher cost          Health and safety is an important issue for the
(lower property density) shared between Council          collection of refuse and recycling with key risks
bag and LCR’s private customers.                         including operating in a live traffic environment,
                                                         manual handling of refuse bags and recycling
Kerbside collection of refuse in bags and recycling      crates, dangerous items in refuse and recycling
in crates is available in urban and rural areas in       (broken glass, needles, putrescible materials).

                                                            Horowhenua Waste Minimisation and Management Plan   5
Common approaches to eliminating or mitigating           systems where some material is recovered and
these risks include:                                     recycled (paper and cardboard) and organic
                                                         material (food waste) is diverted with only residual
•   Automated collection e.g. wheelie bins, often
                                                         waste disposed of at local Landfill.
    with remote lifting arms for refuse and recycling
    containers.
                                                         2.1.1.3 Litter and Illegal Dumping
•   Specialised collection vehicles with left hand
                                                         Litter bins are provided in the urban centres and
    drive, standing driving position, low entry and
                                                         popular visitors spots throughout the District.
    side loading.
                                                         Litter bin collection is undertaken by Recreational
The Horowhenua collection services address some,         Services Limited (Parks and Gardens) and Higgins
but not all of the safety risks inherent in refuse and   (Road Network Maintenance) with their scope
recycling collection services.                           currently including:

The recycling collection involves manual emptying        •   Litter bin emptying.
of recycling crates into the collection vehicle with
                                                         •   Cleaning up after fly tipping.
sorting of materials at the LCR yard in central Levin.
The glass recovered from the kerbside crates is          Illegal dumping does occur including adjacent to
currently stockpiled at Levin Landfill and used for      transfer stations when they are closed.
drainage or other construction activity. In some
cases the glass is too contaminated with other
materials and only suitable for disposal with general
                                                         2.1.2 Waste Transfer, Processing
waste.                                                   and Disposal
                                                         2.1.2.1 Transfer Stations and Recycling Drop-off
2.1.1.2 Commercial or Industrial Waste
                                                         Transfer stations, where waste can be dropped
Waste (both refuse and recycling) from commercial        off by the public, are located at Levin (owned
and industrial premises in Horowhenua District           and operated by MidWest Disposals Ltd), Foxton
is currently collected and disposed of via Levin         and Shannon. Static recycling drop-off points are
Transfer Station, direct to market or directly to        provided year round at Levin, Foxton, Shannon,
Levin Landfill. No data is currently available about     Opiki and Tokomaru with seasonal sites at Foxton
materials collected for recycling, treatment or          Beach, Waitarere and Waikawa. The sites are
disposal out of the District. Many national business     operated under contract to HDC except Levin
with a local presence have comprehensive waste           Transfer Station.
management and recycling systems in place, for
example Progressive Enterprises (Countdown),
Food Stuffs (New World, Pak n Save) and the
Warehouse Group all operate waste management

6    Horowhenua District Council
All of the green waste and most of the glass             •   There is a risk of falls into the bins or
captured at the transfer stations and recycling              transfer pit during unloading, sometimes
stations is used at Levin Landfill. Glass from Foxton        managed by dumping of material on a ‘flat
Transfer station is taken to Palmerston North’s              floor’ with pushing/loading undertaken by
Awapuni Resource Recovery Park for recovery                  transfer station staff.
and transported to Auckland for recycling. Glass is
used at Levin Landfill for construction (drainage,       •   Flat floor designs can enable basic
roads) unless it is too contaminated. Garden waste           sorting before pushing waste into bins
is shredded and mulched prior to use to make soil            or transfer pit.
conditioner for landfill capping.                        •   Considering amended opening hours.
No weighbridge is currently installed at the Council     The recycle stations are of variable age with
operated transfer stations. Material from these sites    condition reflecting the period of time they have
is weighed as it enters Levin Transfer Station and/      been in operation.
or using local weighbridges e.g. Turks in Foxton.
This means loads entering the transfer stations          The Levin Transfer Station accepts well over 10,000
are charged on the basis of an assumed weight or         tonnes of material each year and is configured
estimated volume.                                        with a relatively steep constructed ramp to allow
                                                         users to load materials directly into huka bins for
The Council operated transfer stations are in            transport to Levin Landfill. While the transfer station
reasonable condition and have adequate space             is a Midwest Disposal facility the site would benefit
for the quantity of material they are required to        from re-development and there may be potential for
manage. Both sites are configured with a raised          Council to be involved in the development process.
off-loading area with waste deposited directly into
the pit (Foxton) or Huka bins (Shannon). There           The Horowhenua District waste management
is potential to make changes from an operational         system and estimated quantities for 2016 are
and health and safety perspective at each site.          presented in Figure 3. Facility details are provided
Examples could include:                                  on the following pages. Figure 3 is a screen
                                                         shot from a model of the Horowhenua waste
•   Moving away from the general public                  management system developed for the Waste
    loading into the transfer pit (Foxton) or huka       Assessment.
    bins (Shannon).

Figure 3: Waste flow diagram - collection, processing and disposal (2015/16 figures).

                                                             Horowhenua Waste Minimisation and Management Plan   7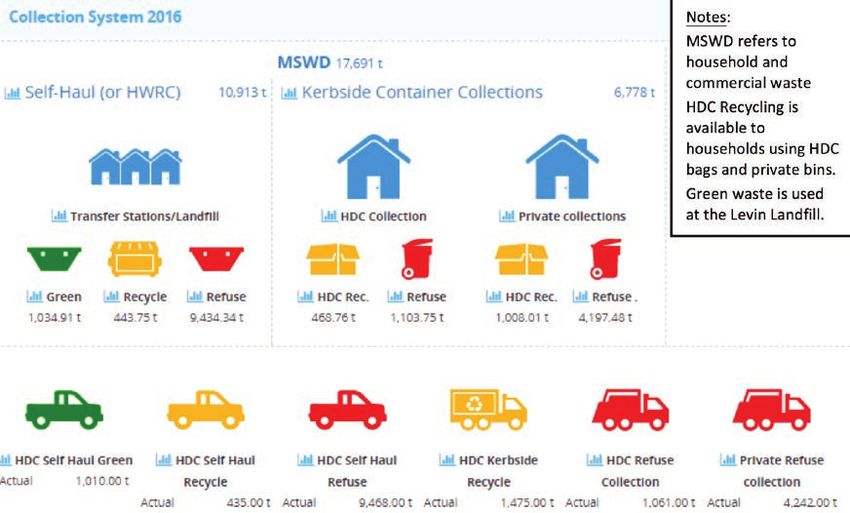
2.1.2.2 Materials Processing                                           Garden waste from Levin and Foxton Transfer
                                                                       stations is shredded and stockpiled at Levin Landfill.
LCR operate a basic sort line for recyclable                           The resulting mulch is used as a soil conditioner at
materials collected at the kerbside. This is currently                 Levin Landfill (borrow area and former landfill cells).
operating at capacity and delivers mixed quality
of materials. Glass is currently stockpiled at Levin                   Energy
Landfill and used in the place of aggregate at the
                                                                       Mitchpine Products Limited, north of Levin, have a
landfill site. Other materials are marketed by LCR.
                                                                       wood waste fired boiler supplying a portion of the
Commercial recyclables are handled through LCR,                        heat requirements for their site.
consolidated on some sites (e.g. major retailers like
supermarkets) or transported out of the district for
                                                                       2.1.3 Landfills
consolidation and market or re-processing.                             The Levin Landfill is located 8km west of Levin on
                                                                       Hokio Beach Road. The site was developed by
2.1.2.3 Markets for Recyclable Materials                               Council. The day to day operation of the landfill is
                                                                       contracted to Midwest Disposals Limited (Midwest).
Paper, plastics and cans are consolidated and                          The current contract for landfill operations and
processed in New Zealand (cardboard, some                              management expires in 2021.
plastics, and colour separated glass) or exported
for re-processing (some plastics, some paper,                          All residual waste from the district is transported to
scrap metals). International markets for recyclable                    Levin Landfill. The landfill has sufficient volume to
materials are subject to periodic uncertainty with                     provide refuse disposal for the Horowhenua District
the most recent (late 2017, early 2018) being the                      for well in excess of the consented period of 20
China’s National Sword initiative that seeks to                        years. Current operations including accepting over
improve the quality of recyclable materials imported                   15,000 TPA from Kapiti Coast District with current
into China.                                                            projections suggesting the site will be completed
                                                                       around 2030.
At the time of writing (early 2018) a number of
New Zealand local authorities are advocating                           A key aspect of the arrangement with Midwest is
strongly for a container deposit scheme similar to                     the disposal of materials from Kapiti controlled
those in place in many states in Australia. Typical                    by Midwest. This additional tonnage significantly
proposals target beverage containers with a small                      reduces the per tonne cost of operating the Levin
refund payable on their return to an approved                          Landfill. Detailed analysis of the costs and revenue
reception point. Introduction of this type of scheme                   for the landfill operation indicates operating the
is likely to have an impact on recyclable material                     landfill for Horowhenua sourced waste only would
markets with recovery rates likely rising (increasing                  increase the per tonne cost significantly and
supply). In some cases kerbside recycling schemes                      may make out of district disposal more attractive
are able to claim refunds for eligible materials                       financially.
i.e. the scheme could provide another source of
                                                                       Landfill charges reflect capital and operating costs
revenue for kerbside recycling.
                                                                       and the landfill levy ($10 per tonne at the time of
                                                                       writing). The current government have indicated
2.1.2.4 Other Processing
                                                                       their intention to examine waste policies including
Composting                                                             the waste levy. This may result in changing the levy
                                                                       including increasing the amount charged per tonne
Paranui Organics use wood waste and poultry                            and/or expanding the range of facilities subject to
manure to produce compost for sale to the general                      the levy1.
public and garden centres around the lower central
north island. Their processing site is located north
of Foxton.

1
    For example construction and demolition or industrial landfills.

8         Horowhenua District Council
2.1.4 Cost for Waste Management
2.1.4.1 Council Funding
The 2015-25 Long Term Plan sets the budget for the
waste management activity with provision to make
amendments if required through the Annual Plan
process. Funding for operations is through targeted
rates and user charges. Funding for capital projects
is from general rates. Expenditure is dominated
by payments to contractors with finance costs and
internal charges also featuring. This mix of funding
and expenditure is projected in the 2015-2025
Long Term Plan to continue to 2025.

Refuse collection and transfer station services
attract user charges. The user charges at Council
operated transfer stations do not cover the full cost
of providing the service with the shortfall covered
from the targeted rate for waste management and
general rates. The user charges for refuse collection
(via bag sales) cover the full costs of providing the
service with a small surplus.

This approach is consistent with the principles set
out in the 2012 WMMP whereby Council costs for
waste management services are, where possible,
covered by the users of that service.

The kerbside recycling services are funded by
a levy on all refuse collection services. Private
service providers can either provide their own
service or contract with the Council contractor to
do so. In most cases they work with the Council
contractor with Council paying a management fee
and a contribution based on their market share
for refuse collection. This a relatively complex
arrangement for funding recycling and in practice
the Council management fee appears to fund a
large component of the recycling activity.

                                                        Horowhenua Waste Minimisation and Management Plan   9
2.1.4.2 User Charges
                                                                                    Collection and transfer station services attract
Proposed rates for kerbside collection include                                      user charges. The user charges at Rural Transfer
(2017/18 figures):                                                                  stations do not cover the full cost of providing the
•       Council refuse bag (60 L): $4.00 per bag2.                                  service with the shortfall covered from the targeted
                                                                                    rate for waste management. The user charges
•       Commercial wheelie bin services3:                                           for refuse collection (via bag sales) cover the full
                                                                                    costs of providing the service and contribute to
        •      $150 - $190/year for an 80L bin.
                                                                                    the recycling service. When compared with similar
        •      $250 - $400/year for bins ranging in size                            areas bag prices are high but this reflects the
        		     from 120 - 240 L.                                                    contribution towards the cost of kerbside recycling.

Table 1: Refuse bag retail costs - selected New Zealand councils

      Area                                                           Refuse Collection                          Bag Charges
      Horowhenua                                                     Council - bags                             $4.00/bag

      Palmerston North                                               Council - bags                             $2.60/bag

      Manawatu District                                              Council - bags                             $1.60/bag

      Hastings                                                       Council - bags                             $2.40/bag

      New Plymouth                                                   Council - bags                             $3.30/bag

      Porirua, Wellington, Lower Hutt                                Council - bags                             $2.50/bag

      Whangarei                                                      Council - bags                             $2.80/bag

      Far North                                                      Commercial - bag                           $3.00/bag

      Kaipara                                                        Council - bags                             $3.00/bag

2
    Including $1.00 per bag contribution to kerbside recycling service.
3
    Based on a review of prices published on service provider’s websites, recycling contributions not stated.

10           Horowhenua District Council
Table 2: Horowhenua Rubbish and recycling - fees and charges
Activity/Service Charge
Activity/Service
Levin Council
Disposal of official HDC Refuse Bag (up to 4) $5 Free
Disposal of Private Plastic Bags (2.2 Volume and Composition of Waste Data is presented in Table 3 and Figure 6.
and Diverted Materials Key points to note include:
2.2.1 Waste Composition • Putrescible material (garden waste and food
scraps) make almost 50% of waste collected
Waste composition audits provide information from households and almost a quarter of waste
about the make-up of a waste stream, and can disposed of to landfill.
help identify materials that make up large or
disproportionate parts of the waste stream to target • Plastic is a significant portion of the waste
when forming waste management and minimisation stream. More detailed data for other districts
strategies. For this Waste Assessment typical suggests a significant portion of plastics are
waste composition data is used rather than data those that are not collected for recycling.
specific to Horowhenua District.This provides a • Timber and rubble are significant for general
general indication of likely waste composition in the landfilled waste.
Horowhenua District.
Table 3: Waste composition
Primary Category Kerbside collection Direct to landfill
Paper 9% 9%
Plastic 17% 20%
Nappies 12% 5%
Glass 4% 2%
Putrescibles 49% 23%
Textiles 5% 6%
Potential Hazardous 1% 5%
Ferrous Metals 2% 3%
Non-Ferrous Metals 1% 1%
Rubber 0% 2%
Timber 0% 13%
Rubble 1% 11%
Total 100% 100%
12 Horowhenua District CouncilFigure 6: Refuse Composition - kerbside and landfilled.
Material taken directly to landfill or transfer station
(self haul) material tends to have a larger proportion
of bulky items (timber, rubble) and the putrescible
fraction has a higher proportion of garden rather
than food waste.
Horowhenua Waste Minimisation and Management Plan 132.2.2 Kerbside and Self Haul Waste commercial collection services. Council also offer
Quantities a crate based kerbside recycling service. Table 4
provides a summary of materials collected from
2.2.2.1 Kerbside Waste Quantities the kerbside in the Horowhenua District. The total
amount of refuse collected at the kerbside has been
As noted above, Kerbside refuse in Horowhenua
estimated using Council’s estimated market share of
is collected in compactor trucks and transported
20% based on total bag sales per annum. Average
to Levin Transfer station or landfill for disposal.
bag weight is assumed to be around 7kg reflecting
Households can use Council refuse bags (sold
typical bag weights around New Zealand.
at a range of retail outlets) or use one of several
Table 4: Horowhenua District - kerbside waste quantities 4
2013 2014 2015 2016
Kerbside Refuse Collection (estimated) 3,836 5,156 5,239 4,913
HDC recycle collection 600 600 1,569 1,705
Toal Kerbside Waste 4,436 5,756 6,808 6,618
Recycling Rate 14% 10% 23% 26%
2.2.2.2 Waste Quantities at Refuse Transfer
Stations and Landfill
Refuse and recyclable materials from the
Horowhenua District are either transported
directly to Levin Landfill or taken to one of three
transfer stations noted in Section 2.1.2.1. Table
5 summarises the quantity of materials managed
through the Horowhenua District transfer stations
and landfills.
4
Data sourced from waste collection and transfer station contract reporting and weighbridge records at Levin Transfer Station.
14 Horowhenua District CouncilTable 5: Horowhenua District - estimated waste quantities via transfer stations or direct to landfill 5
2013 2014 2015 2016
Refuse to Foxton and Shannon 677 1,044 1,018 1,323
Refuse to Levin transfer station 5,000 6,979 6,731 7,883
and to landfill
Recycle at transfer stations 870 935 1,580 1,563
Total waste to landfill (excluding 5,677 8,023 7,749 9,206
household collections)
Recycling rate (%) 13% 10% 17% 1%
Total waste landfilled 9,513 13,213 12,801 13,755
Total waste recycled 1,470 1,535 3,149 3,268
Recycling rate (%) 10% 20% 19% 17%
2.2.2.3 Unquantified Waste
There are several waste streams that are known to There is an increasing level of interest in rural waste
exist but are difficult to quantify. Examples include across New Zealand. As the rural sector considers
rural waste managed on farms, materials captured the implications of current waste management
as part of commercial activity (e.g. scrap metal, approaches it is likely that increasing quantities
industrial by-products, commercial recycling) and of materials from farming activities will enter the
waste materials managed within manufacturing Council waste management system, either via the
operations (e.g. biosolids from food processing transfer station network or through commercial
operations applied to land, wood processing on-farm collections.
residues). This means that both waste disposed to
landfill and waste diverted/recovered are likely to be
underestimated.
5
Data sourced from waste collection and transfer station contract reporting.
Horowhenua Waste Minimisation and Management Plan 152.2.3 Collection and Drop-off
System Performance
Combining the waste composition data with data
on the quantity of waste disposed of to landfill and
recycled provides a basis for determining the capture
of various materials ‘available’ in the waste stream6.
A summary assessment drawing on estimated
quantities and composition is presented in Table 6.
Table 6: Horowhenua waste management system performance
Bags/Bins General HDC Recovery
Composition Tonnes/yr Composition Tonnes/yr Composition Tonnes/yr
Total 100% 5,303 100% 9,468 2,920 17%
Paper/card 14% 731 10% 964 718 30%
Plastic 20% 1,077 21% 2,017 228 7%
Recyclable plastic 2% 125 1% 68 228 54%
Organics 49% 2,599 11% 1,057 1,010 22%
Garden organics 14% 757 4% 403 1,010 47%
Ferrous 2% 95 3% 297 48 11%
Non Ferrous 1% 40 1% 61 22 18%
Glass 4% 194 1% 116 882 74%
Timber 3% 150 15% 1,403 0 0%
Other 8% 415 38% 3,555 0 0%
The available data suggests there are opportunities • Overall plastic recovery is low but the data
to capture additional recyclable material through the suggests recovery of recyclable plastic is
transfer stations and kerbside collections including relatively high. Again it should be possible
organic material, timber, metals, paper, plastics and to increase the capture of materials at both
glass. Specifically: kerbside and transfer stations.
• Paper/cardboard recovery is a relatively low • Organic waste recovery is under-estimated
30%, it should be possible to increase the (there are no figures for material captured by
capture of paper and cardboard at both kerbside commercial collections) but there is a significant
and transfer stations.
6
From Table 3, Table 4 and Table 5
16 Horowhenua District Councilamount of material that could be targeted.
There is also a need to identify long term use for
material that is currently captured once capping is
completed on older areas of Levin Landfill.
• Metals recovery is likely to be under-estimated,
further detail is required on scrap dealer recovery
but the data suggests there may be materials
available for recovery in waste passing through
the transfer station network.
• Glass recovery is at a good level. Some of the
glass recovered is too contaminated for use and
is disposed of with general waste. Further work is
required to improve the quality of glass captured
at the kerbside and identify higher value markets
than the current use for low grade aggregate at
Levin Landfill.
As noted in Table 5, recovery via transfer stations
is around 20 %. This suggests there is potential
to increase the recovery of materials with a focus
on areas with low recovery and reasonable value.
Examples include paper/cardboard and metals.
There are other materials present in the waste stream
that require careful management to avoid negative
impacts. These include:
• Hazardous waste (chemicals, e-waste, used oil,
asbestos).
• Difficult or special waste (tyres, bulk waste, dead
animals).
• General waste (household and commercial
waste).
• Rural waste - waste from the business of farming
including agricultural plastics (wrap and chemical
containers), unwanted chemicals, timber and
machinery (including maintenance related waste
like used oil).
• Waste from major processing sites - examples
include waste treatment residuals (for example
sludge), packaging (pallet wrap, broken pallets)
and containers (cleaners, ingredients, oil).
Horowhenua Waste Minimisation and Management Plan 172.3 Summary of District-Specific • There is potential for changes in how the waste
Issues levy is applied (levy rate, types of facilities
covered).
2.3.1 Waste Infrastructure - Issues Identified
• There is potential for the introduction of a
In collating and considering information about container deposit scheme in New Zealand (that
the delivery of waste services in the Horowhenua would have an impact on the value of recyclable
District, a number of issues were identified. These materials).
issues represent challenges in delivering effective
services and achieving the aims of the NZ Waste 2.3.2 Waste data - issues and constraints
Strategy - reducing environmental harm and While there is some information available about the
maximising resource efficiency. In many cases the quantity and composition of waste generated in the
issues also present opportunities for Council, the Horowhenua District the data is incomplete.
community and/or the private sector to improve The available data needs to be interpreted
waste minimisation and management in the District. considering that:
The issues identified include: • There is a mix of volume based estimates and
• Illegal dumping of waste as an ongoing issue measured weights.
including at transfer station gates when closed. • The source of waste is not always clear.
• The Foxton and Shannon transfer stations • There is limited data on market share, coverage,
and network of recycling drop-off points are set out rate or participation rates for kerbside
subsidised by rates. collection or refuse and recyclable material.
• The cost for refuse bags is high compared to • The data regarding quantity of waste collected
neighbouring Council areas. or processed is not complete. For example:
• Rural residents are offered a roadside collection • The quantity of waste composted by
service (refuse and recycling) that is costly to commercial composters has not been
operate on a per resident and per tonne basis. quantified.
• The funding arrangements for kerbside recycling • The quantity of waste collected from
are complex. commercial premises for recycling.
• Glass and garden waste are currently used at • The quantity of waste generated on rural
Levin Landfill, there are likely to be higher value properties and processed or disposed on
uses for these materials. site.
• Commercial and construction waste makes up There is a by-law in place (refer Section 3) that
a large proportion of material disposed of to provides for collection of data on collection services
landfill from the Horowhenua District with limited including quantities of material collected, destination
information available regarding diversion activity for disposal or processing and coverage, set out
focussed on these waste streams. and participation rates. Implementation of the data
• The current kerbside collection service for provisions in the by-law in close consultation with
recyclable materials poses health and safety collection and processing companies operating in
risks (broken glass, manual handling) and the Horowhenua District will improve the availability
limited capacity. and quality of data available.
• Cost of services and sources of revenue may There is also potential to improve the reporting of
change over time. waste materials handled by contractors on behalf
of Council. Reporting on activity as part of contract
• Increase or decrease in materials disposed of obligations should include appropriately detailed
(and associated costs and revenue) at Levin reporting on waste source, quantity and destination.
Landfill.
• Value of recyclable materials may vary on New
Zealand and international markets.
18 Horowhenua District Council3. Policies, plans and regulation
3.1 Summary of Guiding Policies, Plans
and Legislation that Affect the WMMP
There is wide a range of statutory documents
and associated policy that impacts on waste
minimisation and management in the Horowhenua
District. These are summarised in Table 7, further
detail is provided in the Horowhenua Waste
Assessment (2018).
Table 7: Selected relevant policy for waste in Horowhenua District
National Manawatu - Whanganui Region Horowhenua
Waste Minimisation Horizons One Plan Long Term Plan
Act 2008 2015-2025
Health Act 1956 Horowhenua District Plan
Hazardous Substances and Solid Waste
New Organisms Act 1996 Management Bylaw
including licence terms
and conditions
Resource Management Solid Waste Asset
Act 1991 Management Plan
Local Government Previous Waste
Act 2002 Minimisation and
Management Plan
Climate Change Response
Act 2002
NZ Waste Strategy 2010
NZ Emissions Trading
Scheme
Horowhenua Waste Minimisation and Management Plan 193.2 Statutory Requirements
A WMMP must contain a summary of the
Council’s objectives, policies and targets for waste
management and minimisation. The plan should
clearly communicate how the Council will deliver on
these objectives.
Section 43 of the WMA states that a WMMP must
provide for:
a. objectives and policies for achieving effective
and efficient waste management and
minimisation within the territorial authority’s
district
b. methods for achieving effective and efficient
waste management and minimisation within the
territorial authority’s district, including -
i. collection, recovery, recycling, treatment, and
disposal services for the district to meet
its current and future waste management
and minimisation needs (whether provided by
the territorial authority or otherwise); and
ii. any waste management and minimisation
facilities provided, or to be provided, by the
territorial authority; and
iii. any waste management and minimisation
activities, including any educational or public
awareness activities, provided, or to be
provided, by the territorial authority.
c. how implementing the plan is to be funded
d. if the territorial authority wishes to make grants
or advances of money in accordance with
section 47, the framework for doing so.
A WMMP must have regard to the waste hierarchy,
the New Zealand Waste Strategy, and a Council’s
most recent Waste Assessment.
20 Horowhenua District Council4. Vision, Goals, Objectives and Targets
4.1 Background The relationship between Vision, Goals and
Objectives is illustrated in Figure 57 and defined
The preparation of this Waste Assessment has in Table 87.
included review of the Vision - Goals - Objectives
framework set out in the previous WMMP.
Figure 5: Vision, goals, objectives and targets.
Table 8 provides definitions for vision, goals, objectives and targets
Vision The aspirational outcome for the Horowhenua District - providing
an overall direction and focus
Goal What the Council wants to achieve through the WMMP. The goal is not
aspirational; it is achievable. It is a major step in achieving Council’s
vision for the WMMP.
Objective The specific strategies and policies to support the achievement of the
goals. Objectives are ‘SMART’ (specific, measurable, achievable, relevant
and timely).
Target A clear and measurable way to determine how well the Council is
achieving its goals. Targets should also be SMART.
7
Sourced from Waste Assessments and Waste Management and Minimisation Planning – A Guide for Territorial Authorities, MfE 2015.
Horowhenua Waste Minimisation and Management Plan 214.2 Vision, Goals, Objectives and The objectives for waste minimisation and
Targets management in the Horowhenua District are:
The vision for waste minimisation and 1. To avoid creating waste.
management in the Horowhenua Region is8.
2. To make it easy and safe to recycle.
To deliver community benefits and continued waste
reduction, promoting individual responsibility. 3. To ensure households and businesses have
Horowhenua businesses and households will access to appropriate disposal of residual waste.
be provided with efficient and effective waste
4. To create opportunities for Horowhenua District
minimisation and management services.
- community partnerships, jobs, new products,
The goals for waste minimisation and management more efficient businesses.
in the Horowhenua District are to:
5. To reduce illegal dumping.
1. Avoid and reduce waste where we can.
6. To improve community understanding of issues
2. Manage waste responsibly - make it easy to and opportunities for waste minimisation and
recycle and safely dispose of the materials that management in the Horowhenua District.
can’t be recycled.
7. To work with other territorial authorities, central
3. Maximise community benefits - employment, government, industry and other parties to
reuse of materials for economic benefit, cost improve waste minimisation and management in
effective services. New Zealand.
Table 9 provides a summary of the Vision - Goals
and Objectives presented above and associated
targets for waste minimisation and management in
the Horowhenua District.
8
This vision has been developed in workshops with Horowhenua District Council Councillors and staff.
22 Horowhenua District CouncilTable 9: Vision - Goals - Objectives - Targets
To deliver community benefits and continued waste reduction, promoting
Vision: individual responsibility. Horowhenua businesses and households will be provided
with efficient and effective waste minimisation and management services.
Objective: Relevant Goal(s) Target(s)
1. To avoid creating waste 1. Avoid and reduce waste where we can. 1.1 To reduce the total quantity of waste
disposed of to landfill from
3. Maximise community benefits Horowhenua on a per capita basis.
employment, reuse of materials The current figure is 536 kg per
for economic benefit, cost effective person
services.
Waste disposal < 400kg per person
each year
2. To make it easy to recycle 1. Avoid and reduce waste where we can. 2.1 Increase in the proportion of
material captured for recycling at
2. Manage waste responsibly - make it kerbside and transfer stations.
easy to recycle and safely dispose of the The current figures are 21% and
materials that can’t be recycled. 13% respectively.
3. Maximise community benefits - Kerbside recycling > 40% by 2023
employment, reuse of materials for
economic benefit, cost effective Recycling 9 at Refuse Transfer
services. stations > 50 % by 2023
2.2 85% of people are satisfied
with their recycling service. 2015/16
(Currently 75% satisfaction vs
Annual Plan Target 75%).
Residents satisfaction > 85%
3. To ensure households and 2. Manage waste responsibly - make it 3.1 Satisfaction with kerbside refuse
businesses have access to easy to recycle and safely dispose of the and transfer station services.
safe disposal of residual materials that can’t be recycled. Currently 75% satisfaction vs
waste Annual Plan Target 75%.
3. Maximise community benefits -
employment, reuse of materials for Residents satisfaction > 75%
economic benefit, cost effective
services.
4. To create opportunities 1. Avoid and reduce waste where we can. 4.1 To publish a summary of available
for Horowhenua District - data on waste generation and
jobs, new products, more 2. Manage waste responsibly - make it management with each Annual
efficient businesses easy to recycle and safely dispose of the Report.
materials that can’t be recycled.
Summary data published in Annual
3. Maximise community benefits - Report
employment, reuse of materials for
economic benefit, cost effective To create a grant scheme to
services. support new initiatives to reduce
waste
9
Including diverting materials from composting and reuse.
Horowhenua Waste Minimisation and Management Plan 23Continued from previous table
To deliver community benefits and continued waste reduction, promoting
Vision: individual responsibility. Horowhenua businesses and households will be provided
with efficient and effective waste minimisation and management services.
Objective: Relevant Goal(s) Target(s)
5. To reduce illegal dumping 2. Manage waste responsibly - make it 5.1 Reduction in illegal dumping
easy to recycle and safely dispose of the incidents and quantity of material
materials that can’t be recycled. illegally dumped in the Horowhenua
District.
Quantity of illegally dumped waste
< 2015/16 figure
The number of illegal dumping
incidents is < 2015/16 figure.
5.2 Residents satisfaction with litter
and illegal dumping management.
Residents satisfaction > 85 %
6. To improve community 1. Avoid and reduce waste where we can. 6.1 Schools programmes delivered by
understanding of issues Council
and opportunities for waste 2. Manage waste responsibly - make it
management in the easy to recycle and safely dispose of the Waste education is provided to
Horowhenua District. materials that can’t be recycled. >700 school aged students each
year.
3. Maximise community benefits -
employment, reuse of materials for 6.2 Council (or contractors) promote
economic benefit, cost effective waste minimisation at events in the
services. District.
Council promotes waste
minimisation at > 5 events in the
District each year.
7. To work with other territorial 1. Avoid and reduce waste where we can. 7.1 To support the implementation
authorities, central of product stewardship schemes in
government, industry and 2. Manage waste responsibly - make it Horowhenua.
other parties to improve easy to recycle and safely dispose of the
waste minimisation and materials that can’t be recycled. >4 product stewardship schemes
management in New available to Horowhenua
Zealand. 3. Maximise community benefits - businesses and households.
employment, multi-use facilities, reuse
of materials for economic benefit, cost
effective services.
24 Horowhenua District Council4.3 Council’s Intended Role
Council will continue to adopt a largely user pays reduced by avoiding, where possible, and carefully
approach to delivery of waste transfer and disposal managing, where not, contact with waste.
services in the District. Where there are services In practice this means:
with a public good component Council will provide
• Containing waste effectively, including:
funding in whole or in part. Examples include
kerbside recycling, rural transfer stations, servicing • Providing appropriate containers at point of
of litter bins, cleaning up illegal dumping, and the generation e.g. workspace, kitchen, etc.
management of closed landfills.
• Providing appropriate containers for storing
Council will continue to own and support the waste prior to collection - these may be
operation of some key infrastructure for waste reusable (wheelie bins) or single use
minimisation and management in the District. (rubbish bags).
This includes the transfer stations in Foxton and • Providing dedicated public drop off areas at
Shannon and recycling centres across the District. transfer stations and landfills.
Council will provide information on waste • Regular collection and disposal.
minimisation and management to the community
• Suitable collection and transport vehicles.
and make staff available for education purposes.
Council will also work closely with other promoters • Disposal at a well constructed and operated
of effective waste minimisation and management. landfill including provision of appropriate
barrier systems such as base liner and
4.4 Protecting Public Health adequate daily, intermediate and final cover.
Waste, particularly putrescible and hazardous • Excluding as far as possible vermin10 that may
waste, has the potential to be detrimental to health. spread waste or associated contaminants.
Therefore, a key objective of any waste minimisation
The measures proposed in the WMMP have been
and management system is to protect public health.
developed with public health objectives at the
The risk of public health impacts can be significantly
forefront.
10
For example rodents, other stray animals, insects (flies, wasps).
Horowhenua Waste Minimisation and Management Plan 255. Options for Achieving Effective and
Efficient Waste Management and
Minimisation
5.1 Introduction
Section 51 of the WMA requires that a Waste life of this plan in line with population and economic
Assessment contain a statement of options activity. Infrastructure planning needs to take
available to meet the forecast demands of the account of this growth.
district with an assessment of the suitability of
The available data suggests that there is potential
each option.
to increase the diversion of material from the
This section summarises the identification and current estimate of around 17% across the waste
evaluation of options to meet the forecast demands management system. There are also ongoing issues
of the district and to meet the goals set out in with illegal dumping, challenges with obtaining
Section 0. The preferred options from the Waste robust data on waste and recycling activity and
Assessment will be incorporated into the WMMP the potential for increasing quantities of materials
as methods and feature in the Action Plan. entering the waste stream from rural properties.
The focus of option identification and evaluation has
For the Horowhenua District the total quantity of been addressing these issues alongside meeting
waste generated is forecast to increase over the forecast demands.
26 Horowhenua District Council5.2 Identifying Options
There are a wide range of approaches to providing
waste minimisation and management services
and programmes that could be adopted in
Horowhenua. A useful way to consider options is
the model set out in Figure 6. Simply put, effective
waste minimisation and management relies on a
combination of infrastructure (including collection),
education/information and regulation or policy.
These are supported by having the right data to
inform strategic and operational decision making.
Figure 6: Effective Waste Minimisation
and Management.
For the Waste Assessment, options have been • Managing the negative impacts of waste -
identified by considering key challenges for waste litter/illegal dumping clean-up, closed landfills
minimisation and management in the Horowhenua
District (Refer Section 2.3), referencing approaches • Council will support recycling efforts which
adopted elsewhere and looking for new solutions may include the purchasing of end products
where appropriate. Options have also been which have been produced through closed loop
considered with reference to the current recovery systems.
rates of key materials11 (see Section 2.2.2.1).
Education
Based on the model set out in Figure 6 options
considered can be grouped as follows. • Changing behaviour - education programmes
targeting schools, businesses and/or
Infrastructure households
• Providing collection services - collection of • Support infrastructure - information on how to
waste, recyclable materials (at kerbside or use collection and drop-off services to maximise
transfer station), organic waste and/or bulky recovery and maintain the quality of recovered
items, litter bins; materials (to maximise their value).
• Providing physical infrastructure - fixed location • Contributing to national education/information
or mobile drop off facilities, waste sorting, waste programmes.
processing and/or disposal facilities;
11
Key materials include paper/card, plastics, glass, organic waste, metals, glass and timber.
Horowhenua Waste Minimisation and Management Plan 27Policy
• Implementation of licensing provisions in the • Grant co-funding for projects that deliver on the
existing by-law (funding, service level, litter, data goals and objectives for waste minimisation and
provision). management.
• Data collection via licensing of waste operators • Working with Councils and other stakeholders
(as above). to progress national debate on waste issues
and policy.
• Targeted data collection, for example waste
surveys. These options focus on the priority waste streams
identified through the review of the current situation
• Making information on waste issues and in Section 2.2.2.1 and summarised in Table 10.
opportunities available.
Table 10: Priority wastes and waste sources
National Other materials requiring Water sources
active management include:
Organic Waste Hazardous waste Rural waste
Glass Difficult or special waste Industrial processing
Paper/Cardboard General waste
Metals e-waste
Plastics
Timber
28 Horowhenua District Council5.3 Options for the Future
residual waste management through the period
Based on the analysis and discussion presented in of the WMMP.
the Waste Assessment (Appendix A) the following
options should be included in an action plan for the • Work with producers and importers to improve
Horowhenua District Council WMMP. the management of hazardous waste, including
providing options in the District for specific waste
Infrastructure Actions streams like e-waste.
• Progress procurement for a new refuse
Education Actions
collection contract as a continuation of the
existing service (user pays refuse bags) with a • Continue to update and maintain information
strong focus on managing health and safety and on the Council website regarding waste and
managing market share. recycling collection and drop off services in the
Horowhenua District.
• Progress procurement for a new recycling
collection contract focussed on reducing • Provide clear information and education to
health and safety risks, producing high quality promote the effective use of private sector (for
recyclable materials and increasing the capture example farm plastics, soft plastics recycling,
of recyclable materials from households. Paintwise) and Council operated recycling
Consider local and out of district sorting of services.
co-mingled paper, plastics and cans.
• Disseminate information to all residents
• Progress procurement for a new transfer station (including holiday makers/temporary residents)
operations contract (Foxton and Shannon) including national programmes like Love Food
focussed on maintaining an acceptable level of Hate Waste.
service and maximising recovery of materials • Maintaining school education programme,
including recyclable materials, organic waste support environmental education activities for
and reusable items. schools, homes and businesses.
• Complete detailed analysis of organic waste • Provide information to the community about
collection options including the status quo the negative impact of illegal dumping and
(private sector services), a food and garden alternatives available to the community
waste collection and food waste only collection. (kerbside collection, commercial skip bins and
transfer stations).
• Complete detailed analysis12 of optimising
services for bulky household waste including the Policy Actions
role of transfer stations, potential for a voucher
system and potential bulky waste collections. • Develop criteria for making grants available
from Council’s allocation of Waste Levy
• Complete detailed analysis of sorting of C&I funds. Provisionally criteria will be based on
and/or C&D waste prior to disposal of residual contribution to the Vision, Goals and Objectives
material. Include examination of linkages with for waste minimisation and management with
sorting of kerbside recyclable materials and consideration of co-funding. Applications for
bulky waste collections. funding should also be assessed for their
ability to deliver the promised benefits i.e. due
• Council to confirm a medium term strategy for diligence on organisation capability, governance
Levin Landfill that provides for full funding of and accountability. Consideration also needs to
historic and current development, operations, be given to ensuring that funding supports new
closure and appropriate management after or expanded activities rather than supporting the
closure. Council will consider alternatives for status quo.
12
Consider cost of service, diversion of materials, fairness/equity, safety and protection of the environment (illegal dumping).
Horowhenua Waste Minimisation and Management Plan 29• Review and amend the existing Solid Waste • Continue to actively address illegal dumping
Bylaw (2014). This will focus on licensing, activity including where possible identifying
provision of recycling and consider limiting perpetrators and if required undertaking
receptacle size13. With a small number of clean-up activity.
collection providers operating in the District
Council is in a position to develop a pragmatic Indicative Costs
but effective approach. This will require
consultation with the collection providers prior The evaluation of options included a high level
to formally notifying any proposed changes. The estimate of costs for various actions. Appropriately
target implementation for the updated bylaw is staged option investigation, procurement and policy
December 2018. design can be accommodated within Council’s
existing budget for waste services. New contracts,
• Continue to report on progress against the new services and capital investment will all have
targets in the WMMP in Annual Reports. an impact on costs. Indicative cost impacts are
summarised in Table 11.
• Collaborate with local government organisations,
non government organisations (NGO) and other
key stakeholders to progress national activity on
waste minimisation and management policy.
Table 11: Cost impact of proposed actions (potential actions in italics)
Year Contracts/Services Policy and Investigations
2017/18 No change from current Rural waste
2018/19 New refuse, recycling and transfer Bylaw amendment
station contract (estimate approx. 30%
or 0.25M increase per annum). Grant funding scheme
development.
2019/20 No change from 2018/19 Investigate organic waste options
2020/21 No change from 2019/20 Investigate bulky, commercial and
construction waste options
2021/22 No change from 2020/21 LTP proposals for organic, bulky,
commercial and/or construction
waste recovery.
2022/23 No change from 2021/22 Potential procurement for organic
and bulky waste recovery service
2023/24 No change from 2022/23 Potential procurement for
Potential new organic and/or bulky waste commercial and construction
service (est 0.75 - 1.0M increase) waste recovery service.
13
The bylaw could limit size of new containers (120-140 L is common for Council provided collections or where limits have been introduced elsewhere.
For existing containers collection frequency could be limited to provide similar weekly capacity e.g. fortnightly collection of 240L wheelie bin.).
30 Horowhenua District Council6. Funding the plan
6.1 Plan Implementation Funding is expected to be in the order of 15% of the levy
funding received by Council.
The funding of the implementation of this WMMP
will come from user charges, rate payer funds and Criteria will be based on the funded activities
levy payments returned to the Council. contribution to promoting and achieving the Vision,
Goals and Objectives for waste minimisation and
User Charges management. Activities with co-funding will be
preferred with Council expecting 50% or more
will fund kerbside refuse collection, disposal of contribution from partners other than council.
materials at landfill and the disposal or management
of materials at Transfer Stations. Applications for funding will also be assessed
for their ability to deliver the promised benefits.
Ratepayer Funds Specific areas for assessment will include
organisation capability to deliver the project,
will provide public good focussed services. governance arrangements, accountability and track
Examples include roadside recycling collection, record in delivering similar projects.
supporting transfer station operations where user
charges are not adequate to cover the full cost 6.3 Waste Minimisation Levy
of operation, illegal dumping clean-ups, litter bin
servicing, licensing implementation, education
Expenditure
activities and reporting on plan implementation. Council currently uses the Waste Levy to fund
a small range of activities that includes waste
Levy Payments minimisation education in schools. The remainder
of the levy is used to help subsidise the kerbside
will fund activities that promote or achieve the Goals
recycling services in the district. There is scope
and Objectives of this WMMP.
here to improve effectiveness of the levy by funding
services and programs directed towards developing
6.2 Grants and Advances of Monies new systems and programs, outside of typical
As part of the implementation of the WMMP Council Council services, that address waste minimisation.
will develop criteria for making grants available
from Council’s allocation of Waste Levy funds.
The amount of money available for grants will be
determined as part of the Annual Plan process but
Horowhenua Waste Minimisation and Management Plan 317. Monitoring, Evaluating and
Reporting Progress
This WMMP will only have an impact in the Horowhenua District. In some cases information
Horowhenua District if appropriate action is taken exists but is not available to council14 while in others
to achieve the Vision - Goals - Objectives. The data is not currently available15.
Targets (Section 4.2) provide high level measure of
Progress in achieving the Vision - Goals -
progress. Monitoring, evaluation and reporting will
Objectives of this WMMP will be monitored by
focus on gathering data to assess progress against
collecting the data outlined in Table 12.
these targets.
7.1 Monitoring and Evaluation
The assessment of the current situation highlighted
gaps in information about waste generation,
collection, processing and management in the
Table 12: Data source and description
Data Source Information Comment
Council Illegal dumping Contract reporting
contractors Litter (bins, clean-up)
Kerbside refuse
Kerbside recycling
Transfer station refuse
Transfer station recycling/recover
Recycling station recycling
Landfill refuse
Other collectors Kerbside/Business refuse By-law data requirements
Waste processor Materials processed By-law data requirements
Council contact Illegal dumping incidents
database
Customer Surveys Residents satisfaction
Council Activity By-law implementation (licensing)
Reporting Data summary
(Annual Report)
14
For example regarding private sector collection services.
15
For example regarding the number of households participating in the kerbside recycling collection service.
32 Horowhenua District CouncilContinued from previous table
Data Source Information Comment
Targeted data Solid Waste Analysis Protocol Contract requirement or targeted
collection Surveys (waste composition) survey
Kerbside collection surveys
(participation, set out rates)
Recycling contamination survey
Some of the activities in the Action Plan are focussed
on securing the information noted in Table 12. For
example ongoing implementation of licensing (based
on the existing by-law) and improving reporting under
existing and future council contracts.
Evaluation of the data collected will focus on
measuring progress against the targets set out in
Section 4.2. The periodic review of the Action Plan
(see Section 8 of the Action Plan) will consider how
effective the actions underway or completed have
been in achieving the Vision - Goals - Objectives of
this Plan.
7.2 Reporting
Progress on implementing this WMMP will be
reporting in the Horowhenua District Council’s
Annual Report each year. Reporting will note
current performance against the targets based on
available information. In the early stages of the Plan
implementation it is likely that there will be significant
gaps in the available data limiting Council’s ability to
quantify progress.
Horowhenua Waste Minimisation and Management Plan 33You can also read


