CLEAN CORRIDORS 2020 UPDATE AC TRANSIT - SR 20-017, Att.1.
←
→
Page content transcription
If your browser does not render page correctly, please read the page content below
SR 20-017, Att.1.

CLEAN CORRIDORS
2020 UPDATE
 AC TRANSIT
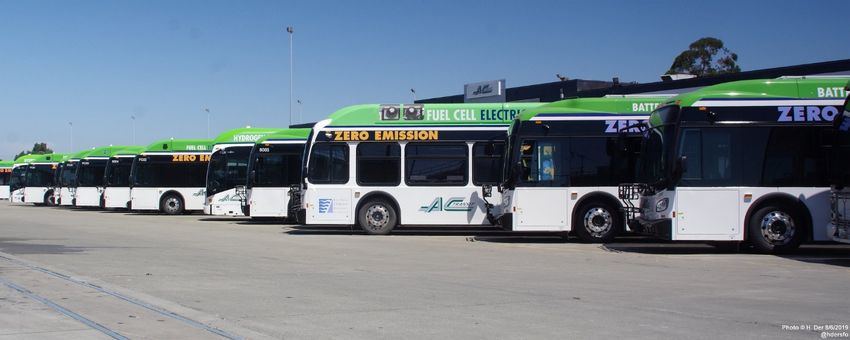
TABLE OF CONTENTS
Background ................................................................................................................................................... 1
   Clean Corridors Plan – 2017 ...................................................................................................................... 1
   Progress Since Clean Corridors Adoption ................................................................................................. 2
   Clean Corridors Plan – 2019 ...................................................................................................................... 3
Evaluation ..................................................................................................................................................... 3
   Existing Zero-Emission Fleet ..................................................................................................................... 4
   Division Capacity ....................................................................................................................................... 4
   Planned Expansion .................................................................................................................................... 4
   Clean Corridors Evaluation........................................................................................................................ 5
       Disadvantaged Communities ................................................................................................................ 6
       Ridership ............................................................................................................................................. 16
       Division Infrastructure .......................................................................................................................... 8
       Block Length .......................................................................................................................................... 8
Clean Corridors ........................................................................................................................................... 20
       Coliseum.............................................................................................................................................. 23
       Downtown Oakland ............................................................................................................................ 24
       Foothill ................................................................................................................................................ 25
       Fremont............................................................................................................................................... 26
       Fruitvale .............................................................................................................................................. 27
       Hayward .............................................................................................................................................. 28
       International ....................................................................................................................................... 29
       Macarthur-Grand Corridor.................................................................................................................. 30
       North Oakland ..................................................................................................................................... 31
       Richmond ............................................................................................................................................ 32
       San Pablo Avenue................................................................................................................................ 33
       West Berkeley ..................................................................................................................................... 34
       West Oakland ...................................................................................................................................... 35
       Non-DAC Service ................................................................................................................................. 36
   Divisions .................................................................................................................................................. 37
Capital Cost and Benefits ............................................................................................................................ 40
Implementation .......................................................................................................................................... 41
Challenges ............................................................................................................................................... 41
   Funding ............................................................................................................................................... 41
   Division Infrastructure ........................................................................................................................ 42
   Division Capacity ................................................................................................................................. 43
   Vehicle Assignment Flexibility............................................................................................................. 44
Schedule .................................................................................................................................................. 44
1

BACKGROUND
In 2015, the California Air Resources Board (CARB) began public vetting of a potential new rule, the
Advanced Clean Transit regulation, which mandates public transit fleets be entirely emissions-free by
2040. In December 2018 CARB formally adopted the new rule. This means transit agencies must begin
incorporating zero-emission buses (ZEBs) into their fleets as they purchase new vehicles with a
requirement for a fully zero-emission fleet by 2040. For the purposes of AC Transit’s heavy-duty coaches,
this will mean all vehicle purchases after 2029 have to be zero-emission. To ease the transition for transit
agencies, CARB has included incentives within the program for those who are early adopters, with credits
for buses already in the fleet counting towards the respective agency’s minimum ZEB fleet composition
figure.

The term “zero-emission” is used in the plan and throughout the Bay Area to refer to tail-pipe emissions.
Clearly there are emissions from all types of fueling technology, including associated with procurement,
delivery, assembly, maintenance, and decommissioning; however, it is also evident that hydrogen fuel-
cell and battery-electric buses have significantly lower overall emissions than diesel buses. The District
realizes the benefits of moving toward a “zero-emission” fleet, while acknowledging the more appropriate
name may be “low-emission.” For the purposes of this plan, the term zero-emission
 will be used.

The District is in the enviable position of having over 16 years of experience with ZEBs starting with its
initial three-bus fuel-cell electric bus (FCEB) fleet in the early 2000s. The current fleet of 13 hydrogen
FCEBs operated out of garages in Emeryville and East Oakland are one of the longest running ZEB fleets in
the country. However, with a need to transition to a 100-percent ZEB fleet by 2040, the District should
begin planning where to prioritize future ZEBs to ensure they are distributed equitably around the service
area as well as contribute to meeting regional and state-wide emissions-reductions goals.

CLEAN CORRIDORS PLAN – 2017
The original Clean Corridors Plan identified a series of corridors and communities to be prioritized for ZEBs
as the District procures more ZEBs with a plan of 25 percent of the fleet being zero-emission by 2032. The
overall goal of the plan is to have vehicles used on all lines serving these corridors and communities be
completely zero-emission (whether battery-electric bus or hydrogen fuel-cell electric bus).

The California Legislature passed AB 32 – the California Global Warming Solutions Act of 2006 – which is
commonly referred to as the Cap & Trade Program. This program is designed to create a market for trading
emissions credits and the proceeds from sales in the marketplace are used to reduce greenhouse gas
(GHG) emissions that cause climate change. In 2017, the state reaffirmed its commitment to the Cap &
Trade program when the legislature passed AB 398, extending the program to 2030. Investments from
Cap & Trade are also specifically targeted for disadvantaged communities, with legislation from 2012 (SB
535) and 2016 (AB 1550) requiring 25 percent of the proceeds from Cap & Trade funds go to projects that
provide a benefit to disadvantaged communities and gave the California Environmental Protection Agency
(CalEPA) responsibility for identifying those communities.
2

The focus on investments in disadvantaged communities is aimed at improving public health, quality of
life and economic opportunity in California’s most burdened communities and at the same time reducing
pollution that causes climate change. The Clean Corridors Plan used the terminology Disadvantaged
Communities (DACs) to refer to the communities designated by the CalEPA with their CalEnviroScreen
tool.

The methodology for identifying and prioritizing the corridors and communities in that plan was as
follows:
     1) Evaluate existing conditions.
     2) Review areas identified as DACs in our service area.
     3) Rank lines based on ridership and productivity to ensure maximum impact of the ZEB fleet.
     4) Consider constraints such as capacity/capability of divisions to accommodate ZEB growth.
     5) Scope out the number of vehicles and supporting infrastructure required to convert entire
         corridors/communities into Clean Corridors.
     6) Forecast operating and capital costs associated with conversion to Clean Corridors.

The original Clean Corridors Plan identified four corridors for prioritization for ZEB deployment:
    • San Pablo Avenue
    • West Oakland
    • Macarthur-Grand
    • Richmond

Taken together, lines in these corridors carry 23 percent of the District’s average weekday ridership and
serve a population of more than 600,000 residents within one-quarter mile of their stops. The lines require
120 buses to operate in peak service, with another 24 spares to support operations and facilitate
preventative maintenance. Each of the four Clean Corridors has a different mix of communities, line types,
and bus types. The corridors also overlap geographically. Line NL serves both the Macarthur-Grand and
West Oakland corridors. The San Pablo Corridor serves San Pablo Avenue, West Oakland, and Richmond.

The plan estimated that procuring the buses and charging/fueling infrastructure for Clean Corridors in
these four areas was $213.3 million. This represents capital costs of approximately $100 million above
the cost of replacing the same buses with diesel coaches.

PROGRESS SINCE CLEAN CORRIDORS ADOPTION
Following the adoption of the Clean Corridors Plan in Fall 2017, the District has been taking substantial
steps towards implementing the Plan and moving the fleet towards a zero-emission future. The District
submitted an application to the State of California’s Transit Intercity Rail Cooperative Program (TIRCP) for
funding of buses for the Macarthur-Grand Clean Corridor in 2018. The State awarded the District $15
million dollars in TIRCP funding later that year and linked it with a separate $15 million grant from the
Senate Bill 1 Local Partnership Program for hybrid vehicles. The combined $30 million in funding will be
3
used with another $38 million in other federal, state, and local funding to procure the 40 ZEBs necessary
to operate the Macarthur-Grand service along with another five buses to operate a service linking the
Emeryville Amtrak Station with San Francisco.
To ensure a successful transition to a zero-emission future, the District has also undertaken a number of
other studies, including the development of a Zero Emission Bus Study and the Facilities Utilization Plan,
which will guide the location of the District’s operating facilities moving forward, including any
considerations about what those facilities will need to support a zero-emission fleet. In addition, the
District is working on a New Emissions Fleet Transition Plan to analyze how to ensure facilities will have
the proper power infrastructure to support a fully zero-emission fleet.
CLEAN CORRIDORS PLAN – 2020
The new Innovative Clean Transit Rule adopted by CARB in 2018 will require a 100-percent zero-emission
fleet by 2040, meaning the schedule identified in the original Clean Corridors Plan will need to be
accelerated. AC Transit will need to have 25 percent of its bus purchases – including accrued bonus points
from the District’s fuel-cell fleet – be zero-emission as early as 2023, though if agencies in the state meet
fleet requirements that date could be pushed back as far as 2025. The next key milestone is 50 percent of
new bus purchases must be zero-emission by 2026 and 100 percent by 2029. It is critical to note that
cutaways and articulated buses are exempt from these calculations until FTA-required testing is
completed and viable zero-emission versions of those bus types are available commercially.
Recent experiences with battery-electric buses (BEBs) at other agencies and through the District’s own
studies have revealed limited daily range for those buses available today. Some transit agencies have
responded by splitting long vehicle assignments into short, more manageable blocks. However, AC Transit
is already at or near the capacity of its divisions and cannot add more vehicles. This update to Clean
Corridors will continue to use the criteria for equity and ridership to prioritize lines and corridors for
implementation but will also identify those lines or corridors with shorter blocks available for the first
round of BEBs. Doing so will ensure this new fleet type can be incorporated into AC Transit operations
without complicated vehicle swaps and service interruptions. This document also represents a shift from
the initial Clean Corridors Plan – while that plan prioritized four corridors, this plan exists in a regulatory
environment where all lines will be zero-emission by 2040 and thus arranges the lines in phases for
implementation.
EVALUATION
This section evaluates existing AC Transit lines to determine the most appropriate lines to prioritize for
assignment of future zero-emission buses. The chapter consists of the following elements:
1) Baseline description of existing and procured ZEB fleet.
2) Discussion of existing division and infrastructure capacity.
3) Planned future expansion of the zero-emission fleet.
4) The evaluation of lines and corridors for priority ZEB assignment.4
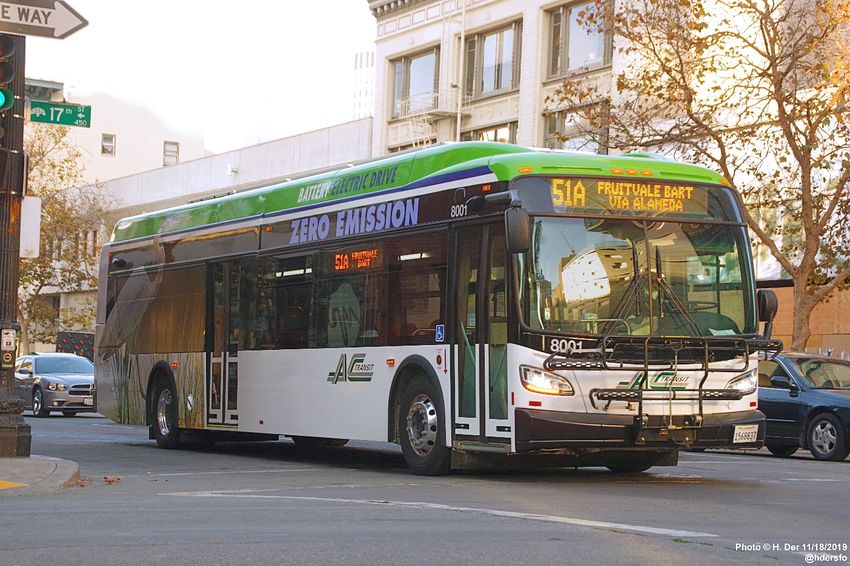
EXISTING ZERO-EMISSION FLEET
The District currently has thirteen 40-foot hydrogen fuel-cell electric buses (FCEBs), which represents the
largest and longest-running fuel-cell transit fleet in the nation. The District has begun procurement of 10
additional 40-foot FCEBs as well as a demonstration project of one 60-foot FCEB. This will bring the
District’s FCEB fleet to 24 buses, which will be the maximum number of buses existing hydrogen fueling
infrastructure at Divisions 2 and 4 can accommodate. The District has also received funding to assist with
the purchase of five 40-foot battery-electric buses (BEBs) that will be deployed from Division 4 on various
routes including Line 73 in East Oakland, operating along 73rd and Hegenberger between Eastmont Transit
Center and the Oakland International Airport. The current and planned fleet is depicted in Exhibit 1 below.
By early 2020, the District plans to have 29 zero-emission buses in its fleet. Thirteen VanHool FCEBs are
expected to be retired within the next several years.
DIVISION CAPACITY
The District is nearing completion of an expansion of the hydrogen dispensing capacity at Division 2. With
the project, the total fueling capacity is conservatively estimated at 41 FCEBs. The hydrogen fueling
infrastructure upgrade at Division 2 will allow for faster and more efficient fueling operations as well as
move hydrogen fueling to the existing (diesel) fueling island. This will improve operational efficiency of
fueling and servicing FCEBs. After the project goes into operation, staff will examine actual fueling
capacity of FCEBs.
Exhibit 1 – Fuel-cell Electric Bus Maintenance and Fueling Capacity
Division Maintenance Capacity Fueling Capacity
Division 2 30 buses 30 buses
Division 4 20 buses 11 buses
Total 50 buses 41 buses
Note: Division 2 capacity includes the expansion project, which will be completed in January 2020.
Source: Preliminary Engineering Design for 45 Zero Emission Buses (October 2019)
Expansion of the hydrogen FCEB fleet beyond the existing FCEBs and planned purchase may require
significant upgrade of existing fueling stations or construction of another hydrogen fuel station at another
division, as well as increasing FCEB maintenance capacity to accommodate growth.
The District has installed depot charging stations at Division 4 to support the five BEBs going into revenue
service in 2020. The District is also in discussions with Pacific Gas & Electric (PG&E) regarding any
infrastructure changes necessary to accommodate charging systems for the BEBs. Discussions include
potential scalability of the BEB charging infrastructure from the initial five bus capacity up to 50 BEBs.
PLANNED EXPANSION
There are a number of current plans in place for additional ZEBs for the District across the next several
years. The first is the procurement of 45 ZEBs using funding from various grants, including the TIRCP and
SB 1 grants, which were awarded in 2018. This funding was secured in part due to the vision outlined in5
the original Clean Corridors Plan and features the complete implementation of the Macarthur-Grand
Corridor plan along with five additional expansion buses
for a Transbay link between the Emeryville Amtrak
DISADVANTAGED COMMUNITIES Station and Salesforce Transit Center in San Francisco.
Richmond These buses should begin entering service as early as
San Pablo late 2021.
West Berkeley
West Oakland The second planned expansion of ZEBs is through the
North Oakland state’s Affordable Housing and Sustainable
East Oakland Communities (AHSC) program. This program allows for
International Boulevard/East 14th developers of affordable housing to secure funding
Oakland International Airport
from the State’s Cap & Trade program for their
Ashland (San Leandro) residential developments as well as for transit agencies
Russell City (Hayward) to receive funding for new buses if transit service is
Union City being improved in proximity to those proposed
affordable developments. The District has been
awarded funding for five buses through the AHSC program and will be purchasing four ZEBs as part of the
grant awards to various developments.
Finally, there is a Memorandum of Understanding with the Treasure Island Mobility Management Agency
(TIMMA) for the procurement and operations of as many as 11 buses for operation between downtown
Oakland and Treasure Island. The initial service plan calls for five 40-foot buses and as development
increases over a decade-long period, more and larger buses will be procured until final build-out service
levels are achieved and the island has its forecast population of 20,000 residents. One of the affordable
developments on Treasure Island was awarded an AHSC grant in the 2019 round that includes funding for
four 40-foot ZEBs.
CLEAN CORRIDORS EVALUATION
There are four primary criteria used in this plan to evaluate AC Transit lines and prioritize their transition
to zero-emission coaches:
1) Inclusion in the list of DACs,
2) Division Infrastructure,
3) Appropriate Block length (i.e., daily service mileage), and
4) Service Frequency and Ridership.6 Disadvantaged Communities These communities stretch from the northern-most point of the District in Contra Costa County to nearly the southern-most part of Alameda County and touch all operating divisions (Richmond, Emeryville, East Oakland, and Hayward). The level of service offered in each of the SB 535 Disadvantaged Communities (DACs) varies considerably. North/West Oakland has the highest level of service with multiple lines offering service every 15 minutes or better and strong service levels at night and on the weekend. Ashland and Russell City have lower levels of service and many areas not served by AC Transit at all. This criterion represents the “first cut” to determine which lines should be prioritized for future zero- emission buses. From an equity standpoint, the Clean Corridor Plan establishes as its foundation that all initial zero-emission buses should be focused on serving areas identified as DACs. The map in Exhibit 2 illustrates the DACs within the District as well as the AC Transit bus lines serving those communities.
7

Exhibit 2 – AC Transit Lines Serving SB 535 Disadvantaged Communities
8

Division Infrastructure
Divisions 2 and 4 currently have a combined fueling capacity of 41 FCEBs with an additional five BEBs for
Division 4. The District is currently working with PG&E on electrical infrastructure requirements to support
a significant expansion of BEBs at Division 4.

Divisions 2 is the next logical location after Division 4 for ZEBs as it is already home to a FCEB fleet.
However, the District’s Facilities Utilization Plan calls for building a new facility to replace Divisions 2 and
3, expanding Division 4 to allow Divisions 2 and 4 to merge, or some combination of the two. As the
District continues to make decisions about the future of its facilities, no plans exist for adding electric
charging infrastructure to Division 2. At this time, any ZEBs operating out of Emeryville will need to be
FCEBs. Staff will re-evaluate ZEB expansion at D2 in coordination with the District’s implementation of the
Facility Utilization Plan.

Division 3 in Richmond is the District’s smallest operating division but is in a DAC. Its small size would
allow the District to convert a significant portion of the division’s fleet to zero-emission just by converting
the local Richmond lines – 70, 71, 74, 76 – to zero-emission along with the San Pablo Corridor lines.

Division 6 would be the lowest priority in the near-term given it has few lines serving DACs and many of
the lines operating out of Division 6 have low ridership, meaning the benefits of zero-emission buses
would be felt by fewer customers. As it does convert to zero-emission, priority should be placed on lines
10, 97, and 99.

Block Length
Since the adoption of the initial Clean Corridors Plan in 2017, the District has been refining plans for
converting the fleet to 100-percent zero emission. In discussing the performance of BEBs already in use
by peer operators, it has become clear that the daily range of these vehicles is more limited than a
traditional diesel bus or a FCEB. This has been a common theme for the first BEBs that have begun service
but improvements in battery technology are expected to result in much longer ranges in the future. This
update of the Clean Corridors Plan serves as an opportunity to identify the lines where it makes most
sense to deploy the first round of BEBs as they arrive over the next few years.

All AC Transit lines are dedicated to specific garages, so the following analysis is broken down by division.
Each block at each division was analyzed for length and primary line (Owl, BART Early Bird, Supplementary,
                                         and 300-series lines were excluded from this analysis as they are
                                         typically interlined or exist as very small pieces that are later
      AC TRANSIT DIVISIONS               grouped in longer blocks). The blocks were then split into groups:
      Division 2 – Emeryville            •Under 50 miles,
      Division 3 – Richmond              •50 to 99 miles,
     Division 4 – East Oakland           •100 to 149 miles, and
       Division 6 – Hayward              •Over 150 miles.
9
These groupings were next organized by line and combined into the exhibits below. Each exhibit details
the local and Transbay lines and how many total blocks are assigned to each line, with color-coding for
the number of each length of block assigned to each line. This analysis is intended to provide insight into
which lines at each division are candidates for zero-emission buses given daily range is a potential
constraint.
Exhibit 3 details the block lengths for Division 2 in Emeryville. Some lines have a high percentage of blocks
greater than 150 miles. These include Lines 7, 19, 36, 57, 65, 96, and F. There are a handful of lines with a
few long blocks – 6, 12, 18, 33, and 88. A significant number of lines have no blocks longer than 150 miles,
including Lines 29, 51B, 52, 67, 79, 80, and all Transbay lines but Line F.
Taken together, these results mean Division 2 is a great candidate for BEBs based on the length of the
blocks and the number of lines which could be operated without compromising on range and splitting
blocks, thus adding buses to the fleet.
Exhibit 3 – Division 2 Block Lengths by Route
2
2
2 4
1
10
3 9 1 3
5
4
5 1 11
4 2
3 7 9
4
3 3
2 6 2 6
3 1 5 3
4 2 4 4 4
3 1 3 3
2 2 2 2 2 2
1 1 1 1 1 1 1
6 7 12 18 19 29 33 36 51B 52 57 65 67 79 80 88 96 B BSD BSN C CB E F P
Blocks10
Exhibit 4 – Division 3 Block Lengths by Line
5 1
6
9 1
5
6
8
7
4
3
9
5 7
2 2 6
5 5 5
2 2 4
3 1
2
1 1 1 1
70 71 72 72M 72R 74 76 FS G H J L LA
Blocks11
Division 6 has a unique mix of lower-frequency lines that do not have distinct peaks in their headways,
resulting in a significant number of lines composed entirely of long blocks, making it a poor destination
for the initial round of BEBs. The only major exception is Line 97, which would lend itself well to a transition
to zero-emission buses.
Exhibit 6 – Division 6 Block Lengths by Line
4
8
2
9 1
5
5 4 8 3
5 4 7
5 4 4 4 4 4 4 1 2 5 4 1 4
2 2 3 2 2 3 1 2 2 3 1 3
1 1 1 1 1
10 28 34 35 41 56 60 83 86 93 94 95 97 99 200 210 212 215 216 217 232 239 251 M S SB U
Blocks12
combine to carry approximately 13,000 riders each weekday. In West Oakland – one of the original Clean
Corridors – Lines 29 and 88 have 15 blocks under 150 miles a day and combine to carry about 3,800 riders
each weekday.
Exhibit 7 – Division 2 Zero-emissions Line Rankings
Division 2 Zero-emissions Index
Blocks Blocks Total Weekday
Route13
As noted in the previous section, there are few local lines operating out of Division 3 that are candidates
for prioritization of zero-emission buses as many lines are reliant upon long blocks, with the exception of
Line 72R. The Transbay lines out of Division 3 are viable zero-emission candidates but some would require
a zero-emission double-decker bus to be available.
Exhibit 8 – Division 3 Zero-emissions Line Rankings
Division 3 Zero-emissions Index
Blocks Blocks Total Weekday
Route14
There are numerous opportunities for ZEB prioritization at Division 4, the largest garage in the District.
While Line 1 looks like a viable candidate, it will not be in the initial round of ZEB procurement given it will
be replaced by the BRT special five-door vehicles that have already been procured as diesel hybrids. Line
40 along Foothill Boulevard stands out as a high-priority candidate for ZEBs given its high ridership (9,000
average weekday riders) and significant number of shorter blocks (11). Within the Coliseum grouping, Line
45 stands out as a good candidate for prioritization. In the Fruitvale grouping, Lines O and 51A account
for 41 short blocks and 11,000 riders. For Macarthur-Grand, the entire NX series, as well as half of NL
blocks can be converted to zero-emission and would account for approximately 49 blocks and 3,000 riders
each day.
Exhibit 9 – Division 4 Zero-emissions Line Rankings
Division 4 Zero-emissions Index
Blocks Blocks Total Weekday
Route15
As noted previously, Division 6 has fewer opportunities for zero-emission prioritization as ridership is
lower in the central and southern portions of Alameda County. In addition, there are few lines with
significant numbers of short blocks, making the range limitation of the initial BEBs a significant issue. Aside
from the Transbay lines, the line best-suited for zero-emission conversion is Line 97 given its high ridership
and high number of short blocks.
Exhibit 10 – Division 6 Zero-emissions Line Rankings
Division 6 Zero-emissions Index
Blocks Blocks Total Weekday
Route16
Service Frequency and Ridership
The District operates 70 regular local and Transbay lines that also serve significant portions of the DACs
identified in the map in Exhibit 2. The next step in the evaluation of which lines to prioritize for the
operation of ZEBs is to rank the lines serving those communities by frequency and ridership. The purpose
of using ridership is to ensure the new ZEBs benefit the greatest number of customers as they’re rolled
out, keeping in mind that ultimately all AC Transit vehicles will be zero-emissions by 2040. Frequency
ensures that routes with the most buses are prioritized in order to maximize the benefit on ZEBs on the
environment in the DACs.
Exhibit 11 illustrates those lines serving the DACs as well as their passengers/service hour (productivity),
average daily ridership, and the number of buses in each direction during peak hours. The lines are in
numerical order.
The highest-ridership line – Line 1 – is slated for replacement by AC Transit’s first bus rapid transit line in
2020 and the District has taken delivery of purpose-built, five-door articulated buses for that line. All 27
of these vehicles are diesel-hybrid coaches.
To provide more clarity regarding which corridors or communities to prioritize as the first lines for ZEB
deployment, the lines were then grouped by area. Some common themes emerged from these groupings:
• Many of the lines in East Oakland operate along single corridors – lines 20, 21, 39, 40, 46, 46L, 54,
73, 90, 98, etc. – but also operate out of either Fruitvale BART or Coliseum BART and are combined
into groupings as a result.
• Some lines had lower ridership but were in key areas such as Richmond or West Oakland where
they could be coupled with other lines to form a cohesive community of clean buses, including
lines 29 and 36 in West Oakland and lines 71 and 74 in Richmond.
• Lines in Hayward and Fremont had low ridership on their own but could be combined into large
groupings that carry significant numbers of riders.
• Taken together, the lines comprise 140,000 weekday riders across 370 peak buses, making up 78
percent of District ridership and 70 percent of the peak fleet pull-out.17
Exhibit 11 – Lines Serving SB 535 Disadvantaged Communities
Estimated Avg Pass per Buses/Hour/ Peak
Route Route Type Division Daily Pass Rev Hour Area Direction Vehicles
1 Trunk D4 11,469 43.1 International 8 18
6 Trunk D2 5,931 38.3 North Oakland 6 11
12 Trunk D2 2,969 21.3 North Oakland 3 9
14 Urban Crosstown D4 4,675 31.9 West Oakland 4 10
18 Trunk D2 4,382 28.1 North Oakland 4 10
19 Urban Crosstown D2 781 14.1 Fruitvale 3 4
20 Major Corridor D4 2,656 33.3 Fruitvale 2 4
21 Urban Crosstown D4 1,714 25.1 Fruitvale 2 5
29 Urban Crosstown D2 1,347 16.6 West Oakland 3 6
33 Trunk D2 3,298 26.2 Downtown Oakland 4 11
36 Urban Crosstown D2 1,656 22.7 West Oakland 2 4
39 Urban Crosstown D4 505 35.5 Fruitvale 1 1
40 Trunk D4 8,951 44.2 Foothill 5 13
41 Trunk D6 540 11.4 Hayward 1 1
45 Urban Crosstown D4 1,894 21.7 Coliseum 2 6
46 Urban Crosstown D4 283 20.1 Coliseum 1 1
47 Urban Crosstown D4 117 13.1 Fruitvale 1 1
52 Urban Crosstown D2 2,742 37.4 West Berkeley 4 5
54 Urban Crosstown D4 2,113 44.7 Fruitvale 6 3
56 Suburban Crosstown D6 451 8.8 Hayward 1 5
57 Trunk D2 6,235 30.3 Macarthur-Grand 4 4
60 Suburban Crosstown D6 1,263 18.0 Hayward 3 4
62 Urban Crosstown D4 3,375 28.5 West Oakland 4 8
70 Urban Crosstown D3 886 20.6 Richmond 2 3
71 Urban Crosstown D3 1,431 20.1 Richmond 2 5
72 Trunk D3 3,735 27.4 San Pablo Avenue 2 8
73 Major Corridor D4 2,709 37.8 Coliseum 4 4
74 Urban Crosstown D3 1,333 20.2 Richmond 2 4
76 Urban Crosstown D3 2,556 32.0 Richmond 2 6
80 Trunk D2 895 9.5 West Berkeley 2 6
83 Suburban Crosstown D6 969 15.0 Hayward 2 4
86 Suburban Crosstown D6 1,111 14.5 Hayward 2 4
88 Major Corridor D2 2,450 25.6 West Oakland 4 7
90 Trunk D4 963 20.5 Coliseum 3 0
96 Urban Crosstown D2 1,408 21.7 Downtown Oakland 2 4
97 Major Corridor D6 4,093 27.6 Hayward 4 13
98 Trunk D4 1,730 23.9 Coliseum 3 7
200 Suburban Crosstown D6 1,318 14.6 Fremont 2 5
212 Very Low Density D6 771 10.6 Fremont 2 4
216 Very Low Density D6 313 11.0 Fremont 1 2
232 Very Low Density D6 410 12.4 Fremont 1 4
251 Very Low Density D6 199 11.8 Fremont 1 218
Exhibit 11 – Lines Serving SB 535 Disadvantaged Communities (cont.)
Estimated Avg Pass per Buses/Hour/ Peak
Route Route Type Division Daily Pass Rev Hour Area Direction Vehicles
46L Urban Crosstown D4 179 13.0 Coliseum 1 1
51A Trunk D4 9,170 45.0 Fruitvale 6 13
51B Trunk D2 9,440 60.6 West Berkeley 6 10
72M Trunk D3 3,449 28.3 San Pablo Avenue 2 8
72R Rapid D3 5,490 30.7 San Pablo Avenue 5 15
BSD Shuttle D2 1,763 54.2 Downtown Oakland 5 3
BSN Shuttle D2 194 19.8 Downtown Oakland 2 0
C Transbay D2 414 31.8 West Berkeley 2 5
F Transbay D2 2,038 20.5 West Berkeley 2 6
J Transbay D3 1,029 56.1 West Berkeley 4 6
L Transbay D3 702 25.0 Richmond 6 8
LA Transbay D3 492 17.5 Richmond 6 5
M Transbay D6 238 12.1 Hayward 1 3
NL Transbay D4 3,213 24.9 Macarthur-Grand 4 10
NX Transbay D4 347 37.4 Macarthur-Grand 3 3
NX1 Transbay D4 188 28.9 Macarthur-Grand 3 3
NX2 Transbay D4 269 25.4 Macarthur-Grand 3 3
NX3 Transbay D4 360 23.8 Macarthur-Grand 3 4
NX4 Transbay D4 399 21.4 Macarthur-Grand 5 6
NXC Transbay D4 31 11.2 Macarthur-Grand 1 1
O Transbay D4 1,956 26.8 Fruitvale 6 10
S Transbay D6 194 12.8 Hayward 2 4
SB Transbay D6 429 18.3 Fremont 4 7
Z Transbay D3 57 14.8 West Berkeley 1 0
The first Clean Corridors Plan identified four major corridors or communities for prioritization for zero-
emission infrastructure:
• San Pablo Avenue
• West Oakland
• Macarthur-Grand
• Richmond
The new CARB requirement for all buses to be zero-emission by 2040 has resulted in a tweaked
methodology for this update of the Clean Corridors Plan. This brings the number of lines to 70 (from 39)
and also yields new groupings, some of which have higher ridership than those in the initial plan, which
was much more focused on only routes that existed entirely within DACs. Many of these new routes serve
DACs with part of their alignment.
Exhibit 12 groups the lines into their respective corridors or communities and approaches the ranking
differently. In this case, the methodology focuses on frequency as illustrated by the number of buses per
hour, per direction. To provide context, a line like Line 97 which operates every 15 minutes has four buses
running per hour per direction. Frequency provides a good indication of the impact to the surrounding
community from switching from diesel buses to zero-emission buses. The more buses running in a
community or along a corridor, the greater the impact of switching to zero-emissions19
With this update, the number of peak vehicles per hour per direction is a key factor in helping to determine
the relative impact of converting a line or service area into a purely zero-emission Clean Corridor. To do
this, the average weekday ridership is divided by the number of peak vehicles per direction per hour.
Doing so allows the District to prioritize lines where the greatest number of buses running along a corridor
can be converted to zero-emission.
Exhibit 12 – Clean Corridor Line Groupings
Weekday Peak Buses/Hour/ Riders per
Area Lines Division(s) Ridership Vehicles Direction Vehicle
Fruitvale 19, 20, 21, 39, 47, 51A, 54, O D2, D4 19,012 41 27 704
Macarthur-Grand 57, NL, NXs D2, D4 11,042 34 26 425
West Berkeley 51B, 52, 80, C, F, J, Z D2, D3 16,615 38 21 791
Richmond 70, 71, 74, 76, L, LA D3 7,400 31 20 370
West Oakland 14, 29, 36, 62, 88 D2, D4 13,503 35 17 794
Hayward 41, 56, 60, 83, 86, 97, M, S D6 8,859 38 16 554
Coliseum 45, 46, 46L, 73, 90, 98 D4 7,758 19 14 554
North Oakland 6, 12, 18 D2 13,282 30 13 1,022
Downtown Oakland 33, 96, BS D2, D4 6,663 18 13 513
Fremont 200, 212, 216, 232, 251, SB D6 3,440 24 11 313
San Pablo Avenue 72, 72M, 72R D3 12,674 31 9 1,408
International 1 D4 11,469 18 8 1,434
Foothill 40 D4 8,951 13 5 1,79020
CLEAN CORRIDORS
Based on the analysis in the previous section, several key corridors and communities in the service area
have been identified as the next to prioritize for zero-emission conversion, keeping in mind the entire
fleet will be zero-emission by 2040 at the latest. The corridors are prioritized by division, given Division 4
will be the first to have extensive battery-electric charging infrastructure. Expansion of ZEBs at Division 2
will be reassessed as the District decides how the vision outlined in the Facilities Utilization Plan will be
implemented. As Division 2 is recommended to be replaced, a major investment in zero-emission
infrastructure beyond the recent hydrogen fueling upgrades is not programmed. The Clean Corridors are
grouped (alphabetically) as the following:
• Coliseum
• Downtown Oakland
• Foothill
• Fremont
• Fruitvale
• Hayward
• International
• Macarthur-Grand
• North Oakland
• Richmond
• San Pablo
• West Berkeley
• West Oakland
These Clean Corridors cover the majority of the service area, from Richmond to Fremont. Taken together,
lines in these corridors carry 78 percent of the District’s average weekday ridership and serve more than
1,120,000 residents and 400,000 jobs within one-quarter mile of their stops. The Clean Corridor lines
require 371 buses to operate in peak service, with another 93 spares to support operations and facilitate
preventative maintenance. Exhibit 13 illustrates the Clean Corridors network coverage.21
Exhibit 13 – Clean Corridor Lines
Each of the Clean Corridors has a different mix of communities, line types, and bus types. The corridors
also overlap in many ways. Line NL serves both the Macarthur-Grand and West Oakland corridors. The
San Pablo Corridor serves San Pablo Avenue, West Oakland, and Richmond. Each Clean Corridor is
discussed in more detail below. For cost purposes, this report assumes the highest list price for zero-
emission vehicles depending on bus size. The costs, shown in Exhibit 14, were taken from the District’s22
Zero Emission Bus Study from February 2019 and reflect the base price of the vehicles, without any
additional options or systems (TSP, Farebox, etc.). The report also estimates an incremental cost of
$496,000 for charging/fueling infrastructure for each bus, this is the same figure used in the previous
Clean Corridors Plan. For Transbay bus costs, this report assumes all vehicles on peak-only Transbay lines
will use 45’ coaches as firm figures for zero-emission double-decker coaches are not available at this time.
The overall cost assumptions are based on the District’s past experience with procuring ZEBs and
supporting infrastructure and do not reflect maintenance or operations costs. As the District procures
more ZEBs and the technology matures, these costs are likely to come down. For the purposes of this
report, the estimates are conservative and grants are likely to cover significant portions of future ZEB and
infrastructure procurements.
Exhibit 14 – Estimated Costs by Fuel and Fleet Type
Length Diesel Hybrid Gasoline Electric Hydrogen
26' $ 110,000 $ 350,000 $ 500,000
30' $ 365,000 $ 625,000 $ 900,000
40' $ 500,000 $ 775,000 $ 900,000 $ 1,300,000
45' $ 660,000 $ 1,000,000 $ 1,450,000
60' $ 650,000 $ 1,300,000 $ 1,550,000
Source: AC Transit Zero Emissions Bus Study Table 17
Many of the corridors and communities have lines housed in different garages. It is critical to note Division
4 will likely be the first division to be converted to BEB and capacity for hydrogen fueling will max out at
41 vehicles between Divisions 2 and 4, so the scale of the infrastructure will play a critical role in the order
in which the corridors are converted to zero-emission.23
Coliseum Exhibit 15 – Coliseum Corridor Map
The Coliseum area has service focused around
Coliseum BART in East Oakland, with lines
providing cross-town connections along major
numbered streets and connecting with major
north-south corridors (International, Foothill,
Macarthur). The lines serving Coliseum – 45, 46,
46L, 73, 90, and 98 – carry 7,700 riders each
weekday and serve Seminary, 81st, 82nd, 85th,
90th, 98th, and 105th. These routes are some of
the District’s highest frequency cross-town
routes.
The total cost of converting these lines to zero-
emission is estimated to be $46,696,000,
including infrastructure. All lines operate using
40’ coaches out of Division 4 in East Oakland.
Exhibit 16 – Coliseum Corridor Fleet and Costs
Coliseum Clean Corridor
Fleet Costs
Lines Division Type Peak Buses Spares Total Vehicle Infrastructure Total
45 4 40' 6 2 8 $ 10,400,000 $ 3,968,000 $ 14,368,000
46 4 40' 1 1 2 $ 2,600,000 $ 992,000 $ 3,592,000
46L 4 40' 1 1 2 $ 2,600,000 $ 992,000 $ 3,592,000
73 4 40' 4 1 5 $ 6,500,000 $ 2,480,000 $ 8,980,000
90/98 4 40' 7 2 9 $ 11,700,000 $ 4,464,000 $ 16,164,000
Total 19 4 26 $ 33,800,000 $ 12,896,000 $ 46,696,00024
Downtown Oakland Exhibit 17 – Downtown Oakland Corridor
While many AC Transit lines serve downtown
Oakland – it is the core of the network – most
other lines in this document are included
within other DACs, leaving Lines 33, 96, and
the Broadway Shuttle within the downtown
Oakland Corridor. These three lines carry a
combined 6,600 riders each weekday and
also provide service up Park Boulevard,
Oakland Avenue, into Chinatown, and
Alameda Point. Lines 33 and 96 are relatively
frequent crosstown routes with 17- and 20-
minute frequencies respectively.
The total cost of converting these lines to
zero-emission is estimated to be $41,308,000, including infrastructure. All lines operate out of Division 2
in Emeryville and are assigned or can accommodate 40’ coaches.
Exhibit 18 – Downtown Oakland Corridor Fleet and Costs
Downtown Oakland Clean Corridor
Fleet Costs
Lines Division Type Peak Buses Spares Total Vehicle Infrastructure Total
33 2 40' 11 3 14 $ 18,200,000 $ 6,944,000 $ 25,144,000
96 2 40' 4 1 5 $ 6,500,000 $ 2,480,000 $ 8,980,000
Broadway Shuttle 2 40' 3 1 4 $ 5,200,000 $ 1,984,000 $ 7,184,000
Total 18 4 23 $ 29,900,000 $ 11,408,000 $ 41,308,00025
Foothill Exhibit 19 – Foothill Corridor Map
The Foothill Clean Corridor consists
of a single line – Line 40 – and
carries nearly 9,000 riders each
weekday on its alignment between
downtown Oakland and Bay Fair
BART. It is a major north-south
corridor operating at every 10
minutes and is the fourth-highest
ridership line in the system (behind
Lines 1, 51A, and 51B). The line
serves the heart of East Oakland
and provides connections with all
other lines serving East Oakland.
The total cost of converting Line 40 to zero-emission is estimated to be $32,736,000, including
infrastructure. Line 40 is assigned 60’ articulated coaches and operates out of Division 4 in East Oakland.
Exhibit 20 – Foothill Corridor Fleet and Costs
Foothill Clean Corridor
Fleet Costs
Lines Division Type Peak Buses Spares Total Vehicle Infrastructure Total
40 4 60' 13 3 16 $ 24,800,000 $ 7,936,000 $ 32,736,000
Total 13 3 16 $ 24,800,000 $ 7,936,000 $ 32,736,00026
Fremont Exhibit 21 – Fremont Corridor Map
Fremont is the fourth-largest city in the
Bay Area, behind San Jose, San
Francisco, and Oakland. It is undergoing
rapid growth and the City is focusing on
increasing density near BART and along
major transit corridors. The lines
serving DACs in Fremont and Newark –
200, 212, 216, 232, 251, and SB -- are
generally low-frequency but the District
is developing a plan to restructure
service or make improvements to
frequency along major corridors.
Together, the lines serving DACs in
Fremont carry 3,440 riders each
weekday.
The total cost of converting these lines to zero-emission is estimated to be $55,230,000, including
infrastructure. All lines operate out of Division 6 in Hayward and line SB is assigned 45’ over-the-road
coaches.
Exhibit 22 – Fremont Corridor Fleet and Costs
Fremont Clean Corridor
Fleet Costs
Lines Division Type Peak Buses Spares Total Vehicle Infrastructure Total
200 6 40' 5 1 6 $ 7,800,000 $ 2,976,000 $ 10,776,000
212 6 40' 4 1 5 $ 6,500,000 $ 2,480,000 $ 8,980,000
216 6 40' 2 1 3 $ 3,900,000 $ 1,488,000 $ 5,388,000
232 6 40' 4 1 5 $ 6,500,000 $ 2,480,000 $ 8,980,000
251 6 40' 1 1 2 $ 2,600,000 $ 992,000 $ 3,592,000
SB 6 45' 7 2 9 $ 13,050,000 $ 4,464,000 $ 17,514,000
Total 23 7 30 $ 39,000,000 $ 14,880,000 $ 55,230,00027
Fruitvale Exhibit 23 – Fruitvale Corridor Map
Fruitvale is a vibrant cultural
district and a major node for AC
Transit. The lines serving
Fruitvale – 19, 20, 21, 39, 47,
51A, 54, O – also serve other
parts of East Oakland, Alameda,
and downtown Oakland. In
addition to these lines, Lines 1
(BRT), 14, 40, and 62 serve
Fruitvale and are captured in
other Clean Corridors. These
lines carry 19,000 riders each
weekday and require 41 peak
vehicles to operate due to the
high-frequency of service.
The total cost of converting
these lines to zero-emission is estimated to be $93,392,000, including infrastructure. Line 19 operates out
of Division 2 in Emeryville and all other lines operate out of Division 4 in East Oakland. All lines are assigned
40’ coaches, with the exception of Line O, which can accommodate 45’ over-the-road coaches or 60’
articulated coaches.
Exhibit 24 – Fruitvale Corridor Fleet and Costs
Fruitvale Clean Corridor
Fleet Costs
Lines Division Type Peak Buses Spares Total Vehicle Infrastructure Total
19 2 40' 4 1 5 $ 6,500,000 $ 2,480,000 $ 8,980,000
20 4 40' 4 1 5 $ 6,500,000 $ 2,480,000 $ 8,980,000
21 4 40' 5 1 6 $ 7,800,000 $ 2,976,000 $ 10,776,000
39 4 40' 1 1 2 $ 2,600,000 $ 992,000 $ 3,592,000
47 4 40' 1 1 2 $ 2,600,000 $ 992,000 $ 3,592,000
51A 4 40' 13 3 16 $ 20,800,000 $ 7,936,000 $ 28,736,000
54 4 40' 3 1 4 $ 5,200,000 $ 1,984,000 $ 7,184,000
O 4 45' 10 2 12 $ 15,600,000 $ 5,952,000 $ 21,552,000
Total 41 11 52 $ 67,600,000 $ 25,792,000 $ 93,392,00028
Hayward Exhibit 25 – Hayward Corridor Map
Hayward is in west-central Alameda
County and recently underwent
significant service changes as part of
AC Go aimed at breaking up loops,
increasing frequency and span, and
adding weekend service to make
transit a more attractive option. The
lines serving Hayward – 41, 56, 60, 86,
97, M, and S – also serve San Leandro
and unincorporated portions of
Alameda County. Together, these lines
carry 8,859 riders each weekday and
are less frequent than similar routes to
the north
The total cost of converting these lines
to zero-emission is estimated to be
$86,208,000, including infrastructure.
Line 97 is assigned 60’ articulated coaches, Lines S and M are assigned 45-foot over-the-road coaches and
all other lines are assigned 40’ coaches. All lines operate out of Division 6 in Hayward.
Exhibit 26 – Hayward Corridor Fleet and Costs
Hayward Clean Corridor
Fleet Costs
Lines Division Type Peak Buses Spares Total Vehicle Infrastructure Total
41 6 40' 1 1 2 $ 2,600,000 $ 992,000 $ 3,592,000
56 6 40' 5 1 6 $ 7,800,000 $ 2,976,000 $ 10,776,000
60 6 60' 4 1 5 $ 6,500,000 $ 2,480,000 $ 8,980,000
83 6 40' 4 1 5 $ 6,500,000 $ 2,480,000 $ 8,980,000
86 6 40' 4 1 5 $ 6,500,000 $ 2,480,000 $ 8,980,000
97 6 60' 13 3 16 $ 20,800,000 $ 7,936,000 $ 28,736,000
M 6 45' 3 1 4 $ 5,200,000 $ 1,984,000 $ 7,184,000
S 6 45' 4 1 5 $ 6,500,000 $ 2,480,000 $ 8,980,000
Total 38 10 48 $ 62,400,000 $ 23,808,000 $ 86,208,00029
International Exhibit 27 – International Corridor Map
The international/East 14th
Corridor is served by the
highest-ridership line in the
system – Line 1 – carrying
11,500 riders each weekday
and operating at a 10-minute
frequency. This corridor will
be converted into BRT, in FY
2019/20. The BRT line, named
Tempo, will include longer
stop spacing, level-boarding,
all-door boarding, off-board
fare payment, dedicated
transit lanes, and new transit
signal priority from San
Leandro BART to uptown
Oakland. The corridor will
have a combination of center-running lanes and side-running lanes, meaning the new vehicles procured
for Tempo have doors on both sides of the coach, making them unique in the system. Given they are
brand new, the hybrid coaches used to start the service will not be replaced for another twelve years.
The total cost of converting Line 1 to zero-emission is estimated to be $45,012,000, including
infrastructure. As previously mentioned, this line will be converted into a BRT service with a dedicated
sub-fleet of 60-foot articulated coaches with doors on both sides of the vehicle and will operate out of
Division 4 in East Oakland.
Exhibit 28 – International Corridor Fleet and Costs
International Clean Corridor
Fleet Costs
Lines Division Type Peak Buses Spares Total Vehicle Infrastructure Total
1 4 60' 18 4 22 $ 34,100,000 $ 10,912,000 $ 45,012,000
Total 18 4 22 $ 34,100,000 $ 10,912,000 $ 45,012,00030
Macarthur-Grand Corridor Exhibit 29 – Macarthur-Grand Corridor
The Macarthur-Grand Corridor
stretches from the Foothill Square
Shopping Center near Macarthur
and 106th through downtown
Oakland and into Emeryville and
San Francisco. The corridor
crosses through a variety of
different neighborhoods
including West Oakland, the
Diamond District, Grand Lake, and
the Laurel District. It is served by
Lines 57, NL, and six NX lines,
carrying more than 11,000
customers on a typical weekday.
The corridor requires 33 peak buses and as many as seven spares to operate due to the high frequency of
Line 57 and the combined frequency of the express buses.
The total cost of converting these lines to zero-emission is estimated to be $83,886,000, including
infrastructure. This effort received grant funding from the TIRCP and the SB1 Local Partnership Program
and will be completely converted by 2022.
Exhibit 30 – Macarthur-Grand Corridor Fleet and Costs
Macarthur-Grand Clean Corridor
Fleet Costs
Lines Division Type Peak Buses Spares Total Vehicle Infrastructure Total
57 2 60' 13 3 16 $ 24,800,000 $ 7,936,000 $ 32,736,000
NL 4 60' 14 3 17 $ 26,350,000 $ 8,432,000 $ 34,782,000
NX Series 4 45' 6 2 8 $ 12,400,000 $ 3,968,000 $ 16,368,000
Total 33 8 41 $ 63,550,000 $ 20,336,000 $ 83,886,00031
North Oakland Exhibit 31 – North Oakland Corridor Map
The North Oakland Corridor has three high-
ridership lines – 6, 12, and 18 – which carry
more than 13,000 riders each weekday. It
covers a mix of neighborhoods in Oakland and
Berkeley that range from wealthy – Rockridge
and Temescal – to transitioning – Bushrod,
Longfellow. These lines primarily connect
downtown Oakland with downtown Berkeley
via major corridors such as Telegraph, Martin
Luther King, and Shattuck; all of which have
frequencies equivalent to a major transit
corridor
The total cost of converting these lines to zero-
emission is estimated to be $66,452,000,
including infrastructure. All lines are assigned
40-foot coaches and operate out of Division 2
in Emeryville.
Exhibit 32 – North Oakland Corridor Fleet and Costs
North Oakland Clean Corridor
Fleet Costs
Lines Division Type Peak Buses Spares Total Vehicle Infrastructure Total
6 2 40' 11 3 14 $ 18,200,000 $ 6,944,000 $ 25,144,000
12 2 40' 9 2 11 $ 14,300,000 $ 5,456,000 $ 19,756,000
18 2 40' 10 2 12 $ 15,600,000 $ 5,952,000 $ 21,552,000
Total 30 7 37 $ 48,100,000 $ 18,352,000 $ 66,452,00032
Richmond Exhibit 33 – Richmond Corridor Map
Similar to West Oakland, Richmond is
hemmed in by two freeways and is
home to some heavy industrial sites,
including the Chevron oil refinery. The
area is served by six lines not covered by
other Clean Corridors: 70, 71, 74, 76, L,
and LA. Together, these buses carry
more than 6,500 customers on a typical
weekday and require 18 peak buses and
four spares to operate. These routes
operate at a 30-minute frequency with
higher frequency on the Transbay
routes.
The total cost of converting these lines
to zero-emission is estimated to be
$70,044,000, including infrastructure.
All six lines operate out of Division 3.
The Richmond facility does not
currently have any electric charging
stations or hydrogen fueling
infrastructure in place. As such, any
conversion of the fleet at Division 3 from diesel to zero-emission will require either new electric charging
infrastructure or a new fueling hydrogen station altogether, as well as providing for maintenance
accommodations for FCEBs.
Exhibit 34 – Richmond Corridor Fleet and Costs
Richmond Clean Corridor
Fleet Costs
Lines Division Type Peak Buses Spares Total Vehicle Infrastructure Total
70 3 40' 3 1 4 $ 5,200,000 $ 1,984,000 $ 7,184,000
71 3 40' 5 1 6 $ 7,800,000 $ 2,976,000 $ 10,776,000
74 3 40' 4 1 5 $ 6,500,000 $ 2,480,000 $ 8,980,000
76 3 40' 6 2 8 $ 10,400,000 $ 3,968,000 $ 14,368,000
L 3 45' 8 2 10 $ 13,000,000 $ 4,960,000 $ 17,960,000
LA 3 45' 5 1 6 $ 7,800,000 $ 2,976,000 $ 10,776,000
Total 31 8 39 $ 50,700,000 $ 19,344,000 $ 70,044,00033
San Pablo Avenue Exhibit 35 – San Pablo Avenue Corridor
The San Pablo Avenue Corridor is the longest of
the four, with three lines serving Oakland,
Emeryville, Berkeley, Albany, El Cerrito,
Richmond, and San Pablo. Lines 72, 72M, and
72R carry nearly 14,000 riders on a typical
weekday and have a combined headway of
about 6.5 minutes through the core of the
corridor (Jack London Square to Macdonald
Avenue in Richmond). Together, the lines
require 33 peak buses and seven spares to
operate each weekday. Operating these lines
exclusively with zero-emission vehicles would
benefit more than 150,000 residents living
within a quarter mile of the bus stops they
serve.
The total cost of converting these lines to zero-
emission is estimated to be $73,636,000,
including infrastructure. All of these lines
operate out of Division 3 in Richmond, which
has neither hydrogen fueling or electric
charging infrastructure in place. Any zero-emission buses at Division 3 will require either new electric
charging infrastructure or a new hydrogen fueling station altogether, as well as providing for maintenance
accommodations for FCEBs.
Exhibit 36 – San Pablo Avenue Corridor Fleet and Costs
San Pablo Clean Corridor
Fleet Costs
Lines Division Type Peak Buses Spares Total Vehicle Infrastructure Total
72/M 3 40' 17 4 21 $ 27,300,000 $ 10,416,000 $ 37,716,000
72R 3 40' 16 4 20 $ 26,000,000 $ 9,920,000 $ 35,920,000
Total 33 8 41 $ 53,300,000 $ 20,336,000 $ 73,636,00034
West Berkeley Exhibit 37 – West Berkeley Corridor Map
The West Berkeley Clean Corridor
is a combination of residential,
commercial and light industrial,
covering an area from Emeryville
up to Albany and includes lines
51B, 52, 80, C, F, and J which carry
a combined 16,600 riders each
weekday. It is also served by lines
serving the West Oakland
Corridor as well as the San Pablo
Corridor. Frequency of routes
range from very frequent (every
10 minutes on the 51B) to basic
coverage (every 30 minutes on
Line 80)
The total cost of converting these
lines to zero-emission is estimated to be $86,208,000, including infrastructure. Line 52 uses 60’ Articulated
Coaches while Lines C, J, and Z use 45’ over-the-road coaches and the remainder use 40’ coaches. Line J
and Z operate out of Division 3 in Richmond and all others operate out of Division 2 in Emeryville.
Exhibit 38 – West Berkeley Corridor Fleet and Costs
West Berkeley Clean Corridor
Fleet Costs
Lines Division Type Peak Buses Spares Total Vehicle Infrastructure Total
51B 2 40' 10 2 12 $ 15,600,000 $ 5,952,000 $ 21,552,000
52 2 60' 5 1 6 $ 7,800,000 $ 2,976,000 $ 10,776,000
80 2 40' 6 2 8 $ 10,400,000 $ 3,968,000 $ 14,368,000
C 2 45' 5 1 6 $ 7,800,000 $ 2,976,000 $ 10,776,000
F 2 40' 6 2 8 $ 10,400,000 $ 3,968,000 $ 14,368,000
J/Z 3 45' 6 2 8 $ 10,400,000 $ 3,968,000 $ 14,368,000
Total 38 10 48 $ 62,400,000 $ 23,808,000 $ 86,208,000You can also read