38TH STREET DISTRICT, MINNEAPOLIS, MN - NEIGHBORHOOD ECONOMIC RESILIENCE ASSESSMENT - Resilient Cities Catalyst
←
→
Page content transcription
If your browser does not render page correctly, please read the page content below

Resilient Cities Catalyst

NEIGHBORHOOD ECONOMIC RESILIENCE ASSESSMENT

38TH STREET DISTRICT,
MINNEAPOLIS, MN

                                    July, 2020

                                                             1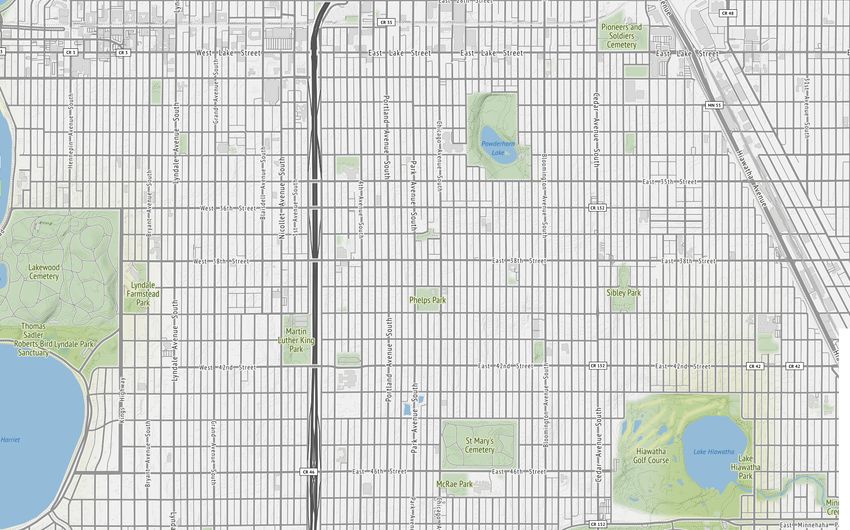
Neighborhood Economic Resilience Assessment. 38th Street District, Minneapolis, MN

                              About Resilient Cities Catalyst

                              Building on the pioneering legacy of 100 Resilient Cities (100RC), senior 100RC executives
                              have now established Resilient Cities Catalyst (RCC). RCC helps cities and their
                              communities build the capacities and partnerships needed to understand, prioritize, and
                              concretely address their risks and chronic stresses as they pursue their strategic goals or
                              recover from crisis.

                              RCC partners with city governments, businesses, neighborhoods, organizations and
                              community stakeholders around the globe to:

                              1. Develop an enabling environment to build strong partnerships between cities
                                  and their communities allowing them to drive policy, planning, design, finance,
                                  and institutional resources for resilience-building efforts.

                              2. Ensure that ideas are turned into meaningful action by addressing gaps
                                  between project plans, project implementation and desired impacts.

                              3. Share and replicate learnings through a growing community of practice.

                              JEB BRUGMANN, AUTHOR/PRINCIPAL
                              Jeb Brugmann is a Founding Principal at Resilient Cities Catalyst. For 30+ years he
                              has supported cities, local governments, and low-income communities worldwide
                              to address their economic development, sustainability, and resilience challenges.

                              AMELIA SMYTH, RESEARCH INTERN
                              Amelia Smyth provided research and data analyst support for this report in her
                              capacity as a Watson Fellow intern with Resilient Cities Catalyst.

                              DESIGN
                              Alex Quinto

                              APPRECIATION
                              RCC appreciates the generous provision of proprietary data on small business
                              closures by Homebase. https://joinhomebase.com/

                                 www.rcc.city            			                          © Resilient Cities Catalyst 2020

2
Resilient Cities Catalyst
1 About This Report
This report provides a snapshot of the neighborhood-level economy of the 38th Street
District neighborhood in Minneapolis, MN, both immediately prior to and six months into
the COVID-19 pandemic. The aim of the report is two-fold:
First, to identify worsening or emerging vulnerabilities in the neighborhood economy,
both at the household and small business economy levels.
Second, to identify ways to apply recovery funds that will not only address those
vulnerabilities, but also support the neighborhood to bounce forward economically
from the current crisis, contributing to fulfillment of the neighborhood’s own
development vision. In addition to recovery funds allocation, the findings in
this report can be used to focus the design and programming of community
development institutions, business improvement associations, community funds etc.
as prioritized in the 38th Street Thrive Plan.
The findings presented in this report are derived from desk research, using a variety of
detailed data sets and data services provided by branches of the U.S. government, the
State of Minnesota, Environics Analytics, and Homebase. They should be viewed as a
starting point for further research on specific vulnerabilities or opportunities through local
surveys, consultations, and workshops. Recommendations for such further research and
community planning are provided in section 8.
A neighborhood’s household and small business economics are just two of the contributing
factors to the vitality and resilience of a local community. They are also just two aspects of
any local economy, which also includes larger employers and anchor institutions, public
sector services and financial supports, as well as the impacts of underlying racial and
other socio-economic inequities. However, households and small businesses provide a
unique financial foundation not only for neighborhood recovery and renewal, but also for
healthy community relations, social development, and resilience.
Strong local small business communities provide convenient access to goods and
services as well as unique, tailored consumer experiences. They contribute significantly
to community identity and sense of place. Small business communities, together with
public institutions and civic organizations, provide the foundation for local employment.
Particularly in times of need, small businesses often serve as hubs of neighborhood
gathering and service.
Strong local household economies are critical not only to the maintenance of local
housing and the stability of property markets, but also to healthy and secure family lives
and to the ability of neighbors to provide aid and support to each other in times of need.
Strong household economies support the maintenance of local cultures of conviviality
and community-mindedness that make communities special and healthy places in which
to raise families.
3Neighborhood Economic Resilience Assessment. 38th Street District, Minneapolis, MN
For these reasons, the economic conditions detailed in this report may be used to inform
local discussions and strategies that address a much broader range of community
initiatives and investments, such as those advanced in the 38th Street Thrive strategic
development plan.
2 What is a ‘Resilient Economy’?
Resilience is the capacity of households, communities, businesses and institutions to
survive, adapt, and thrive in the face of acute shocks (e.g., pandemics, financial crises,
super storms) and the interaction of these shocks with underlying chronic stresses (e.g.,
chronic poverty and household debt, increasing inequality, underfunded institutions,
poorly maintained infrastructures). The word ‘thrive’ is an essential part of the resilience
equation.
A resilient country, city, or community has the institutional capacity to ‘bounce forward’
in the face of shock events, and not just bounce back to a still-vulnerable pre-crisis state.
It has the wherewithal to adapt and recover from shock events in ways that advance its
fulfilment of development and societal ambitions.
An economy has resilience, and it builds resilience in society, when it is developed and
managed in ways that contribute substantially to the reduction of chronic stresses in the
national economy as a whole and in its households, communities, and businesses. The key
words here are preparedness and contribution: prepared to continue economic function
during a crisis and contributing to that ‘bouncing forward’ as communities adapt and
recover.
There is a third factor: economic resilience is not ephemeral; it is built in places. Unlike
financial markets, which exist largely virtually, a nation’s economic life takes place in
neighborhoods and in specialized business districts, in ports, farm regions, and industrial
campuses. To build resilience, the work of preparedness and economic stress reduction
needs to focus on the evident and distinct vulnerabilities, opportunities, and ambitions
within these foundational units of the nation’s economic life. RCC Neighborhood
Economic Resilience Assessments are designed to support local stakeholders to advance
that essential place-based work.
Resilience is the capacity of households,
communities, businesses and institutions to
survive, adapt, and thrive in the face of acute
shocks and the interaction of these shocks
with underlying chronic stresses.
4Resilient Cities Catalyst
3 Key Findings of this Neighborhood Assessment
This assessment was undertaken using data available as of early June 2020. The assessment
identified the following recovery vulnerabilities and opportunities in the 38th Street District.
FIGURE 1. THE 38TH STREET DISTRICT AND LOCAL RETAIL TRADE AREA
Small business opportunity in the neighborhood is evaluated by considering two market areas: a) the
area within the 38th Street District neighborhood itself and b) the neighborhood’s broader trade area.
The trade area for this study is defined as the area of a potential walking or cycling shopping trip from
Local Retail Snapshot 1 compares
the edge of the 38th Street neighborhood.
neighborhood retail goods and services
demand with 38th Street District local retail
business supply or sales.
Recovery Vulnerabilities
Local Retail Snapshot 2 compares 38th Street
District retail demand with the supply of
Recovery vulnerability
retail goods and servicesin theshopping
in the local household economy arises from
very high unemployment
and
catchment or ‘trade area’ that is 0.6 miles
related loss of health insurance coverage
from the outer boundaries of the 38th Street and credit, combined with a high pre-crisis number of cost
District.
burdened households and of residents who are earning less than the metropolitan
area’s living wage.
Local Retail Snapshot 3 compares the
The immediate Q2-3 and
demand of residents 2020 impact of these conditions on housing security were moderated through
establishments
within 0.6 mile trade area to the supply of
limited-term CARES
goods and Act
services Economic
by retail businesses Impact Payments and federal unemployment benefits, combined
within the trade area.
with Paycheck Protection Program employer loans that slowed
the loss of employment
income.
However, as those supports will wane, an immediate survey-based assessment is recommended to
pinpoint current and potential Q4-2020 and Q1-2 2021 rent and mortgage default risks and credit
score declines, in particular for cost-burdened households as the winter heating season approaches.
The challenge of stabilizing household residency and small business occupancy is of course
exacerbated by the potential of family and proprietor health crisis. As 52% of neighborhood
residents had secured health insurance through their employers, this vulnerability is particularly high
among those who have recently lost their jobs. Further survey-based assessment is recommended
to pinpoint these residents and better understand their insurance options.
5Neighborhood Economic Resilience Assessment. 38th Street District, Minneapolis, MN
For the District’s small business community, recovery vulnerabilities reflect a nationwide pattern: the
difficulty of restarting operations with depleted working capital in the midst of a deep loss of local
consumer purchasing power even as the pandemic demands innovation in business models (e.g.,
from in-store to online) and spaces (e.g., ventilation, seating arrangements).
Stabilizing the neighborhood’s household and small business economies, thus enabling residents and
business proprietors to advance their own recoveries once the pandemic has passed, will likely require:
• Timely assistance to help the unemployed re-gain health insurance coverage
• Initiatives with mortgage banks to adjust monthly mortgage payments for cost-burdened
homeowners, thereby limiting defaults
• Renewal if not expansion of winter home heating subsidies for low income households
• Extension of rent deferment programs and anti-eviction policies for both residential and
commercial tenants, with a view towards the solvency of both landlords and tenants
• Provision of household budget, credit and debt management counseling by organizations
with a consumer protection orientation
• Establishment of a small business relief facility to assist proprietors in securing the grant and
loan support, rent and tax deferments, and licensing relief needed to avoid permanent
closure
• Support for small business continuity planning
Resilience-building Opportunities
As community, City, civic, and corporate partners address immediate and Q4-2020 stabilization
issues, the following opportunities to build resilience in the District’s economy could be factored into
38th Street Thrive Plan implementation once the pandemic has passed:
• The largest retail ‘export’ area is food services, which have been particularly hard hit by social
distancing requirements. Small business development initiatives could focus in particular
on helping interested micro- and small catering entrepreneurs develop into food services
contractor operations that serve larger corporate and institutional clients under stable
contracts, thus also securing more than a living wage for those working in this sub-industry area.
• In the area of new local retail development, initiatives could focus on reducing the leakage
of local household and institutional purchasing power from the neighborhood to other areas
of the city. Specific focus should be given to supporting establishments that contribute to
community health (i.e., pharmacies and personal care), to neighborhood housing/building
maintenance and development (i.e., building materials and supplies), and to educational,
cultural and recreational services and activities.
• One of the District’s top five areas of retail spending is online and mail order shopping.
This accounts for $14.6 million in annual purchases by local residents and establishments,
and 15% of all local retail trade. Unless substantial fulfillment operations are located within
the neighborhood, most of this spending represents purchasing power that is leaking out
of the area. Online purchases are likely to have substantially increased during the COVID
crisis and related local business shutdowns. However, opportunity exists to recapture local
purchasing power through the establishment of ‘local money’ systems and innovative online
neighborhood business shopping and home delivery systems.
These above opportunity areas are further elaborated below.
6Resilient Cities Catalyst
4 Community Profile
Demographics
The 38th Street District and its surrounding
residential neighborhood is home to a highly
diverse mix of some 24,000 residents.
RACE AND ETHNICITY
Twenty-two percent of neighborhood residents
are African-American, 28% are of Latinx origin,
6%
Other 22% and 44% are White. Twenty-three percent of
African-American residents have a primary language other than
English. The 38th Street District is home to the
city’s historic African-American community,
and the neighborhood continues to invest in
the preservation, expression, and evolution of
44% 28% its African-American cultural identity.
white Latinx
AVERAGE RESIDENCE
The district reflects a relatively stable mix of
homeowner and renter households in an
aging housing stock. The average residence
of homeowners is 16 years, and of renters is 6.5
years. Sixty-seven percent of the housing stock
was built before 1940.
HOMEOWNERS RENTERS
16 6.5
years years
AGE DISTRIBUTION
Thirty-nine percent of residents are between
25-44 years of age, and 22% are younger than
18 years. Twenty-five percent of households are
single-parent households, which is only slightly
higher than the national average of 23%.
39% 22% 39%
25-44 years under 18 years other
7Neighborhood Economic Resilience Assessment. 38th Street District, Minneapolis, MN
A Community with a Vision—and a Plan
While the 38th Street District community has been stable and is rich in local cultural and community
institutions, in particular in the face of the COVID-19 crisis, the community today is highly vulnerable
to severe household and neighborhood economic strain. The community’s new strategic
development plan—the 38th Street Thrive Plan—was released in late 2019 to address vulnerabilities
and advance community ambitions.
1 2 3
Preserve African-American Advocate for policies that Deepen the support of
legacy through the arts. preserve, protect and build businesses and organizations
African-American wealth. that aligns with the District’s
mission.
4 5
Strengthen access to resilience Attain government investments
programs and educational and enhance public
institutions. infrastructure.
The Plan focuses on the neighborhood’s economic resilience challenges (e.g., housing and
local independent business displacement) and opportunities (cultural and other local business
cluster development). The findings of this report are specifically oriented to support the above
objectives, particularly the design and programming of the new community institutions called for in
the Plan. These institutions include the establishment of a small business association, a community
development corporation, a minority small business relief program, a Black Heritage Land Trust, and
a homebuyers’ club.
8Resilient Cities Catalyst
5 Neighborhood Economic Fundamentals
Neighborhood Incomes
The 38th Street District neighborhood has a mixed income Individuals with an income of
profile, but on average is a lower income neighborhood. The less than $25,000
living wage for an adult individual in metropolitan Minneapolis
is estimated to be $26,187 1. An estimated one-third of the
neighborhood’s work age residents (above 15 years age) have
33%
reported incomes that are less than that amount. Fourteen
percent of residents live below the poverty line. Forty percent
of working age residents are lower middle income, earning
between $25-$65,000.
Related to below average income levels, the neighborhood
has a significant percentage of households that are cost-
Cost-burdened households
burdened by housing costs—their housing costs are more than
30% of gross income. Even before the recent large increase
in unemployment due to the COVID-19 crisis, 38% percent
of renting households were cost burdened, as were 23% of
homeowner households.
38% 23%
RENTERS HOMEOWNERS
Employment and Occupations
Unemployment has increased dramatically among neigh-
borhood residents, rising to 24% in the metro area between
January and June 2020. Drawing upon state unemploy-
Occupational groups with the
highest unemployment levels ment registration data, the largest occupational groups in
the neighborhood that have been affected have been:
• sales workers
• food services industry workers (e.g., restaurants, caterers)
• administrative support workers
FOOD PREPARATION & SALES & RELATED
SERVING OCCUPATIONS OCCUPATIONS • transportation services (taxis, goods delivery)
• education and training
• construction occupations
• and even healthcare (possibly related to the
reduction in elective health services)
TRANSPORTATION CONSTRUCTION
Occupational groups with the highest unemployment
SERVICES OCCUPATIONS
levels are: arts, entertainment, sports, and media workers;
agricultural, fishing, and forestry workers; personal care
and services workers (ranging from home and elderly
care, childcare, and personal care - e.g. hair and nail
salons); and food services industry workers.
1 Living wage calculations are drawn from the MIT living wage calculator https://livingwage.mit.edu/.
9Neighborhood Economic Resilience Assessment. 38th Street District, Minneapolis, MN
FIGURE 2. UNEMPLOYMENT RATE BY OCCUPATIONAL GROUP
Unemployment Estimated number
rate as of May of neighborhood
31, 2020 (based unemployment
Occupational Group
on January 2020 claims. January 1
workforce) to May 31, 2020
Arts, Design, Entertainment, Sports, and Media Occupations 55% 65
Farming, Fishing, and Forestry Occupations 50% 2
Personal Care and Service Occupations 45% 65
Food Preparation and Serving Occupations 44% 245
Construction and Extraction Occupations 35% 69
Sales and Related Occupations 28% 101
Healthcare Practitioners and Technical Occupations 26% 55
Installation, Maintenance, and Repair Occupations 22% 24
Building and Grounds Cleaning and Maintenance Occupations 20% 32
Production Occupations 20% 43
Transportation and Material Moving Occupations 19% 72
Management Ocupations 19% 46
Education, Training, and Library Occupations 18% 65
Office and Administrative Support Occupations 17% 86
Healthcare Support Occupations 14% 19
Community and Social Services Occupations 12% 11
Architecture and Engineering Occupations 12% 5
Legal Occupations 10% 2
Protective Service Occupations 10% 4
Computer and Mathematical Occupations 8% 11
Business and Financial Operations Occupations 7% 13
Life, Physical, and Social Science Occupations 5% 3
Source: Minnesota Department of Employment and Economic Development, Unemployment Insurance Statistics. Higher (labeled red )
and lower (labeled green ) than the 24% average unemployment rate for the 7 County Twin Cities as of May 31st 2020 (based on January
2020 workforce).
Health Insurance
Especially in times like these, health insurance coverage plays a central role in the stability of
household income and wealth preservation. Prior to the start of the COVID-19 pandemic (January
2020), health insurance coverage among households in the 38th Street District neighborhood was
high, with 91% of residents having coverage. Fifty-six percent of neighborhood residents received
their health insurance either fully through their employers (52%) or partly through their employers
(4%). Therefore, significant loss of health insurance coverage has likely occurred due to loss of
employment.
10Resilient Cities Catalyst
EMERGING HOUSEHOLD ECONOMY VULNERABILITIES
These and other conditions have a compounding impact upon the stability of basic
household economy. Further local survey research, consultation, and evaluation with informed
neighborhood stakeholders is recommended to assess how to immediately mitigate the
combined effects of employment in sectors paying less than the metro area living wage sectors,
the high number of cost-burdened households, high pandemic-related unemployment and loss
of income, and recent loss of health insurance coverage. To prevent cascading effects for
years to come, household support initiatives are likely needed to:
Avoid mortgage, rent, and Avoid loss of good credit Recover health insurance Keep up with home
property tax delinquency standing coverage energy bills and repairs
and default (e.g., roofs, foundations) in
particular in the older
housing stock.
Pinpointing and efficiently targeting recovery support resources to households facing the above
mix of vulnerabilities will require further local survey research.
6 Neighborhood Business Fundamentals
Figure 3 provides a snapshot of the industry mix within the 38th Street District, as reflected in the
distribution of employment in different sectors and industry areas.
The local small business community within the 38th Street District has notable strength in the food
services industry. Local caterers and food service contractors sell $4 million more in goods and
services than neighborhood demand. In other words, they export their goods and services to the
broader local shopping catchment area (otherwise known as the local trade area within 0.6 miles
of the edge of the District) and beyond.
The neighborhood is somewhat underserved in other subindustry areas, but not extremely so. For
instance, health and personal care stores and grocery stores are two areas where residents are
having to leave the neighborhood to meet their shopping needs (see Figure 5). That being said,
residents and establishments of the 38th Street District neighborhood have found local shopping
options in almost all retail goods and services areas within the neighborhood’s broader local trade
area. In the next section, some aspects of leakage of local purchasing power from the local trade
area are highlighted as potential small business development opportunities, pending stabilization
through the COVID shutdown(s) and associated deep recession.
11Neighborhood Economic Resilience Assessment. 38th Street District, Minneapolis, MN
FIGURE 3. 38TH STREET DISTRICT EMPLOYMENT BY INDUSTRY
% of Total Employment of
NAICS
Industry Title 38th Street District Residents,
Code
16 Yrs-Older, as of June 1, 2020
62 Health Care and Social Assistance 16%
55 Management of Companies and Enterprises 12%
61 Educational Services 11%
Administrative and Support and Waste Management
56 10%
and Remediation Services
54 Professional, Scientific, and Technical Services 9%
44 Retail Trade 7%
72 Accomodation and Food Services 7%
31 Manufacturing 6%
52 Finance and Insurance 5%
48 Transportation and Warehousing 4%
92 Public Administration 4%
42 Wholesale Trade 4%
23 Construction 3%
81 Other Services (except Public Administration) 3%
71 Arts, Entertainment, and Recreation 2%
51 Information 2%
53 Real Estate and Rental and Leasing 2%
Sources: American Community Survey, and Minnesota Department of Employment & Economic Development
Weekday, daytime shopping in the trade area has been reinforced by a segment of residents
who work in the area. For 18% of the residents, travel time to work is 15 minutes or less. In 2018,
fifteen percent of residents got to work by walking, cycling, or work at home, reinforcing daytime
shopping demand and related small business opportunities.
Small businesses in the 38th Street District have been hard hit by the COVID-19 economic crisis (see
Figure 4). Drawing upon daily operations data for small businesses in the six Minneapolis cultural
district neighborhoods, collected through the Homebase employee scheduling and time tracking
app, an estimated 66% of local small businesses were closed in the May-June 2020 period. In the
food services subindustry area—the District’s strongest small business cluster—an estimated 69%
were closed. By June, among those small businesses that were open and operating, the average
hours worked per employee had dropped to 3 hours/per day. Between mid-June and mid-July
those businesses that re-opened were operating again at near pre-lockdown levels. However, 23%
of the businesses in the original sample did not re-open, an early indicator of a potentially high level
of small business failures.
12Resilient Cities Catalyst
FIGURE 4. COVID CRISIS SMALL BUSINESS CLOSURES IN THE 38TH STREET DISTRICT
Recovery Status: Business Openings & Operations
Average percentage of days open (of all establishments in sample)
Jan 15 - Feb 14 Feb 15 - Mar 14 Mar 15 - Apr 14 Apr 15 - May 14 May 15 - June 14 June 15 - July 14
All 75% 70% 38% 37% 34% 53%
Food & 85% 81% 29% 33% 31% 54%
Drink
Average hours worked per day per employee (in open establishments only)
Jan 15 - Feb 14 Feb 15 - Mar 14 Mar 15 - Apr 14 Apr 15 - May 14 May 15 - June 14 June 15 - July 14
All
6.75 6.61 6.38 6.6 3.1 6.1
hrs/day hrs/day hrs/day hrs/day hrs/day hrs/day
Food & 7.09 6.74 6.28 6.7 2.6 6.0
Drink
hrs/day hrs/day hrs/day hrs/day hrs/day hrs/day
Source: Homebase user data. Percentages derived from sample of small business users from the six Cultural District neighborhoods who were stable users of Homebase since or before 12/1/2019
Loan support from the federal Paycheck Protection Program (PPP) was widely received by
businesses, cultural institutions, and other non-profit organizations in the neighborhood, but
the average amount of loan support received was small. U.S. Department of the Treasury data
shows that the average PPP loan for retail goods and services businesses in the 38th Street District
was $34,100. Local PPP support in other sectors was broadly received but also low: the average
education services sector loan was $34,000; social assistance agencies received $57,300 on
average; and the average loan to religious and civic non-profits was $56,550. Financial support at
these levels does not likely enable improvements and business modifications required to operate
in the ‘new normal’ context.
Small business closures for such an extended period, and with such a low level of financial support,
may have resulted in rent delinquency, loss of working capital for inventory or facility improvements,
and insolvencies. Assessing the precise types of businesses that are struggling and that will continue
to struggle to recover will require detailed investigation via local survey research.
The impacts of the above local small business closures will have rippled beyond the businesses them-
selves into the local household economy due to the concentration of local residents’ unemployment
in key neighborhood subindustry sectors, in particular in food services and health care.
13Neighborhood Economic Resilience Assessment. 38th Street District, Minneapolis, MN
7 Neighborhood Retail Sector Opportunities
This section of the report presents three different local business supply and
resident purchasing power snapshots for the retail sector in the 38th Street
District area. These are snapshots of retail sector strengths, weaknesses,
and opportunities as of January 2020.
Local Retail Snapshot 1 compares neighborhood
retail goods and services demand with 38th
Street District local retail business supply or sales.
Local Retail Snapshot 2 compares 38th Street
District retail demand with the supply of retail
goods and services in the shopping catchment
or ‘trade area’ that is 0.6 miles from the outer
boundaries of the 38th Street District.
Local Retail Snapshot 3 compares the demand
of residents and establishments within 0.6 mile
trade area to the supply of goods and services
by retail businesses within the trade area.
Through exploration of these three supply and demand snapshots
the report highlights the potential for local growth in retail goods and
services to which recovery investments and small business development
support could be directed.
Local Retail Snapshot 1
The figure below indicates the extent to which retailers within the 38th Street District have served
the demand of neighborhood residents and establishments. It shows the goods and services
areas in which local retail businesses are selling more than is demanded by District residents and
establishments; meaning, the retail areas where local retailers are both satisfying neighborhood
demand and selling to customers outside of the District. It also shows the areas where local retailers
have been unable to fully meet the demand from local residents and establishments; in other
words, where local purchasing power is leaking out of the neighborhood to businesses in other
geographies. The figure also presents the average annual income of employees in each retail area
to indicate which business areas might provide the greatest boost to local employee incomes.
14Resilient Cities Catalyst
FIGURE 5. LOCAL RETAIL SNAPSHOT 1
How much are retailers within the 38th Street District serving the
demand of neighborhood residents and establishments?
How much are retailers within the 38th Street District serving the demand of neighborhood residents and establishments?
Residents spend Local businesses make Every year,
$125.4M $96.6M $28.8M
each year in retail goods each year in retail sales is spent on retail goods and services
and services outside of the neighborhood
ESTIMATED ANNUAL LEAKAGE SURPLUS
NAICS CATEGORIES INDUSTRY WAGE 2019 (THOUSANDS OF US DOLLARS)
Food service contractors $30,264 $2,100
Caterers $22,568 $1,900
Book stores and news dealers $18,772 $-204
Sporting goods, hobby, and musical instrument stores $22,100 $-1,400
Electronics and appliance stores $52,988 $-1,900
HOUSEHOLD APPLIANCE STORES $52,104 $-287
ELECTRONICS STORE $53,144 $-1,600
Miscellaneous store retailers $27,144 $-2,800
OFFICE SUPPLIES, STATIONERY, AND GIFT STORES $26,520 $
-582
PET AND PET SUPPLIES STORES $27,872 $-591
Furniture and home furnishings stores $41,964 $-3,300
Restaurants and other eating places $21,112 $-3,300
Food and beverage stores $25,688 $-4,900
GROCERY STORES $26,468 $-3,400
CONVENIENCE STORES $17,004 $-542
SPECIALTY FOOD STORES $21,320 $-460
Clothing and clothing accessories stores $22,412 $-5,500
CLOTHING STORES $19,240 $-3,800
SHOE STORES $22,412 $-852
JEWELRY, LUGGAGE, AND LEATHER GOODS STORES $43,680 $-791
Health and personal care stores $43,836 $-7,100
PHARMACIES AND DRUG STORES $49,140 $-5,800
Building material and garden equipment and supplies dealers $34,580 $-7,800
BUILDING MATERIAL AND SUPPLIES DEALERS $34,944 $-6,900
HOME CENTERS $29,016 $-3,700
PAINT AND WALLPAPER STORES $52,624 $-266
HARDWARE STORES $23,972 $-557
OTHER BUILDING MATERIAL DEALERS $64,792 $-2,300
LAWN AND GARDEN EQUIPMENT AND SUPPLIES STORES $32,084 $-904
Gasoline stations $24,232 $-8,000
General merchandise stores $24,544 $-14,500
Motor vehicle and parts dealers $54,808 $-22,400
Wages under the Metropolitan Adult Living Wage of $26,187
15Neighborhood Economic Resilience Assessment. 38th Street District, Minneapolis, MN
1.1 FOOD SERVICES: AN OPPORTUNITY TO INCREASE LOCAL INCOMES BY EVOLVING
BUSINESSES FROM CATERING TO FOOD SERVICES CONTRACTING?
The largest local retail sales area is food services, at $15.6 million in
sales per annum. Although restaurants and eating places account for
$13.3 million of that amount, there is still local purchasing power that
is not being served by 38th Street District restaurants. Local residents
purchase $3.3 million from restaurants outside of the neighborhood. Local caterers and food
This could simply reflect the reality that local residents also use service contractors are net
exporters of
restaurants near their work places outside of the area, or just have
favorite locales elsewhere. Nonetheless, the strength of the District´s
restaurant subindustry suggests opportunity for further business
$4
MILLION
development and growth.
in goods and services
In another food services area, local caterers and food service
contractors are net exporters of $4 million in goods and services sold,
above and beyond the demand from District residents and organizations. This indicates opportunity
to further develop these local businesses through provision of business management support and
finance, marketing, and improved supply of suitable operating spaces. In considering options,
the annual wage differential between catering and food service contracting establishments is
noteworthy. On average, employees in the catering business earn less than a living wage, whereas
workers in food service contracting earn on average $4,000 more than the region’s living wage.
1.2 OTHER BUSINESS LEAKAGE AREAS: AN OPPORTUNITY FOR NEW RETAILERS?
Retail areas with large purchasing power leakage due to lack of available local shopping options
include building materials and supplies, health and personal care (including pharmacies), groceries,
clothing, home furnishings, and a range of general merchandise stores. We recommend evaluating
four criteria when considering whether to provide support for local small business development in
any of these areas:
• Is the local demand being met by retailers in the immediate local market catchment or 0.6
mile trade area? Is the unmet demand great enough to support a new small business, e.g.,
more than $1 million in unmet demand per annum?
• Is improved access to the product or service important to the achievement of community
development objectives, e.g., to improved health outcomes?
• Does the retail area offer an average wage that is at or above the metro area living wage?
• Would businesses in this area offer local employment opportunities, in particular to
occupational groups facing high unemployment?
Employees in the catering business earn less
than a living wage, whereas workers in food
service contracting earn on average $4,000
more than the region’s living wage.
16Resilient Cities Catalyst
These opportunities will be further evaluated with reference to Local Retail Snapshot 2, which
indicates whether 38th Street District demand can be satisfied by businesses located in the 0.6 mile
trade area.
1.3 NON-STORE RETAIL: AN OPPORTUNITY FOR GREATER LOCAL EMPLOYMENT?
One of the District’s top five areas of retail spending is online and mail
order shopping. This accounts for $14.6 million in annual purchases by
local residents and establishments, and 15% of all local retail trade. Unless
substantial fulfillment operations are located within the neighborhood, Online and mail
most of this spending represents purchasing power that is leaking out of the order shopping
accounts for
area. Online purchases are likely to have substantially increased during the
COVID crisis and related local business shutdowns. However, opportunity
exists to recapture local purchasing power through the establishment
$14.6
MILLION
of ‘local money’ systems and innovative online neighborhood business
in local purchases
shopping and home delivery systems.
Retail areas with large purchasing power leakage
due to lack of available local shopping options
include building materials and supplies, health and
personal care (including pharmacies), groceries,
clothing, home furnishings, and a range of general
merchandise stores.
Local Retail Snapshot 2
The figure below indicates the extent to which retailers within the 0.6 mile local shopping trade area
are able to serve the demand from 38th Street District residents and establishments, in particular
in areas that are not being served by retailers within the District itself. It also shows the areas where
0.6 mile trade area retailers have been unable to fully meet the demand from District residents and
establishments; in other words, where the purchasing power of District residents and establishments
is leaking out of the trade area to businesses in other geographies.
17Neighborhood Economic Resilience Assessment. 38th Street District, Minneapolis, MN
FIGURE 6. LOCAL RETAIL SNAPSHOT 2
How much are retailers within the broader local area
(0.6 mile trade area) serving the demand of 38th Street
District neighborhood residents and establishments?
How much are retailers within the broader local area (0.6 mile trade area) serving the demand of 38th
Street District neighborhood residents and establishments?
38th Street District residents spend Trade area businesses make Every year,
$125.4M $887.9M $762.5M
each year in retail goods each year in retail sales is made by trade area businesses
and services excluding purchases made by
38th Street District residents
ESTIMATED ANNUAL LEAKAGE SURPLUS
NAICS CATEGORIES INDUSTRY WAGE 2019 (THOUSANDS OF US DOLLARS)
Restaurants and other eating places $21,112 $97,978
Food and beverage stores $25,688 $73,599
GROCERY STORES $26,468 $72,136
CONVENIENCE STORES $17,004 $-537
SPECIALTY FOOD STORES $21,320 $-444
Motor vehicle and parts dealers $54,808 $55,947
General merchandise stores $24,544 $21,296
Food service contractors $30,264 $14,697
Gasoline stations $24,232 $12,130
Clothing and clothing accessories stores $22,412 $11,503
CLOTHING STORES $19,240 $8,694
SHOE STORES $22,412 $-850
JEWELRY, LUGGAGE, AND LEATHER GOODS STORES $43,680 $3,659
Caterers $22,568 $5,662
Building material and garden equipment and supplies dealers $34,580 $2,085
BUILDING MATERIAL AND SUPPLIES DEALERS $34,944 $2,985
HOME CENTERS $29,016 $6,096
PAINT AND WALLPAPER STORES $52,624 $-264
HARDWARE STORES $23,972 $-552
OTHER BUILDING MATERIAL DEALERS $64,792 $-2,295
LAWN AND GARDEN EQUIPMENT AND SUPPLIES STORES $32,084 $-900
Sporting goods, hobby, and musical instrument stores $22,100 $646
Health and personal care stores $43,836 $-65
PHARMACIES AND DRUG STORES $49,140 $1,169
Book stores and news dealers $18,772 $-202
Electronics and appliance stores $52,988 $-575
HOUSEHOLD APPLIANCE STORES $52,104 $-285
ELECTRONICS STORES $53,144 $-290
Furniture and home furnishings stores $41,964 $-1,204
Miscellaneous store retailers $27,144 $-1,451
OFFICE SUPPLIES, STATIONERY, AND GIFT STORES $26,520 $165
PET AND PET SUPPLIES STORES $27,872 $-323
Wages under the Metropolitan Adult Living Wage of $26,187
* Bar not shown to scale in relation to the rest of the bars.
18Resilient Cities Catalyst
2.1 VALIDATING OPPORTUNITIES FOR NEW DISTRICT RETAIL
This retail snapshot shows that trade area businesses
cannot fully meet District demand for: convenience stores Retail areas with purchasing
and specialty foods, shoes, building materials supplies, power leakage due to lack of
available local shopping
furniture and home furnishings, electronics, book stores,
options include
and miscellaneous other retail goods. However, applying
the criteria in 1.3, only the following have more than $1
million in unmet District demand and offer incomes at or
above the living wage:
• Furniture and home furnishings other building
• Other building materials and gardening equipment materials and
supplies
The high unemployment rate for workers in buildings and
grounds cleaning and maintenance suggests that there
would be a ready local workforce for new local businesses
in the building materials and gardening equipment goods
health and
and services area. The development of local businesses personal care
in these areas is aligned with the 38th Street Thrive Plan
objectives to increase the local affordable housing supply
and establish a community development corporation.
home furnishings
Local Retail Snapshot 3
The figure below indicates the extent to which retailers within the 0.6 mile local trade area
have been able to fulfil demand from the residents and establishments located in that trade
area. This snapshot indicates potential retail development opportunities for new businesses
within the District to serve demand in the trade area that is not being met by existing trade
area establishments.
19
Neighborhood Economic Resilience Assessment. 38th Street District, Minneapolis, MN


          FIGURE 7. LOCAL RETAIL SNAPSHOT 3
          How much are retailers within the broader local area
          (0.6 mile trade area) serving the demand of residents
          and establishments in that area?


             How much are retailers within the broader local area (0.6 mile trade area) serving the demand of residents
             and establishments in that area?

                              $978M                                                    $888M                                                  $90M
                    Amount spent by neighborhood residents                     Amount made by trade area businesses                  Amount spent by the trade area's
                     and establishments in the broader 38th                          each year in retail sales                    residents and establishments each year
                      Street District trade area each year in                                                                     on retail goods and services outside of
                            retail goods and services                                                                                            the area.

                                                                                               ESTIMATED ANNUAL                                    LEAKAGE      SURPLUS
                                                                        NAICS CATEGORIES      INDUSTRY WAGE 2019                                (THOUSANDS OF US DOLLARS)

                                                                 Food service contractors           $30,264                                                        $7,419
                                                                                  Caterers          $22,568                                                       $4,203
                                                         Book stores and news dealers               $18,772                                                      $2,899
                               Sporting goods, hobby, and musical instrument stores                 $22,100                                         $-1,578
                                                      Electronics and appliance stores              $52,988                                        $-8,860
                                                           HOUSEHOLD APPLIANCE STORES               $52,104                                    $-13,478
                                                                         ELECTRONICS STORE          $53,144                                         $-2,185
                                                          Miscellaneous store retailers             $27,144                                     $-11,293

                                             OFFICE SUPPLIES, STATIONERY, AND GIFT STORES           $26,520                                   $-20,430

                                                                PET AND PET SUPPLIES STORES         $27,872                                         $-3,786

                                                Furniture and home furnishings stores               $41,964                                        $-4,396

                                                  Restaurants and other eating places               $21,112                                $-24,209

                                                                Food and beverage stores            $25,688                                $-25,817

                                                                           GROCERY STORES           $26,468                                    $-15,887

                                                                       CONVENIENCE STORES           $17,004                                        $-4,222

                                                                     SPECIALTY FOOD STORES          $21,320                                         $-3,501

                                              Clothing and clothing accessories stores              $22,412                                $-26,063

                                                                          CLOTHING STORES           $19,240                                   $-17,708

                                                                               SHOE STORES          $22,412                                         $-6390

                                            JEWELRY, LUGGAGE, AND LEATHER GOODS STORES              $43,680                                         $-1,965

                                                       Health and personal care stores              $43,836                         $-48,907

                                                           PHARMACIES AND DRUG STORES               $49,140                             $-39,045

                       Building material and garden equipment and supplies dealers                  $34,580                        $-53,276

                                                 BUILDING MATERIAL AND SUPPLIES DEALERS             $34,944                          $-46,158

                                                                             HOME CENTERS           $29,016                                $-21,498

                                                                PAINT AND WALLPAPER STORES          $52,624                                         $-2,097

                                                                         HARDWARE STORES            $23,972                                         $-4,387

                                                        OTHER BUILDING MATERIAL DEALERS             $64,792                                   $-18,177

                                       LAWN AND GARDEN EQUIPMENT AND SUPPLIES STORES                $32,084                                        $-7,118

                                                                         Gasoline stations          $24,232                        $-53,974

                                                           General merchandise stores               $24,544                  $-76,800

                                                       Motor vehicle and parts dealers              $54,808           $-105,042

                                                                                                                         Wages under the Metropolitan Adult Living Wage of $26,187

20
Resilient Cities Catalyst
3.1 DEVELOPING DISTRICT BUSINESSES TO MEET GAPS IN DEMAND IN THE RETAIL TRADE AREA
The data for the 0.6 mile trade area show that it has the same areas of business strength as does the
District itself; namely, in the food services area. Those strengths aside, the trade area has purchasing
power leakage in every other retail area. Considering those retail areas that have an average
annual wage above the living wage, consideration should be given to opportunities for District
business development in the following goods and services areas (in order of unmet local demand):
• Building materials and gardening equipment
• Health and personal care stores, incl. pharmacies
• Furniture and home furnishings
• Miscellaneous store retailers, incl. office supplies, and pet and pet supplies
• Grocery stores
• Electronics and appliance stores
Of course, local small businesses in some of the above areas are more able to compete with larger,
chain retailers and online retailers. Therefore, the level of competition needs to be considered
when evaluating the potential for local retailers to capture unmet trade area demand.
FIGURE 8. RECAPTURING LOCAL PURCHASING POWER FOR LOCAL BUSINESS ESTABLISHMENTS
Area Estimated Annual Online & % Total
Mail Order Purchases Retail Trade
38th Street District $ 14.5 million 15%
0.6 Mile Trade Area $ 114.4 million 12%
In addition to purchasing power leakage to other city districts, the 38th Street District and its shopping
trade area lose significant purchasing power to online retailers. Online purchasing has likely increased
during the COVID crisis and local business shutdowns. Concerted efforts will likely be needed to
recapture this leakage in support of local business establishments and employment.
21Neighborhood Economic Resilience Assessment. 38th Street District, Minneapolis, MN
8 Recommendations for Further Research &
Consultations
The above situational assessment is provided 1) to help local stakeholders consider how pre-
existing neighborhood development efforts might be adjusted to factor COVID pandemic crisis
impacts and recovery challenges, and 2) to help local researchers focus any further on-the-
ground assessment efforts. In addition to the above purposes, the assessment sheds further light
on the nature and dimensions of chronic stresses that make the neighborhood vulnerable to
shock events. Finally, it highlights issues to be addressed to build a stronger, future foundation for
neighborhood economic life.
RCC recommends the following follow-up activities to prepare economic recovery and resilience
initiatives for the 38th Street District neighborhood:
Further Research
The data used for this report enables high-level identification of key exposures and vulnerabilities in
the neighborhood that could lead to cascading economic losses and hardships. The gathering of
more precise municipal and survey-based data is recommended to prepare public and charitable
investments to address these vulnerabilities, so that resources can be tailored and directed to the
most vulnerable households, businesses, streets and locations.
Issues meriting local survey and interview efforts include:
• Identifying households and businesses currently in or soon facing rent or mortgage payment
arrears
• Identifying households without health insurance, particularly those who lost insurance
through loss of employment
• Identifying business proprietors who have permanently closed or will soon need to
permanently close their businesses
• Identifying rental properties with growing and/or sustained vacancies
The collection and analysis of detailed local data provides an opportunity to provide training and
temporary employment to selected local residents, and to build community organization capacity
to monitor the recovery process and to evaluate future resilience issues.
This assessment also would be further improved through inclusion of trend data on health, public
safety, and equity/justice outcomes; public/urban services provision; property values and rents;
and demographic change.
22Resilient Cities Catalyst
Recovery Planning Workshops
The process of resilience building in any city or location involves the use of investments, grants,
and initiatives to address the interacting shock (i.e., risk and exposure) and stress (i.e., vulnerability)
dimensions of the community’s situation. It further involves using all investments to further advance
the community’s vision for itself, with its multiple economic, social, and cultural objectives. Therefore,
RCC recommends that assessments of this nature be used not only to design and target specific
recovery measures but to craft a comprehensive set of initiatives to advance a local development
and resilience agenda that addresses the interactions between multiple exposures, vulnerabilities,
opportunities, and ambitions. In the case of the 38th Street District, community stakeholders and
leaders have already developed such a comprehensive agenda. In this instance, the assessment
findings are best used to support more specific designs and relevant adjustments to the initiatives
outlined in the 38th Street Thrive Plan in the context of recovery planning.
Neighborhood Recovery and Resilience Monitoring
Resilient communities have the capacity and/or partnership support to monitor their exposures,
vulnerabilities, recovery progress, and the achievement of targeted community development
outcomes. Recovery resources should be targeted to build that capacity or support. In addition to
monitoring the conditions identified in this report, consideration should be given to benchmarking
the 38th Street District neighborhood to city-wide conditions and to selected other target
neighborhoods, reflecting the City’s commitment to achieving equitable outcomes for the 38th
Street neighborhood and across the city’s neighborhoods.
23You can also read