Three dimensional and two dimensional relationships of gangliogenesis with folliculogenesis in mature mouse ovary: a Golgi-Cox staining approach ...
←
→
Page content transcription
If your browser does not render page correctly, please read the page content below
www.nature.com/scientificreports
OPEN Three‑dimensional
and two‑dimensional
relationships of gangliogenesis
with folliculogenesis in mature
mouse ovary: a Golgi–Cox staining
approach
Mohammad Ebrahim Asadi Zarch1,7, Alireza Afshar2,7, Farhad Rahmanifar3,7,
Mohammad Reza Jafarzadeh Shirazi1*, Mandana Baghban4, Mohammad Dadpasand1,
Farzad Mohammad Rezazadeh1, Arezoo Khoradmehr2, Hossein Baharvand5,6 &
Amin Tamadon2*
The present study was set out to investigate two-dimensional (2D) and three-dimensional (3D)
evaluations of ovarian nervous network development and the structural relationship between
folliculogenesis and gangliogenesis in mouse ovaries. Adult mice ovarian tissue samples were
collected from follicular and luteal phases after cardiac perfusion. Ovarian samples were stained by a
Golgi–Cox protocol. Following staining, tissues were serially sectioned for imaging. Neural filaments
and ganglia were present in the ovaries. In both 2D and 3D studies, an increase in the number and
area of ganglia was seen during the follicular growth. The same pattern was also seen in corpora lutea
development. However, in some cases such as ratio of ganglia number to follicle area, the ratio of
ganglia area to follicular area, 2D findings were different compared with the 3D results. 3D analysis
of ovarian gangliogenesis showed the possible direct effect of them on folliculogenesis. Golgi–Cox
staining was used in this study for 3D evaluation in non-brain tissue. The results of 3D analysis of the
present study showed that, in some cases, the information provided by 2D analysis does not match
the reality of ovarian neuronal function. This confirmed the importance of 3D analysis for evaluation of
ovarian function.
Follicles are basic units of mammalian ovary. The development of rodent’s follicles begins at neonatal period,
the stage at which primordial follicles are formed1. Each primordial follicle has an oocyte which is held at first
prophase of meiosis and is covered by flattened granulosa cells layer2. After female maturation the estrous cycle
starts. Through this cycle, primary, secondary, antral and preovulatory follicles develop from primordial f ollicles3.
At this stage, most of the antral follicles undergo atretic degeneration and a few of them, under stimulation of
follicle-stimulating hormone (FSH) and luteinizing hormone (LH), become preovulatory follicles2,4. After that,
due to follicle response to LH hormone, the follicle ovulates. The remaining cell transforms and forms corpus
luteum4. The ovarian cycle in mouse strains is called estrous cycle. This cycle includes four stages: proestrus and
1
Department of Animal Sciences, College of Agriculture, Shiraz University, 71441‑65186 Shiraz, Iran. 2The Persian
Gulf Marine Biotechnology Research Center, The Persian Gulf Biomedical Sciences Research Institute, Bushehr
University of Medical Sciences, 75146‑33196 Bushehr, Iran. 3Department of Basic Sciences, School of Veterinary
Medicine, Shiraz University, Shiraz, Iran. 4Department of Obstetrics and Gynecology, School of Medicine, Shiraz
University of Medical Sciences, Shiraz, Iran. 5Department of Stem Cells and Developmental Biology, Cell Science
Research Center, Royan Institute for Stem Cell Biology and Technology, ACECR, Tehran, Iran. 6Department of
Developmental Biology, University of Science and Culture, Tehran, Iran. 7These authors contributed equally:
Mohammad Ebrahim Asadi Zarch, Alireza Afshar and Farhad Rahmanifar. *email: jafarzd@shirazu.ac.ir;
amintamaddon@yahoo.com
Scientific Reports | (2021) 11:5547 | https://doi.org/10.1038/s41598-021-84835-0 1
Vol.:(0123456789)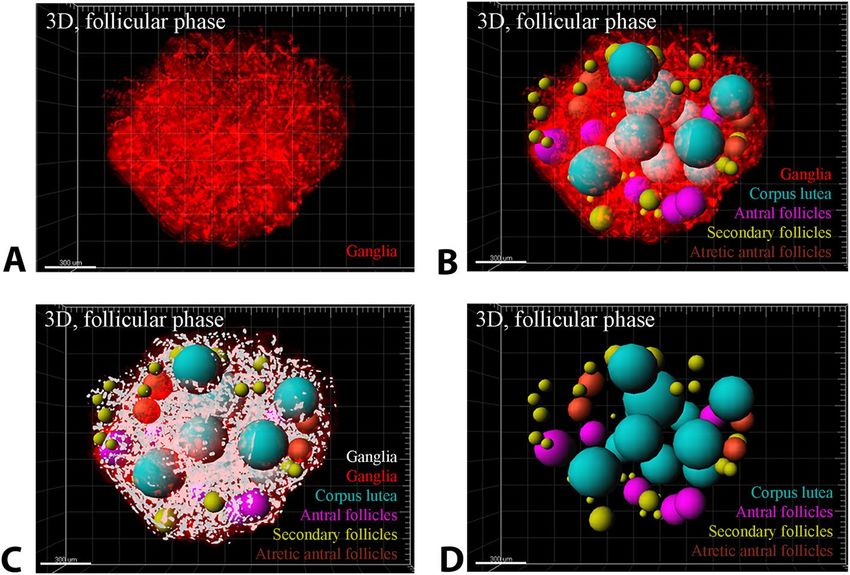
www.nature.com/scientificreports/
estrus as follicular phase and metestrus and diestrus as luteal phase5. Ovulation and corpus luteum formation
occurs in estrus stage. Presence of corpus luteum is vital for progesterone secretion 6,7. So, due to lack of preg-
nancy, corpus luteum undergoes degeneration and progesterone secretion reduces at proestrus stage. Hence,
next estrous cycle s tarts8.
The mammalian’s ovary is regulated by hormonal factors and direct neuron e ffects9. Several studies have
demonstrated that in mouse strains there are distinct populations of neurons, both internal and external neurons.
It has been shown that the chemical phenotypes of ovarian neurons of some mouse strains are sympathetic,
similar to primates10. Due to results of previous studies, it is now well established that ovarian neurons are
derived from neural crest cells, which form with complete ovarian maturation and subsequent reproductive
functions11. Noradrenergic nerves are expressed in the ovary near b irth12. It has been conclusively shown that
the total number of neurons in puberty increases and then decreases12. External nervous system of mouse ovary
has many roles. Several studies have shown its role in developmental process, cyclic stages, pregnancy, and aging
process13–15. These nerves and ganglia are responsible for ovarian estradiol s ecretion15. The number of internal
neurons in neonatal ovaries was lower than that of adult ovaries, some of which form ganglia and n etworks16.
Some neurotransmitters such as neurotrophins have an important role in follicle growth. For example,
reduction of brain-derived neurotrophic factor (BDNF) and neurotrophin-4 (NT-4) can cause folliculogenesis
disorder17. Also, these nerves and ganglia can take part in pathological conditions such as polycystic ovary syn-
drome (PCOS)18. Based on the previous studies, hypothetically assumed that the ganglia may have an important
role in mice ovary function. In spite of the fact that many researchers have utilized the two-dimensional (2D)
methods for evaluation of ovarian nervous system, so far no three-dimensional (3D) analysis research has been
performed on ovarian ganglia using image processing techniques and non-immunostaining methods. The pur-
pose of the present study was to perform three-dimensional evaluation of ovarian ganglia network development
and their structural relationship with folliculogenesis in the mice ovary. Golgi–Cox staining was performed in
the ovary for imaging of ganglia.
Results
Ganglia and ovarian structures in Golgi–Cox staining. In the present study, Golgi–Cox staining was
used for the first time to identify the ganglia network of mouse ovaries. Also, with the help of this method
of staining and serial cryo-sectioning technique and three-dimensional reconstruction of ovarian slices, the
parameters of gangliogenesis relationship with ovarian structures were compared. Briefly, in 2D images, the gan-
glia structures were stained black and the ovarian tissue was stained brown (Fig. 1). Conversely, in 3D images,
the ganglia structures were recolored red and the ovarian tissue color was changed to transparent for 3D recon-
struction (Fig. 2, Video S1).
In addition, the neural network was detectable in this color in black, but with continuous filament structures
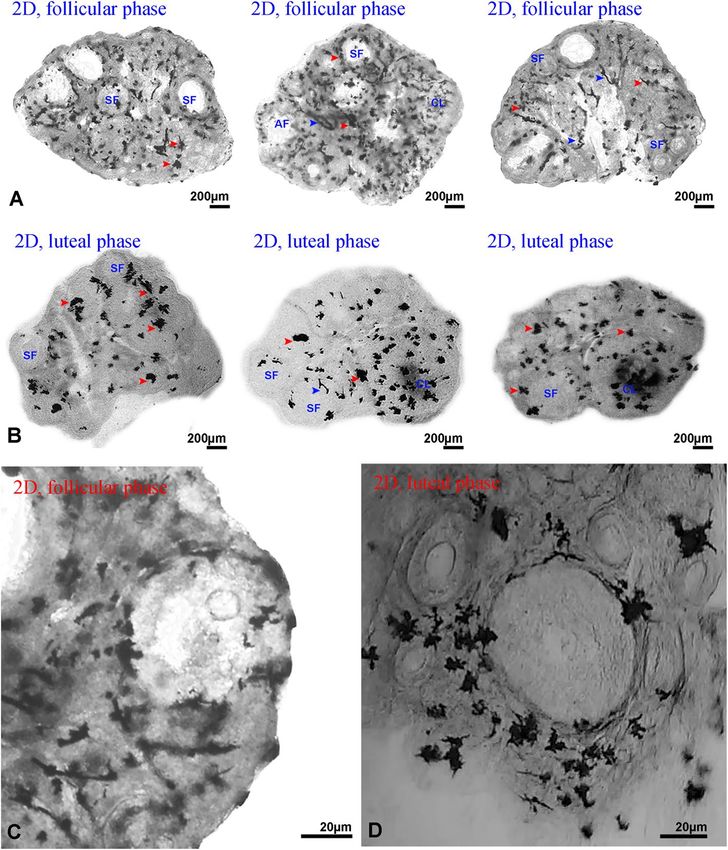
in 2D (Fig. 1A) and 3D images (Fig. 2A). The ganglia were also recognizable as a network of tree dendrites
from a cell body between the theca and granulosa cell layers around all types of follicles (Fig. 1B,C). In corpora
lutea, these ganglia were scattered throughout the corpus luteum structure (Fig. 1A). The size, the shape and the
number of branches were structurally different between ganglia but all of them were multipolar (Fig. 1B,C). The
ganglia of the follicular phase ovaries (Fig. 1A,B) and the luteal phase ovaries (Fig. 1C,D) were measured and
compared. The number of the ganglia at luteal phase ovary seems to be lower than the follicular phase ovary
(Fig. 1A,D).
After reconstruction of ovarian structures by 3D method, scattering of ganglia between follicles and corpus
luteum was observed (Fig. 2B). The segmentation of the ganglia after the segmentation of the follicular structures
made it possible to image the spatial relationship between both ganglia networks and reproductive structures
(Fig. 2C). The spot algorithm for measuring follicles and corpora lutea completely segmented the ovarian struc-
tures (Fig. 2B,D). The cell algorithm also segmented the network structures of the ganglia (Fig. 2C). Ganglia
and neurons were observed in all parts of the ovarian tissue. Nerve tissue density especially neural filaments was
higher in the medulla of ovaries than the cortex.
Follicular growth and increase of ganglia number. In the 2D study, the total number of ganglia
increased during follicular growth (p < 0.05; Fig. 3A,B). In contrast with luteal phase ovary, in follicular phase
ovary, the total number of ganglia in the antral follicles was higher than in the secondary follicles and atretic
antral follicles (p < 0.001 and p = 0.001, respectively; Fig. 3A,B). Investigating changes in the number of ganglia
relative to increasing follicle area in the 2D study, it was observed that the ratio of ganglia number to follicle
area in secondary follicles was higher than antral follicles and atretic antral follicles (p = 0.023 and p = 0.022,
respectively, Fig. 3C). However, the number of ganglia in secondary follicles in the follicular and luteal phases
was not significantly different (p > 0.05, Fig. 3D), but the number of ganglia in antral follicles in follicular phase
was higher than luteal phase (p = 0.03, Fig. 3E).
On the other hand, in the 3D study, the total number of ganglia increased during follicular growth, as well
as 2D study (p < 0.05; Fig. 3F). Indeed, the total number of ganglia in the antral follicles was higher than the sec-
ondary and atretic antral follicles in both luteal and follicular phase ovaries (p < 0.01 and p < 0.001, respectively;
Fig. 3F,G). Furthermore, the ratio of ganglia number to follicle area in the secondary follicles and the antral
follicles was not different, which was in contrast with the 2D study findings (p > 0.05; Fig. 3H). In addition, this
ratio in the antral follicles was higher than atretic follicles, unlike the 2D study analysis (p = 0.026; Fig. 3H).
Follicular growth and increase of ganglia area. In 2D study, the total area of ganglia increased during
follicular growth (p < 0.05; Fig. 4A,B). Total area of ganglia in the antral follicles was higher than the secondary
follicles in both luteal and follicular phase ovaries (p = 0.48 and p < 0.001, respectively; Fig. 4A,B). In addition,
Scientific Reports | (2021) 11:5547 | https://doi.org/10.1038/s41598-021-84835-0 2
Vol:.(1234567890)www.nature.com/scientificreports/
Figure 1. Mouse ovarian sections were stained with Golgi–Cox method. (A) Two-dimensional follicular phase
ovary. (C) Distribution of ganglia around follicular phase ovarian follicles. (D) Distribution of ganglia around
luteal phase ovarian follicles. The ganglia (red arrow head), and neural filaments (blue arrow head) are stained
black. Secondary follicles (SF), Antral follicles (AF) and corpus luteum (CL) are also seen (all images are gray
scale format).
the ratio of ganglia area to ganglia number between the antral follicles and the secondary follicles was not dif-
ferent (p > 0.05, Fig. 4C). However, the ratio of ganglia area to area of structures in the secondary follicles was
higher than the antral follicles (p > 0.05, Fig. 4D). In addition, the ratio of ganglia area to area of structures in
the secondary follicles was higher than the atretic antral follicles (p = 0.034, Fig. 4D). Furthermore, the area of
ganglia in the secondary follicles in luteal phase ovary was higher than the follicular phase ovary (p = 0.001,
Fig. 4E). Also, the area of ganglia in the antral follicles in luteal phase ovary was higher than the follicular phase
ovary (p = 0.006, Fig. 4F).
In the 2D study, there were positive correlations between increase in ganglia area and increase in ganglia
number; increase in ganglia area and increase in ovarian structures’ area; and increase in ganglia number and
increase in ovarian structures’ area (p = 0.0001, Table 1). In addition, in the secondary follicles, there were posi-
tive correlations between increase in ganglia area and increase in ganglia number; increase in ganglia area and
increase in secondary follicles’ area and increase in ganglia number and increase in secondary follicles’ area
(p = 0.0001, Table 1). Moreover, in the antral follicles and the atretic antral follicles, there was also positive cor-
relation between these three groups (p = 0.0001, Table 1).
In the 3D study of luteal phase ovaries, the total area of ganglia in antral the follicles was higher than the
secondary and atretic antral follicles (p < 0.01; Fig. 4G). On the other hand, in the 3D study of follicular phase
ovaries, the total area of ganglia increased during follicular development (p < 0.05; Fig. 4H). Area of ganglia in the
antral follicles was higher than the secondary follicles, as well as the 2D study (p < 0.001, Fig. 4H). In contrast with
the 2D study, the ratio of ganglia area to follicular area in the antral follicles was not different with the secondary
follicles (p > 0.05, Fig. 4I). Additionally, the ratio of ganglia area to follicular area in the antral follicles was higher
Scientific Reports | (2021) 11:5547 | https://doi.org/10.1038/s41598-021-84835-0 3
Vol.:(0123456789)www.nature.com/scientificreports/
Figure 2. Three-dimensional (3D) reconstruction and segmentation of mice ovary structures after Golgi–Cox
staining for detection of ovarian structures relationship with ganglia networks. (A) Whole tissue imaging and
3D reconstruction of mice ovary after Golgi–Cox staining (red color represent the ganglia); (B) ovarian follicles
and corpora lutea segmentations in the whole tissue 3D reconstructed ovary. The blue spots represent Antral
follicles, yellow spots represent secondary follicles, purple spots represent corpus luteum and brown spots
represent atretic antral follicles. (C) Ovarian follicles, corpora lutea and ganglia segmentations. Ganglia are
shown with white cells. (D) Ovarian follicles and corpora lutea segmentations. All scale bars in four images are
300 µm. All images are processed and drawn by Imaris software.
than the atretic antral follicles, which it was not seen in 2D study (p = 0.009, Fig. 4I). However, the ratio of ganglia
area to ganglia number in the atretic antral follicles was higher than the secondary follicles (p = 0.017, Fig. 4J).
In the 3D study, the same as the 2D study, there were positive correlations between increase in ganglia area
and increase in ganglia number; increase in ganglia area and increase in ovarian structures’ area; and increase
in ganglia number and increase in ovarian structures’ area (p = 0.0001, Table 2). In addition, in the secondary
follicles as well as the 2D study, there were positive correlations between increase in ganglia area and increase
in ganglia number; increase in ganglia area and increase in secondary follicles’ area; and increase in ganglia
number and increase in secondary follicles’ area (p < 0.05, Table 2). In contrast with the 2D study in the antral
follicles, there were no correlations between increase in ganglia area and increase in ganglia number; increase
in ganglia area and increase in antral follicles’ area; and increase in ganglia number and increase in antral fol-
licles’ area (p > 0.05, Table 2). In addition, in contrast with the 2D study in the atretic antral follicles there were
no correlations between increase in ganglia area and increase in ganglia number; increase in ganglia area and
increase in atretic antral follicles’ area; and increase in ganglia number and increase in atretic antral follicles’
area (p > 0.05, Table 2).
Corpus luteum development and increase of ganglia parameters. In the 2D study, the total area
and number of ganglia increased during corpus luteum development (Figs. 2A,B,3A,B). Specifically, the total
number of ganglia in the corpora lutea was higher than the antral, and secondary and atretic antral follicles in
luteal phase ovary (p < 0.001, p = 0.002 and p < 0.002, respectively Fig. 3A). Additionally, the total number of gan-
glia in the antral follicles was higher than the corpus luteum in follicular phase ovary (p = 0.036, Fig. 3B). In both
luteal and follicular phases, number of ganglia in corpora lutea was higher than the secondary follicles (p < 0.001
and p = 0.002, respectively; Fig. 3A,B).
In 2D study, the ratio of ganglia number to area of structures and also the ratio of ganglia area to ganglia
number in the corpora lutea and the antral follicles was not different (p > 0.05, Figs. 3C,4C). Also, the ratio of
ganglia area to area of structures in the corpora lutea was more than the atretic antral follicles (p = 0.025, Fig. 4D).
Moreover, number of ganglia in the corpora lutea in luteal and follicular phases was not different (p > 0.05,
Fig. 5A). In contrast, the area of ganglia in the corpora lutea in luteal phase ovary was higher than follicular
phase ovary (p = 0.01, Fig. 5B).
In the 2D analysis, there were positive correlations between area of ganglia and number of ganglia in the
corpora lutea (p = 0.003, Table 1). Also, positive correlations between area of ganglia and area of structure and
number of ganglia and area of structure in the corpora lutea were observed (p = 0.004 and p = 0.007, respectively;
Table 1).
Scientific Reports | (2021) 11:5547 | https://doi.org/10.1038/s41598-021-84835-0 4
Vol:.(1234567890)www.nature.com/scientificreports/
Figure 3. Comparisons of means and standard errors of variables in the three-dimensional (3D) and two-
dimensional (2D) studies show the relationship of follicular growth and increase in ganglia number in the
mouse ovary. Number of ganglia in luteal phase (A) and follicular phase (B) phases in follicles and corpora lutea
in the 2D study. (C) Number of ganglia to area of structures ratio in luteal phase in the 2D study. (D) Number
of ganglia in secondary follicles in follicular and luteal phase ovary in the 2D study. (E) Number of ganglia in
antral follicles in follicular and luteal phase ovaries in the 2D study. (F) Number of ganglia in follicles and corpus
luteum in the 3D study. (G) Number of ganglia to area of structures ratio in the 3D study (*p < 0.05, **p < 0.01,
***p < 0.001).
In 3D analysis of luteal phase ovaries, the total number of ganglia in the corpora lutea was higher than the
secondary and atretic antral follicles (p < 0.001, Fig. 3F). In addition, in the 3D study of follicular phase ovaries,
Scientific Reports | (2021) 11:5547 | https://doi.org/10.1038/s41598-021-84835-0 5
Vol.:(0123456789)www.nature.com/scientificreports/
Figure 4. Comparisons of means and standard errors of variables in the three-dimensional (3D) and two-
dimensional (2D) studies to show the relationship of follicular growth and increase in ganglia area in the mouse
ovary. Area of ganglia in luteal phase (A) and follicular phase (B) phases in follicles and corpora lutea in the 2D
study. (C) Area of ganglia to number of ganglia ratio in luteal phase in the 2D study. (D) Area of ganglia to area
of structures ratio in luteal phase in the 2D study. (E) Area of ganglia in the secondary follicles in follicular and
luteal phases in the 2D study. (F) Area of ganglia in the antral follicles in follicular and luteal phases in the 2D
study. (G) Area of ganglia in follicles and corpora lutea in the 3D study. (H) Area of ganglia to area of structures
ratio in the 3D study. (I) Area of ganglia to number of ganglia ratio in the 3D study (*p < 0.05, **p < 0.01,
***p < 0.001).
total number of ganglia in the antral follicles was higher than the corpora lutea in follicular phase (p = 0.001,
Fig. 3G) The number of ganglia in corpora lutea was higher than the secondary and the atretic antral follicles
in follicular phase ovary (p < 0.001 and p = 0.002, respectively, Fig. 3G), same as the 2D analysis of luteal phase
ovary. The 3D study results of luteal phase ovaries were almost similar to the 2D study. In the 3D analysis of
luteal phase ovaries, the total area of ganglia in the corpora lutea was higher than the secondary, antral and
atretic antral follicles (p < 0.001, p = 0.003 and p < 0.001, respectively; Fig. 4G). In both the 2D and 3D study of
follicular phase ovaries, total area of ganglia in the antral follicles was higher than the corpora lutea (p = 0.013
and p = 0.025, respectively, Fig. 4B,H) and higher than secondary follicle (p < 0.001, Fig. 4H). Moreover, the
total number and total area of ganglia in the corpora lutea were higher than the atretic antral follicles (p = 0.002
Scientific Reports | (2021) 11:5547 | https://doi.org/10.1038/s41598-021-84835-0 6
Vol:.(1234567890)www.nature.com/scientificreports/
Ganglia area-ganglia number Ganglia area-structure area Ganglia number-structure area
Structures Correlation coefficient p-value Correlation coefficient p-value Correlation coefficient p-value
Ovarian structures 0.971 0.0001 0.924 0.0001 0.925 0.0001
Secondary follicle 0.880 0.0001 0.920 0.0001 0.882 0.0001
Antral follicle 0.956 0.0001 0.904 0.0001 0.983 0.0001
Corpus luteum 0.955 0.003 0.950 0.004 0.932 0.007
Atretic antral follicle 0.993 0.0001 0.976 0.0001 0.993 0.0001
Table 1. Correlation coefficient of follicular area and ganglia development including ganglia number and area
in different follicular phases and corpus luteum in two-dimensional ovary analysis.
Ganglia area-ganglia number Ganglia area-structure area Ganglia number-structure area
Structures Correlation coefficient p-value Correlation coefficient p-value Correlation coefficient p-value
Ovarian structures 0.985 0.0001 0.978 0.0001 0.979 0.0001
Secondary follicle 0.966 0.008 0.948 0.014 0.878 0.05
Antral follicle 0.532 0.468 0.566 0.434 0.429 0.571
Corpus luteum 0.927 0.023 0.997 0.0001 0.918 0.028
Atretic antral follicle 0.540 0.460 0.667 0.333 0.857 0.143
Table 2. Correlation coefficient of follicular area and ganglia development including ganglia number and area
in different follicular phases and corpus luteum in three-dimensional ovary analysis.
Figure 5. Comparisons of means and standard errors of number of ganglia in the two-dimensional studies to
show the relationship of corpora lutea function and increase in ganglia number (A) and area (B) in the mouse
ovary.
and p < 0.001, respectively, Figs. 3F,4H). Furthermore, the ratio of ganglia area to ganglia number between the
corpora lutea and the antral follicles was not different (p > 0.05, Fig. 4J). In contrast, the ratio of ganglia area
to ganglia number in the corpora lutea was higher than the secondary follicles (p = 0.004, Fig. 4J). The area of
ganglia to area of structures ratio in the corpora lutea was higher than the secondary and the atretic antral fol-
licles (p = 0.006 and p = 0.001, Fig. 4I). In contrast, this ratio between the corpora lutea and the antral follicles
was not different (p > 0.05, Fig. 4I).
In the 3D analysis, there were positive correlations between area of ganglia and number of ganglia in the
corpora lutea (p = 0.02, Table 2), area of ganglia and area of structure (p < 0.001, Table 2) and number of ganglia
and area of structure (p = 0.02, Table 2).
Discussion
In the present study the gangliogenesis during folliculogenesis and their relationship was shown in both 2D and
3D evaluation of mice ovaries. We found that during folliculogenesis the area and number of ganglia in the fol-
licular wall increased. Also, the 3D study results revealed that although the number of ganglia did not increase
by development of the secondary follicles to the antral follicles, proportionally, considering the increase of
volume and area of follicles during folliculogenesis, the area of ganglia increased from the secondary follicles to
the antral follicles. As a result, proliferation and hypertrophy of ganglia were observed during folliculogenesis
in mice ovary. These phenomena were observed in both follicular and luteal phases. Besides, during follicu-
lar development, their function increased, too19. Therefore, due to their enhanced function, secretion activity
increased, subsequently19. Furthermore, in a 3D evaluation of mouse ovary it has been shown that angiogen-
esis happened during folliculogenesis20. On the other hand, previous studies have shown that there is some
Scientific Reports | (2021) 11:5547 | https://doi.org/10.1038/s41598-021-84835-0 7
Vol.:(0123456789)www.nature.com/scientificreports/
relationship between internal nervous network and vascular system in ovary functions and both of them take
part in ovarian secretion18,21–23. They indicated that vessels and nerves have an important role in folliculogenesis
and ovulation18,21–23. Consistent with our findings on the relationship between ovarian function and ganglio-
genesis, the same findings about other neuronal cells in mice10,24, monkeys and humans9,25 demonstrated that
ovarian internal neuronal filaments increased in sexual maturation. Furthermore, distribution, morphology,
and chemical phenotype of ovarian intrinsic nervous system in guinea pigs increase in adult animals compared
with neonates16. Comparing previous findings with our results, it can be speculated that follicular function has
a positive relationship with gangliogenesis, intrinsic neuronal network and vasculogenesis. Another result of
current study showed that the estrous ovary had higher number of ganglia of antral follicles than luteal phase
ovary, however, their area was higher in luteal phase than follicular phase ovary. These results suggest that during
follicular phase there is ganglia proliferation around the antral follicles. In addition, it is further conducted that
at the luteal phase the ganglia undergo hypertrophy and the area of the ganglia increase.
On the other hand, data of the current 3D study demonstrated that the number of ganglia to area of structures
ratio in the secondary and antral follicles and corpora lutea were not different. As the area of the follicles enlarges,
which indicates an increase in the number of granulosa and theca cells vascularization26, the number of ganglia
has increased to such an extent that the ratio of the ganglia number to the area of the follicles and corpora lutea
remains constant. This indicates a constant ovarian structure volume-dependent gangliogenesis. The number
of ganglia to area of structures ratio remains high during follicular development. Due to the increase in ovarian
follicular metabolism27 and in hormonal activity28, to ensure the interaction of ovarian structures and ganglia
remain constant, the area and volume of ganglia, as well as ganglia number increase.
During follicular development, some follicles undergoes a tresia29. The specific criteria for follicles undergo
atresia, which it called atretic follicles, is pyknotic n uclei30. However, other criteria for atretic follicles recognition
is follicular deformity and they don’t have rounded shape29. As the Golgi–Cox staining only stain the cells of
nervous system31, the pyknotic nuclei in granulosa cells around the follicles are not recognizable. In the present
study, the atretic antral follicles were distinguished by their shapes’ deformity and non-rounded shape from antral
follicles. Totally, in the follicular phase ovary, the total number and area of ganglia in atretic antral follicles were
lower than antral follicles in both 2D and 3D studies. The follicles in follicular phase became almost mature and
on the other hand the rest of the follicles undergo a tresia29. This showed that the as the atretic follicles undergoes
degeneration and their cells reduced, their ganglia also reduced in number and area. However, in the luteal phase
ovary, there was no significant difference between antral follicles and atretic antral follicles which it could be
because of the less maturation of antral follicles in luteal phase ovary29,32.
The corpora lutea has the highest value of ganglion area and number compared with the other ovarian struc-
tures in luteal phase. This result was observed at both 2D and 3D analysis of luteal phase ovaries. Along with
these results, the study of mice estrous cycle showed that progesterone secretion of the corpora lutea increased in
luteal phase33. In early luteal phase, area of luteal tissue and its function increased, which is known as luteogenesis
phase34. In addition, results from rat ovary showed that the corpora lutea formed at early luteal and progesterone
secretion started35. These results indicated that corpora lutea in luteal phase has a high function and produces
progesterone. In order to reach this function, corpora lutea needed more secretory cells. On the other hand,
ganglia of the corpora lutea decreased during its atretic degradation. As the ovary was in follicular phase, the
results showed that the antral follicle has higher value of ganglia’s area and number than the corpora lutea. Due
to lack of pregnancy, the corpora lutea begin degradation and at the follicular phase are no longer observed8,36.
Therefore, it can be resulted that during degradation of the corpora lutea, its ganglia undergo degradation too.
The 3D results confirmed our 2D findings and showed degradation of ganglia during degradation of the corpora
lutea. The results of previous studies demonstrated that the corpora lutea has higher vessels and a ngiogenesis37,
which shows its higher activity rather than the other ovarian structures. Due to the fact that the nervous system
of ovary has a role in regulation of mammalian ovary function, steroidogenesis and ovulation38 and ganglia may
have roles in progesterone secretion, also, the higher number of ganglia in corpora lutea at luteal phase was seen
in comparison with regressing corpora lutea in the follicular phase.
To the best of our knowledge, this is the first time that 3D morphological parameters of ganglia in the ovar-
ian follicles and the corpora lutea of mice were determined. In contrast with the 2D study, in the 3D study, the
number of ganglia to area of structures ratio in the secondary and the antral follicles was not different. This find-
ing showed that during follicular growth, due to preserving the function of follicles, this ratio always remained
constant, which cannot be seen by the limitations of the 2D analysis. In some other findings of our study, the
results of the 2D study were different from the 3D study and the 2D analysis could not give us a proper aspect of
the view of reality compared to the 3D analysis. In line with our findings, even results of the 2D and 3D ultra-
sound techniques in ovary showed that the 2D analysis could not detect all data of ovarian structures and the
3D analysis was realistic39. In addition, in a histomorphological evaluation of rodents’ brain, the 3D analysis was
more accurate in analyzing all parts of brain rather than the 2D analysis.
In the present study, although the cost of immunohistochemistry method for whole tissue imaging of neuronal
networks of brain40 and different organs makes this approach unconventional, Golgi–Cox method was performed
for nervous tissue labeling and 3D imaging. Golgi staining is one of the oldest staining methods for nervous
system imaging and was developed by Camillo Golgi at 187341. This method has been shown to be effective due
to neuronal morphology imaging such as dendritic and axonal arborization and spines detection42. There are
three methods of Golgi staining: Golgi–Cox, Rapid Golgi and Golgi–Kopsch43,44. While all of these methods
have some different advantages and disadvantages, Golgi–Cox method is better than the others for dendritic
trees analysis due to less background d ensity44. In this method neurons, especially dendritic trees stain clearly
44
without noise . Four types of ganglia exist in ovary of young and postnatal adult rats, including mesovarial,
Hilar, medullary, and cortical ganglia24. In the present study, Golgi–Cox method based on the previous study
“Golgi–Cox staining step by step”45 with slight modification was performed.
Scientific Reports | (2021) 11:5547 | https://doi.org/10.1038/s41598-021-84835-0 8
Vol:.(1234567890)www.nature.com/scientificreports/
In conclusion, the present study demonstrates the positive relationship of gangliogenesis during folliculo-
genesis in mouse ovary. Furthermore, gangliogenesis has been shown in corpus luteum development. Ovarian
ganglia as an independent part of ovarian nervous system is likely to have an important role in folliculogenesis
and luteogenesis. Furthermore, 3D analysis instead of conventional 2D approach, in addition to Golgi–Cox
staining of ovary can be used for study of this physiological phenomena in ovary.
Methods
Animals. The ovaries of 12 non-pregnant adult BALB/c mice were used in the present experimental study.
The mice weighed 35 ± 2 g and were 49 days old. Mice had free access to food and water and were kept in labo-
ratory cages in standard conditions at 22 °C and 12 h light/dark cycle. Complete ovarian sample was used for
imaging and statistical analysis.
Briefly, after the mice were anesthetized, 0.9% NaCl solution was perfused in left ventricle of the mouse hearts.
Then the ovaries were removed from the mice, and the pattern of nervous system distribution with intra-ovarian
origin and their relation to folliculogenesis was determined by cross-sectional imaging and image analysis of the
ovarian tissues. According to the protocol, the initial experiments were performed so as to repeat the different
times of the samples in Golgi–Cox solution, showing the stability of this staining and the most appropriate result.
Estrous cycle evaluation. The vaginal smear test was performed to detect estrous cycle. Using 100 µl of
physiological salt solution, aspiration of vaginal canal was done. Aspiration was considered about 4 times on
each mouse. The contents of the sampler’s head were then drained onto the slide and coated with cover slips.
Finally, based on previous study5,46, using light microscopy estrous cycle phases for mouse was determined.
Briefly, predominant cornified squamous epithelial cells observation indicated follicular phase. However, at
luteal phase, the cornified squamous epithelial cells was not (or rarely) observed. At luteal phase, the most pre-
dominant cells were leukocytes.
Cardiac perfusion and ovary collection. The mice were anesthetized by chloroform-impregnated cot-
ton. Then dissecting the heart, the right atrium was cut and 0.9% saline solution was injected into the left ven-
tricle. The saline solution slowly entered the circulatory tract. The perfusion was then performed with a syringe
containing 10 mL of 4% formalin until the tissues became pale. After this, the ovaries were removed.
Golgi–Cox staining. Staining was done by a modified Golgi–Cox technique as described by Zaqout et al.45.
This modified method includes three main solutions.
Solution A: 5% (w/v) solution of potassium dichromate ( K2Cr2O7; UNI-CHEM, Serbia).
Solution B: 5% (w/v) solution of mercuric chloride ( HgCl2; UNI-CHEM, Serbia).
Solution C: 5% (w/v) solution of potassium chromate (K2CrO4; UNI-CHEM, Serbia).
All three solutions were kept in glass bottles at room temperature in the dark. In this condition, these solutions
can be used for a long time. For preparation of impregnation solution 25 mL of solution A was slowly mixed with
25 mL of solution B. 20 mL of solution C was carefully added to previous mixture. In the final step, 50 mL of
dd-H2O was added to the mixture of all three solutions. Final solution was covered with aluminum foil and was
kept at room temperature in completely dark condition for 48 h. After that, the reddish-yellow precipitation was
formed. The supernatant solution was gently collected by glass pipet (avoiding the reddish-yellow precipitant in
supernatant collection). The ovary tissue was transferred into glass bottle containing Golgi–Cox solution. After
24 h, the tissue was transferred into fresh Golgi–Cox solution. The glass bottle was kept in the dark at room
temperature for 14 days.
Ovary cryo‑sectioning. Firstly, cryoprotectant solution was prepared. For cryoprotectant preparation,
30 g of sucrose was dissolved in 100 mL d dH2O (30% sucrose solution). After tissue impregnation in Golgi–Cox
solution, tissues were transferred in cryoprotectant solution. The samples were kept in this solution at 4 °C in
dark for 24 h. After that, cryoprotectant solution was refreshed and the samples were kept in new solution in
the same conditions for 5 days. Then samples were washed with ddH2O and fixed on cryo-holder by cryo-glue.
Finally, the samples were transversely sectioned on a cryo-holder at a temperature of − 25 °C and a thickness of
30 μm. The serial sections were transferred onto gelatin coated slides for developing stage on staining.
Developing step of Golgi–Cox staining. The developing step of Golgi–Cox staining was performed. In
detail, slides were kept in d
dH2O twice for 2 min each time. For dehydration of sections, slides were placed in
50% ethanol for 5 min. After that, sections were transferred into ammonia solution (3:1 ammonia to d dH2O)
for 6 min. Then slides were placed in ddH2O twice, each for 2 min. At the next step, samples were kept in 5%
sodium thiosulfate solution for 10 min in dark condition. After repeating the d dH2O step twice (1 min each),
samples were dehydrated with ascending percentage of ethanol (70%, 95%, and 100% ethanol each for 5 min).
After dehydration step, tissues were placed in xylol for 10–15 min until tissues were completely cleared. In the
final step, slides were mounted by Entellan glue. Sections were kept in the dark until imaging.
Ovarian tissue imaging. An optical microscope (Nikon, E200, Japan) with a 40 × magnification and a
Dino Capture camera (AnMo Electronics Corporation, New Taipei City, Taiwan) were used. Whole ovarian
serial sections images were captured for each ovary. The images were provided in 2600 × 1950 pixels with TIFF
Scientific Reports | (2021) 11:5547 | https://doi.org/10.1038/s41598-021-84835-0 9
Vol.:(0123456789)www.nature.com/scientificreports/
format. The numbers and area of follicles, corpus lutea, ganglia and neuronal filaments were calculated. The
criteria for assortment of follicles and corpus luteum in 2D analysis was described in Azarnia et al.47 and for 3D
analysis it was described in Feng et al.48. In addition, the assortment of the atretic antral follicles were d
escribed29.
2D analysis of ovarian follicular and neuronal structures. ImageJ software used for 2D image
analysis of ovarian structures. Firstly, imported images converted to 8-bit images using “Image type” option in
“Image” panel. Then scale of all images was set using “Set scale” option in “Analyze” panel. In order to analyze
single follicle, the area of each follicle containing its surrounded ganglia and a few neuronal filaments was manu-
ally cropped. For this purpose, the border of each follicle with its ganglia were selected by “Oval” tool in main
menu of ImageJ software (Figure S1A). After that, the selected area was duplicated and analysis was continued.
The specified structures (ganglia and neural filaments) were measured by “threshold” algorithm. The size of
threshold field was adjusted by dragging the threshold border, manually. By adjusting the signal threshold in the
software, the shape of the ganglia and the neuronal filaments around the follicles were detected. Using “Analyze
particles” in analyze panel, the number and area of particles were measured (Figure S1B). In this stage, filaments
in a few crops were deleted manually using “delete” option in “ROI manager”. Finally, data were measured by
measure option in ROI manager and data were saved as an excel file with CSV format (Figure S2A).
3D analysis of follicular and neuronal structures. First, using ImageJ software, serial images were
combined as a TIFF series image using “Images to Stack” tool. The TIFF series image was saved as stack with
TIFF format. Then, using Imaris software (V 7.4.2, ImarisX64, Bitplane AG), 3D reconstruction was performed.
Specifically, after serial TIFF image was imported, the dimension of image was corrected in z-stack according to
thickness of tissue slices using “Image properties” in “Edit” panel. Firstly, the whole image was reconstructed. In
order to reconstruct follicles and corpora lutea, “Spot” algorithm was used in “Surpass” panel. This procedure
was done manually in order to cover follicle area and diameter. Three “Spot” algorithms were used for three
different ovarian structures: secondary follicles, antral follicles and corpora lutea. Then, the whole nervous net-
work was reconstructed by “Cell” algorithm in “Surpass” panel. The data of each algorithm was extracted from
“Statistics” in “Preferences” in “Edit” panel. In order to delete the data of neuron filaments, the biggest ganglion
in whole image was isolated by “Crop 3D” in “Edit” panel and the area of this ganglia was examined by “Cell”
algorithm. The areas higher than area of biggest ganglia were deleted, as well as their counts. The number and
total area of neuronal filaments were calculated by subtracting the total number and area of whole image from
the number and area of ganglia. For follicle and corpus luteum analysis, each follicle and its surrounding gan-
glia were isolated by “Crop 3D” in “Edit” panel. “Cell” algorithm was used for ganglia reconstruction in crops.
Only two neuronal filaments were detected in these crop 3Ds and their data were manually deleted. The data
of area and number of ganglia from each crop were extracted from “Statistics” in “Preferences” in “Edit” panel
(Figure S2B).
Data analysis. After data extraction from ImageJ and Imaris software, the data of area and number of struc-
tures (ganglia and neuronal filaments) obtained from image analysis were entered into Excel software. IBM SPSS
Statistics 26 (SPSS for Windows, version 26, SPSS Inc., Chicago, Illinois, USA) software was used for statistical
analysis. The mean differences between follicular groups were analyzed by one-way ANOVA and post hoc Tukey
test. The correlation of the total ganglia area and number and the area of structures (follicles and corpora lutea)
with each other in four different groups including total ovarian structures, secondary and antral follicles and
corpora lutea were analyzed by Pearson correlation. All data were expressed as the mean ± standard error of the
mean, and p value was considered less than 0.05 for statistical significance. GraphPad Prism (v7.0a, GraphPad
Software, Inc., San Diego, CA, USA) software was used for drawing the graphs. The table format was “Grouped”
and the data input was the mean of area and number of ganglia and standard error of the mean.
Statement of ethics. All experimental protocols were approved by the Shiraz University Ethics Commit-
tee (project number: 97gcu4m148075). All methods were carried out in accordance with the World Medical
Association Declaration of Helsinki. This study was carried out in compliance with the ARRIVE guidelines
(http://www.nc3rs.org.uk/page.asp?id=1357). Efforts were made to minimize animal suffering and to reduce the
number of animals used.
Received: 24 November 2020; Accepted: 19 February 2021
References
1. McGee, E. A. & Hsueh, A. J. Initial and cyclic recruitment of ovarian follicles. Endocr. Rev. 21, 200–214 (2000).
2. Rimon-Dahari, N., Yerushalmi-Heinemann, L., Alyagor, L. & Dekel, N. in Molecular mechanisms of cell differentiation in gonad
development 167–190 (Springer, 2016).
3. Richards, J. S. Maturation of ovarian follicles: Actions and interactions of pituitary and ovarian hormones on follicular cell dif-
ferentiation. Physiol. Rev. 60, 51–89 (1980).
4. Hsueh, A. J., Kawamura, K., Cheng, Y. & Fauser, B. C. Intraovarian control of early folliculogenesis. Endocr. Rev. 36, 1–24 (2015).
5. Fuentes, N., Cabello, N., Nicoleau, M., Chroneos, Z. C. & Silveyra, P. Modulation of the lung inflammatory response to ozone by
the estrous cycle. Physiol. Rep. 7, e14026 (2019).
6. Bradbury, J. T., Braun, W. & Gray, L. A. Maintenance of the corpus luteum and physiologic actions of progesterone. Recent Progress
in Hormone Research 151–196 (Academic Press, 2013).
Scientific Reports | (2021) 11:5547 | https://doi.org/10.1038/s41598-021-84835-0 10
Vol:.(1234567890)www.nature.com/scientificreports/
7. Carr, B. R., MacDonald, P. C. & Simpson, E. R. The role of lipoproteins in the regulation of progesterone secretion by the human
corpus luteum. Fertil. Steril. 38, 303–311 (1982).
8. Bachelot, A. & Binart, N. Corpus luteum development: Lessons from genetic models in mice. Curr. Top. Dev. Biol. 68, 49–84 (2005).
9. Anesetti, G., Lombide, P., D’Albora, H. & Ojeda, S. R. Intrinsic neurons in the human ovary. Cell Tissue Res. 306, 231–237 (2001).
10. D’Albora, H., Lombide, P. & Ojeda, S. R. Intrinsic neurons in the rat ovary: An immunohistochemical study. Cell Tissue Res. 300,
47–56 (2000).
11. Dees, W. L. et al. Origin and ontogeny of mammalian ovarian neurons. Endocrinology 147, 3789–3796 (2006).
12. Ricu, M., Paredes, A., Greiner, M., Ojeda, S. R. & Lara, H. E. Functional development of the ovarian noradrenergic innervation.
Endocrinology 149, 50–56 (2007).
13. Fernandois, D., Lara, H. & Paredes, A. Blocking of β-adrenergic receptors during the subfertile period inhibits spontaneous ovarian
cyst formation in rats. Horm. Metab. Res. 44, 682–687 (2012).
14. Flores, A. et al. Acute effects of unilateral sectioning the superior ovarian nerve of rats with unilateral ovariectomy on ovarian
hormones (progesterone, testosterone and estradiol) levels vary during the estrous cycle. Reprod. Biol. Endocrinol. 9, 34 (2011).
15. Morales-Ledesma, L. et al. Effects on steroid hormones secretion resulting from the acute stimulation of sectioning the superior
ovarian nerve to pre-pubertal rats. Reprod. Biol. Endocrinol. 10, 1–7 (2012).
16. Luna, F. et al. Morphology and chemical phenotype of the ovarian intrinsic neurons in neonate and sexually mature reproductive
guinea pig. Adv. Reprod. Sci. 3, 13 (2015).
17. Spears, N. et al. The role of neurotrophin receptors in female germ-cell survival in mouse and human. Development 130, 5481–5491
(2003).
18. Uchida, S. Sympathetic regulation of estradiol secretion from the ovary. Auton. Neurosci. 187, 27–35 (2015).
19. Lunenfeld, B., Kraiem, Z. & Eshkol, A. The function of the growing follicle. Reproduction 45, 567–574 (1975).
20. Hu, W., Tamadon, A., Hsueh, A. J. & Feng, Y. Three-dimensional reconstruction of the vascular architecture of the passive CLAR-
ITY-cleared mouse ovary. J. Vis. Exp., e56141 (2017).
21. Goede, V., Schmidt, T., Kimmina, S., Kozian, D. & Augustin, H. G. Analysis of blood vessel maturation processes during cyclic
ovarian angiogenesis. Lab. Investig. 78, 1385–1394 (1998).
22. Lawrence, I. E. Jr. & Burden, H. W. The origin of the extrinsic adrenergic innervation to the rat ovary. Anat. Rec. 196, 51–59 (1980).
23. Acuado, L. I. & Ojeda, S. R. Ovarian adrenergic nerves play a role in maintaining preovulatory steroid secretion. Endocrinology
114, 1944–1946 (1984).
24. D’Albora, H. & Barcia, J. J. Intrinsic neuronal cell bodies in the rat ovary. Neurosci. Lett. 205, 65–67 (1996).
25. D’Albora, H., Anesetti, G., Lombide, P., Dees, W. L. & Ojeda, S. R. Intrinsic neurons in the mammalian ovary. Microsc. Res. Tech.
59, 484–489 (2002).
26. Gougeon, A. Regulation of ovarian follicular development in primates: Facts and hypotheses. Endocr. Rev. 17, 121–155 (1996).
27. Channing, C., Schaerf, F., Anderson, L. & Tsafriri, A. Ovarian follicular and luteal physiology. Int. Rev. Physiol. 22, 117 (1980).
28. Wood, G. A., Fata, J. E., Watson, K. L. & Khokha, R. Circulating hormones and estrous stage predict cellular and stromal remodeling
in murine uterus. Reproduction 133, 1035–1044 (2007).
29. Uslu, B. et al. Quantifying growing versus non-growing ovarian follicles in the mouse. J. Ovarian Res. 10, 1–11 (2017).
30. Sharma, A. K. & Sharma, R. Effect of prostaglandins E2 and F2α on granulosa cell apoptosis in goat ovarian follicles. Iran. J. Vet.
Res. 21, 97 (2020).
31. Pasternak, J. F. & Woolsey, T. A. On the “selectivity” of the Golgi–Cox method. J. Comp. Neurol. 160, 307–312 (1975).
32. Cheng, L. et al. Adiponectin deficiency leads to female subfertility and ovarian dysfunctions in mice. Endocrinology 157, 4875–4887
(2016).
33. Donner, N. C. & Lowry, C. A. Sex differences in anxiety and emotional behavior. Pflügers Arch. Eur. J. Physiol. 465, 601–626 (2013).
34. Siqueira, L. G. B. et al. Interrelationships among morphology, echotexture, and function of the bovine corpus luteum during the
estrous cycle. Anim. Reprod. Sci. 115, 18–28 (2009).
35. Mcdonald, D. M., Seiki, K., Prizant, M. & Goldfien, A. Ovarian secretion of progesterone in relation to the Golgi apparatus in
lutein cells during the estrous cycle of the rat. Endocrinology 85, 236–243 (1969).
36. Sartori, R., Haughian, J., Shaver, R., Rosa, G. & Wiltbank, M. Comparison of ovarian function and circulating steroids in estrous
cycles of Holstein heifers and lactating cows. J. Dairy Sci. 87, 905–920 (2004).
37. Feng, Y. et al. CLARITY reveals dynamics of ovarian follicular architecture and vasculature in three-dimensions. Sci. Rep. 7, 44810
(2017).
38. Lara, H. et al. Functional recovery of the developing rat ovary after transplantation: Contribution of the extrinsic innervation.
Endocrinology 129, 1849–1860 (1991).
39. Deb, S., Campbell, B., Clewes, J. & Raine-Fenning, N. Quantitative analysis of antral follicle number and size: A comparison of
two-dimensional and automated three-dimensional ultrasound techniques. Ultrasound Obstet. Gynecol. 35, 354–360 (2010).
40. Vandenberghe, M. E. et al. High-throughput 3D whole-brain quantitative histopathology in rodents. Sci. Rep. 6, 20958 (2016).
41. Golgi, C. Sulla sostanza grigia del cervello. Gazetta Med. Ital. 33, 244–246 (1873).
42. Patro, N., Kumar, K. & Patro, I. Quick Golgi method: Modified for high clarity and better neuronal anatomy. Indian J. Exp. Biol.
51, 685–693 (2013).
43. Bayram-Weston, Z., Olsen, E., Harrison, D. J., Dunnett, S. B. & Brooks, S. P. Optimising Golgi–Cox staining for use with perfusion-
fixed brain tissue validated in the zQ175 mouse model of Huntington’s disease. J. Neurosci. Methods 265, 81–88 (2016).
44. Kang, H. W., Kim, H. K., Moon, B. H., Lee, S. J. & Lee, S. J. Comprehensive review of Golgi staining methods for nervous tissue.
Appl. Microsc. 47, 63–69 (2017).
45. Zaqout, S. & Kaindl, A. M. Golgi–Cox staining step by step. Fron. Neuroanat. https://doi.org/10.3389/fnana.2016.00038 (2016).
46. McLean, A. C., Valenzuela, N., Fai, S. & Bennett, S. A. Performing vaginal lavage, crystal violet staining, and vaginal cytological
evaluation for mouse estrous cycle staging identification. J. Vis. Exp. 67, 4389 (2012).
47. Azarnia, M., Koochesfahani, H., Rajabi, M., Tahamtani, Y. & Tamadon, A. Histological examination of endosulfan effects on fol-
licular development of BALB/C mice. Bulg. J. Vet. Med. 12, 33–41 (2008).
48. Feng, Y. et al. CLARITY reveals dynamics of ovarian follicular architecture and vasculature in three-dimensions. Sci. Rep. 7, 1–13
(2017).
Author contributions
M.E.A.Z., A.A., F.R., F.M.R., M.B. and A.K.: data collection, and manuscript writing. A.T., H.B., and M.R.J.S.:
idea conception and study design. M.D., A.A., and A.T., statistical analysis. A.T., H.B., and M.R.J.S: review and
proof-reading. All authors approved of the final version.
Funding
This study was financially supported by the Shiraz University (Grant number: 97gcu4m148075).
Scientific Reports | (2021) 11:5547 | https://doi.org/10.1038/s41598-021-84835-0 11
Vol.:(0123456789)www.nature.com/scientificreports/
Competing interests
The authors declare no competing interests.
Additional information
Supplementary Information The online version contains supplementary material available at https://doi.
org/10.1038/s41598-021-84835-0.
Correspondence and requests for materials should be addressed to M.R.J.S. or A.T.
Reprints and permissions information is available at www.nature.com/reprints.
Publisher’s note Springer Nature remains neutral with regard to jurisdictional claims in published maps and
institutional affiliations.
Open Access This article is licensed under a Creative Commons Attribution 4.0 International
License, which permits use, sharing, adaptation, distribution and reproduction in any medium or
format, as long as you give appropriate credit to the original author(s) and the source, provide a link to the
Creative Commons licence, and indicate if changes were made. The images or other third party material in this
article are included in the article’s Creative Commons licence, unless indicated otherwise in a credit line to the
material. If material is not included in the article’s Creative Commons licence and your intended use is not
permitted by statutory regulation or exceeds the permitted use, you will need to obtain permission directly from
the copyright holder. To view a copy of this licence, visit http://creativecommons.org/licenses/by/4.0/.
© The Author(s) 2021
Scientific Reports | (2021) 11:5547 | https://doi.org/10.1038/s41598-021-84835-0 12
Vol:.(1234567890)You can also read