White Paper on International Economy and Trade 2018 Outline - July 10, 2018 Trade Policy Bureau, Ministry of Economy, Trade and Industry

Page created by Gloria Hubbard
 
CONTINUE READING
White Paper on International Economy and Trade 2018 Outline - July 10, 2018 Trade Policy Bureau, Ministry of Economy, Trade and Industry
White Paper on International
 Economy and Trade 2018
         [Outline]

              July 10, 2018
          Trade Policy Bureau,
Ministry of Economy, Trade and Industry
Table of Contents
Part 1 Global economy
 Chapter 1 Recent trends in the global economy and Japan’s external trade and
           investment
 Chapter 2 Economic trends and external economic policies in major
           countries/regions

Part 2 Analysis: Significant shift in the global economy
 Chapter 1 Expanding digital trade
 Chapter 2 Rise of emerging and developing economies
  Section 1 Changes in the roles of emerging and developing countries in the global economy

  Section 2 Response to global excess production capacity

 Chapter 3 Rapid change in the Chinese economy
  Section 1 Macroeconomic trends

  Section 2 Advance of new industries

  Section 3 External trade and investment

  Section 4 Business opportunities for Japanese companies

Part 3 Policies
 Chapter 1 Development of free, fair and high-level trade rules
  Section 1 Progress in mega-FTAs (TPP11, Japan-EU EPA, RCEP, etc.)

  Section 2 Investment-related treaties

  Section 3 Japan-U.S. economic relations

  Section 4 WTO

  Section 5 G7/G20 and OECD

  Section 6 APEC

 Chapter 2 Emerging country strategy (China, ASEAN/Asia-Pacific, India, Russia,
          the Middle East, and Africa)
 Chapter 3 Comprehensive trade policy
  Section 1 Promotion of utilization of economic partnership agreements

  Section 2 Consortium for New Export Nation

  Section 3 Food exports                                                                  1
Expanding digital trade                                                                          Part 2 Chapter 1 Expanding digital trade

    The scale of the global cross-border e-commerce (EC) market is expected to grow in
     value from 236.0 billion dollars in 2014 to 994.0 billion dollars in 2020.
    The number of cross-border EC users is expected to rise from around 300 million
     people to more than 900 million people over the same period.
    The domestic business-to-commerce (B2C) EC market is also expanding. In 2016,
     China was already the global No. 1 in terms of both the scale of the internet retail sales
     market (with a value of 939.4 billion dollars) and EC ratio (19%) .

                       Scale of the global cross-border EC market
 (1 billion           Others                                                                (100 million
                      North America                                                             people)
                      Western Europe                                                        9.4            The scale of the global cross-border
1,200                 Asia-Pacific                                                                   10
                                                                                                           EC market, which was 236.0 billion
                                                                8.5
                      Number of cross-border EC users (right axis)                                   9
                                                                                            994            dollars in 2014, has continued
1,000                                                7.5                                                   expanding since then and is
                                                                                                     8
                                                                               826                         expected to reach 994.0 billion
                                                                                                     7
 800                       Estimate                  5.8                                                   dollars in 2020.
                                                                   6…                                6
 600                                    4.5                                                          5     The number of cross-border EC
                                                     530
                           3.6                                                                             users, which was around 300
              3.1                                                                                    4
                                        401                                                                million people in 2014, is expected
 400
                           308                                                                       3     to approximately triple to 900
              236                                                                                          million people in 2020.
                                                                                                     2
 200
                                                                                                     1
    0                                                                                                0
              2014        2015         2016         2017         2018         2019         2020
   Remarks: Estimated figures
   Source: Accenture and Alibaba Research (2015).
               EC ratio, growth rate, and value of B2C EC market
                      by country (unit: 100 million dollars)

                                                                                                           The scale of the global B2C EC
                                                                                                           market in 2016 expanded 122% in
                                                                                                           value from the previous year to
                                                                                                           around 2.4 trillion dollars.

                                                                                                           By region, China is the largest EC
                                                                                                           market, accounting for around 40%
                                                                                                           of the global market value.

                                                                                                           The growth rate for China is higher
                                                                                                           than the rate for the United States,
                                                                                                           the second-largest market, so China
                                                                                                           is expected to continue to lead the
                                                                                                           global EC market.

 Remarks: The size of the circle corresponds to the scale of the EC market. The figures above
                                                                                                           China is also the global leader in
 are for 2016. However, the market scale and the EC ratio in the Middle East/Africa region are             terms of EC ratio (19%).
 figures for 2014 and the annual average growth rate in the region is a figure for 2014-2025.
 Source: Prepared on the basis of interviews with eMaketer and Transcosmos                                                                        2
Part 2 Chapter 1 Expanding digital trade
Advance of IT platform providers
      While companies in such sectors as energy, banking and telecommunications
       dominated the top rankings of companies in terms of market capitalization 10
       years ago, IT platform providers have advanced in the rankings. Six of the top
       ten companies are now IT platform providers.

Global rankings of companies in terms of market capitalization
                                     2008
                                                                               In line with the expansion of digital trade,
                                                                    Market
                                                                   capitaliz   global companies providing IT platforms
       #         Company name         Country        Sector        ation (1    for EC and cloud computing services are
                                                                    million
                                                                   dollars)    increasing their presence.
            China National Petroleum
        1                            China       Oil/gas           723,998
            Corporation

        2 Exxon Mobil Corporation     U.S.       Oil/gas           511,887     A decade ago, in 2008,
                                                                               telecommunications companies, as well
            General Electric                     Industrial
        3                             U.S.                         374,637     as banks, and oil and gas companies, led
            Company                              conglomerates

                                                 Wireless
                                                                               the rankings, as businesses providing
                                      Hong
        4 China Mobile
                                      Kong
                                                 communication     354,245     telecommunication infrastructure tended
                                                 service
          Industrial and                                                       to be highly valued in terms of market
        5 Commercial Bank of          China      Banking           339,004     capitalization against the backdrop of a
          China Limited
        6 Microsoft Corporation       U.S.       Software          333,054     marked rise in the diffusion rate of
        7 Gazprom                     Russia   Oil/gas             331,964     mobile phones. However, in recent years,
                                      Netherla
        8 Royal Dutch Shell plc
                                      nds
                                               Oil/gas             264,764     online services provided through
                                               Wireless                        information and communication
        9 AT&T Inc.                   U.S.     communication       252,051
                                                                               networks have risen in prominence.
                                               service

            China Petroleum and
      10                              China      Oil/gas           249,659
            Chemical Corporation

                                     2018
                                                                               In the global top 10 rankings in terms of
                                                               Market          market capitalization as of January 2018,
                                                            capitalization     Apple was No. 1, followed by other U.S.
        #     Company name         Country      Sector
                                                              (1 million
                                                               dollars)
                                                                               and Chinese IT platform companies, such
                                              Compute                          as Alphabet (Google), Amazon,
        1 Apple Inc.               U.S.       r                   825,593
                                              hardware                         Facebook, Tencent, and Alibaba.
                                              Online
        2 Alphabet Inc.            U.S.                           731,933
                                              services
            Microsoft
        3                          U.S.       Software            686,283
            Corporation
                                              Departm
        4 Amazon.com, Inc. U.S.               ent                 671,084
                                              stores

                                              Online
        5 Facebook, Inc.           U.S.                           512,471
                                              services

                                              Online
        6 Tencent                  China                          497,697
                                              services
          Berkshire                           Casualty
        7                          U.S.                           491,154
          Hathaway Inc.                       insurance
          Alibaba Group                       Online
        8                          China                          454,451
          Holding Limited                     services
            JPMorgan Chase &
        9                    U.S.             Banking             387,707
            Co.
          Industrial and
       10 Commercial Bank          China      Banking             354,750
          of China Limited

 Remarks: The above figures are as of February 12, 2008 and January 1, 2018
 Source: Thomson Reuters                                                                                                      3
Challenges for digital trade                                                                                    Part 2 Chapter 1 Expanding digital trade

 Data protectionist moves are increasing, including data localization regulation,
  requirement for the adoption of mandatory security standards, and requirement for
  source code disclosure that impedes free cross-border data flow.
 If new regulations related to data are introduced, the GDP of that country is expected
  to be negatively impacted.
 Other challenges include how to secure an environment of fair competition between
  IT platform providers and existing industries and how to ensure the protection and
  safety of consumers.

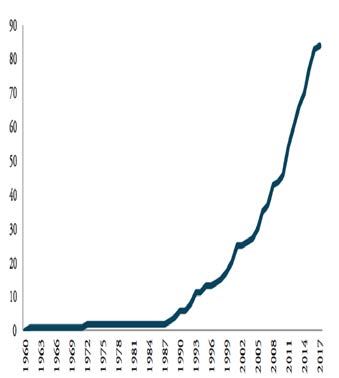
      Changes in the number of                             Number of regulations related to
  regulations related to cross-border                           cross-border data flow
      data flow (1960 to 2017)                             (by region/country) (as of 2017)                         The promotion of the free flow of
                                                                                                                    information is developing a
                                                                                    Number of
                                                                                    regulations
                                                                                                        Share       favorable cycle that is creating new
                                                        Europe                                    37      42.5%     technical innovations and business
                                                         Germany                                  5        5.7%     models and is improving the quality
                                                         Russia                                   5        5.7%     of people’s lives.
                                                        Asia-Pacific                              33      37.9%
                                                         China                                    9       10.3%     On the other hand, digital
                                                        Middle East/Africa                        7        8.0%     protectionist moves are also
                                                        North America                             6        6.9%
                                                                                                                    emerging,      including      imposing
                                                         Canada                                   5        5.7%
                                                                                                                    restrictions on the free flow of
                                                         U.S.                                     1        1.1%     cross-border       data     and    the
                                                        Central and South                                           installation locations of servers.
                                                                                                  4        4.6%
                                                        America
                                                        Total                                     87     100.0%     National regulations related to
                                                        Remarks: The number of regulations which were in            cross-border data flow have
Remarks: The years represents the timings of            force in 2017. The countries indicated above (except
entry-into-force and revision of regulations.
                                                        for the United States) had more than five regulations.
                                                                                                                    increased rapidly over the past 20
Based on a survey by ECIPE.
Source: ECIPE and Digital Trade Estimates               Source: ECIPE and Digital Trade Estimates                   years.

              Impact on GDP from introducing data usage regulations
        (%)
    0
 -0.2
 -0.4                                                                                                               If a country introduces cross-
 -0.6                                                                                                               sectoral data localization regulation,
 -0.8                                                               -0.7                                            its GDP is estimated to suffer a
   -1          -0.8                                   -0.8
                                                                                                                    negative impact ranging from minus
 -1.2                      -1.1          -1.1                                     -1.1                              0.7% to minus 1.7% due to such
 -1.4
                                                                                                                    factors as a domestic price increase
 -1.6
                                                                                                                    and a productivity decline caused by
 -1.8                                                                                         -1.7
              Brazil     China         EU28          India        Indonesia      ROK        Viet Nam
                                                                                                                    an increase in the usage cost of data
   Remarks: The above figures are estimates based on the assumption of the introduction of data usage               processing services.
   regulations, including data localization, in all sectors in each country.
   Source: Prepared by METI from “The Cost of Data Localization: Friendly Fire on Economic
   Recovery” (ECIPE).

                                                                                                                                                             4
Part 2 Chapter 2 Rise of emerging and developing economies
  Rise of emerging and developing economies
                 Since around 2000, emerging and developing economies, especially
                  China, have led global economic growth.
                 The share of emerging and developing economies in global GDP is
                  becoming around 40%.

                                                         Changes in the global GDP growth rate
                                                       (in terms of contribution by country/region)
                                                                       (1990 -2017)
(%)                     Advanced countries       世界のGDP成長率の推移(国・地域別寄与度)     China
                        Emerging and developing countries (excluding China) Real gowth rate of global GDP
     6
                                                                                                                                                                                                                                                                                   Concerning the contribution to the
     5
                                                                                                                                                                                                                                                                                   real growth rate of global GDP by
     4                                                                                                                                                                                                                                                                             country/region, the contribution by
     3                                                                                                                                                                                                                                                                             advanced countries has been
                                                                                                                                                                                                                                                                                   gradually declining since around
     2
                                                                                                                                                                                                                                                                                   2000, while the contribution by
     1
                                                                                                                                                                                                                                                                                   emerging and developing countries,
     0                                                                                                                                                                                                                                                                             including    China,    has     been
         1981
                1982
                        1983
                               1984
                                      1985
                                             1986
                                                    1987
                                                           1988
                                                                  1989
                                                                         1990
                                                                                1991
                                                                                       1992
                                                                                              1993
                                                                                                     1994
                                                                                                            1995
                                                                                                                   1996
                                                                                                                          1997
                                                                                                                                 1998
                                                                                                                                        1999
                                                                                                                                               2000
                                                                                                                                                      2001
                                                                                                                                                             2002
                                                                                                                                                                    2003
                                                                                                                                                                           2004
                                                                                                                                                                                  2005
                                                                                                                                                                                         2006
                                                                                                                                                                                                2007
                                                                                                                                                                                                       2008
                                                                                                                                                                                                              2009
                                                                                                                                                                                                                     2010
                                                                                                                                                                                                                            2011
                                                                                                                                                                                                                                   2012
                                                                                                                                                                                                                                          2013
                                                                                                                                                                                                                                                 2014
                                                                                                                                                                                                                                                        2015
                                                                                                                                                                                                                                                               2016
                                                                                                                                                                                                                                                                      2017

 -1
                                                                                                                                                                                                                                                                                   increasing.
 -2

 -3

         Remarks: The contribution by country/region is an estimate based on each country/region’s share
         in nominal GDP in the previous year.
         Source: Prepared by METI based on the database of World Economic Outlook, April 2018 (IMF)

                  Changes in the share of emerging and developing countries
                      in nominal global GDP (Between 1980 and 2017)

 (1 trillion dollars)
90                                                                                                                                                                                                                                                                           45%
                       China
80                     Emerging and developing countries (excluding China)                                                                                                                                                                                                   40%   Nominal global GDP has been
                       Advanced countries
70
                       World
                                                                                                                                                                                                                                                                             35%
                                                                                                                                                                                                                                                                                   growing steadily despite temporary
                       Share of emerging and developing countries (including China) (right axis)
                                                                                                                                                                                                                                                                                   drops due to the Great Recession,
60                                                                                                                                                                                                                                                                           30%   among other factors. The share of
50                                                                                                                                                                                                                                                                           25%
                                                                                                                                                                                                                                                                                   emerging and developing countries
                                                                                                                                                                                                                                                                                   in nominal global GDP has been
40                                                                                                                                                                                                                                                                           20%
                                                                                                                                                                                                                                                                                   increasing since the middle of the
30                                                                                                                                                                                                                                                                           15%   2000s and has recently surpassed
                                                                                                                                                                                                                                                                                   40%.
20                                                                                                                                                                                                                                                                           10%

10                                                                                                                                                                                                                                                                           5%

 0                                                                                                                                                                                                                                                                           0%

                 Remarks: Nominal GDP is on a U.S. dollar basis.
                 Source: Prepared by METI based on the database of World Economic Outlook, April 2018 (IMF)

                                                                                                                                                                                                                                                                                                                                     5
Features of economic growth of emerging                                                                                                                 Part 2 Chapter 2 Rise of emerging and developing economies

and developing economies
                         In emerging and developing economies, fixed capital formation has accelerated since around
                          2003, and in 2016, it has reached 9.5 trillion dollars, almost the same value as in industrialized
                          economies. The average contribution to the real growth rate of GDP was 36% between 2003 and
                          2016.

                         In line with the growth in fixed capital formation, emerging and developing economies have
                          significantly increased the production capacity of the raw materials industry, providing a contrast
                          to the lack of growth in industrialized economies. Global production capacity for crude steel in
                          2017 was more than double the level in 2000.
                   Changes in the value of fixed capital formation (on a flow basis)
                               in developed and developing economies
                                          Share of emerging and developing countries (including China)
                          12
                                                                                                                                                              Fixed capital formation (in terms of
     1 trillion dollars

                          10
                                                                                                                                                              the value of domestic investments)
                                                                                                                                                              in emerging and developing
                          8                                                                                                                                   economies has been growing since
                          6
                                                                                                                                                              2000, and in 2016, it reached 9.5
                                                                                                                                                              trillion dollars, almost the same
                          4                                                                                                                                   value as the value in advanced
                                                                                                                                                              countries.
                          2

                          0
                               1980 1982 1984 1986 1988 1990 1992 1994 1996 1998 2000 2002 2004 2006 2008 2010 2012 2014 2016
  Source: UN national accounts main aggregates data (December 2017)
  Remarks: The classification of advanced, emerging and developing countries is based on the definition in the IMF WEO.

                                   Breakdown of the contribution by emerging and developing
                                  economies to the real growth rate of GDP by expenditure item
  3.5%
                                        Gross capital formation                              Final consumption expenditure                                    Since 2003 in particular, the
                                        Net export                                           Nominal GDP
  3.0%                                                                                                                                                        contribution by emerging and
  2.5%
                                                                                                                                                              developing economies in terms of
                                                                                                                                                              fixed capital formation has been
  2.0%
                                                                                                                                                              significant.
  1.5%

  1.0%

  0.5%

  0.0%
                           1980
                           1981
                           1982
                           1983
                           1984
                           1985
                           1986
                           1987
                           1988
                           1989
                           1991
                           1992
                           1993
                           1994
                           1995
                           1996
                           1997
                           1998
                           1999
                           2000
                           2001
                           2002
                           2003
                           2004
                           2005
                           2006
                           2007
                           2008
                           2009
                           2010
                           2011
                           2012
                           2013
                           2014
                           2015
                           2016

  -0.5%

                               Remarks: Real GDP data in 1990 was excluded because statistical data concerning NIS countries were newly
  -1.0%
                               added, a factor that overrepresents the growth rate.
                               Source: UN national accounts main aggregates data (December 2017)
                                                                                                                                                              While production capacity for crude
                                                                                                                                                              steel has stayed at around 600
                                    Changes in global production capacity for crude steel
      1 million tons
                                                                                                                                                              million tons in developed economies
     2500
                                        Advanced countries                                                                                                    over the past 17 years, capacity in
                                        Emerging and developing countries (excluding China)                                                                   emerging and developing economies
                                        China
     2000                                                                                                                                                     as a whole has continued to grow. In
                                                                                                                                                              2017, global production capacity
     1500                                                                                                                                                     increased to 2,300 million tons,
                                                                                                                                                              around 2.3 times as large as the
     1000                                                                                                                                                     capacity in 2000.

           500                                                                                                                                                Among emerging and developing
                                                                                                                                                              economies, China has increased its
                      0                                                                                                                                       production capacity markedly.
                       2000 2001 2002 2003 2004 2005 2006 2007 2008 2009 2010
                     Remarks: The definition of advanced countries is based on the IMF’s definition.
                     Source: OECD Stat
                                                                                                            2011   2012   2013   2014     2015   2016
                                                                                                                                                                                                                6
Chronology of the excess production capacity                                                                               Part 2 Chapter 2 Rise of emerging and developing economies

in China’s steel industry

         (i) Period of “imports surpassed exports”: Production capacity for crude steel
             expanded through the use of loans from state-owned local banks, while the profit
             margin increased

         (ii) Period of “exports surpassed imports”: The expansion of production capacity
              continued, but the profit margin declined. Subsidies started to increase.

         (iii) After the reduction of production capacity for crude steel: The profit margin
              showed signs of improving.

                            The development of the Chinese steel industry (2001-2016)
                                                                                                                                  (i) Between 2001 and 2005, China
Long-term Subsidy Production capacity                                                  (ii)                       (iii) (%)
loan (1 billion (1 billion and net exports
                                                (i)                                                                               recorded steel import surpluses. As
 dollars)       dollars) (10 million tons)
  5         2      20                                                The profit margin declined.                        15        banks increased low-interest loans and
                          Production capacity expanded through
                          loans and the profit margin increased.                                                                  steel companies expanded production
                                                                                                                                  capacity, the return on assets (ROA)
                                                                                                                        10        rose from 7% in 2001 to 14% in 2004.
  2.5       1      10
                                                                                                                        5         (ii) Since 2006, China has recorded
                                                                                                                                  steel export surpluses, but loans and
  0         0       0                                                                                                   0         production capacity expansion have
                                                                                                                                  continued.
                                   Long-term loans (change from the previous                                            -5
                                                                                                                                  From 2008 onward, the ROA for steel
                                   year)                                                                                          companies stayed below 5%.
 -2.5      -1     -10              Production capacity for crude steel (change
                                                                           Around 20 to 70% of
                                   from the previous year)                 companies recorded losses,                             Subsequently, the steel market slumped.
                                   Governmental subsidies (fiscal year)    and subsidies increased.            -10
                                                                                                                                  In 2012, around half of all listed steel
                            Net exports of crude steel from China                          Production capacity for
                                                                                           crude steel decreased.                 companies recorded operating losses,
  -5       -2                                                     Monetary tightening
                  -20                                                                                          -15                and in 2015, around 70% did so. In both
                      2001 2002 2003 2004 2005 2006 2007 2008 2009 2010 2011 2012 2013 2014 2015 2016
                                                                                                                                  years, governmental subsidies increased
  Sources: Production capacity: National Bureau of Statistics of China and CEIC Database; net exports of crude steel: World       steeply.
  Steel Association; long-term loan and government subsidy: annual reports of 33 listed Chinese steel companies.

                                                                                                                                  (iii) In February 2016, the central
                                                                                                                                  government set the target for the
                                                                                                                                  reduction of production equipment and
                                                                                                                                  strictly managed the implementation of
                                                                                                                                  the target. As a result, the target was
                                                                                                                                  achieved in 2016 and 2017.
   Targets for the reduction of crude steel production equipment in China and the results
                                                                                                                                  In response to the G20 Leaders’
                                                              2016                            2017             2018               Communique at the Hangzhou Summit
                Long-term target
                                               Target            Result            Target             Target                      in 2016, the Global Forum on Steel
 Reduction of 100 to 150 million                                                   Approx. 50 million Approx. 30 million          Excess Capacity was established.
                                               45 million tons 65 million tons                                                    Through the forum, information is
 tons over five years from 2016                                                    tons               tons
                                                                                                                                  exchanged with respect to production
        Remarks: The target for 2017 was reportedly achieved.                                                                     capacity    for    crude steel  and
        Source: The government work report issued at the National People’s Congress, etc.                                         governmental support measures in
                                                                                                                                  individual countries.

                                                                                                                                                                                   7
Trends by corporate ownership type                                                                                             Part 2 Chapter 2 Rise of emerging and developing economies

                Most loans from state-owned banks and support measures such as governmental subsidies are
                 provided to steel companies owned/controlled by local governments, whose operational
                 efficiency is relatively low.
                Changes in the balance of long-term loans at Chinese steel companies
     (1 billion dollars)               (33 listed companies)
25
                  Grand total                                                                                                       Support measures such as loans to
                  State-owned (owned/controlled by the central                                                                      production equipment investment in
                  government)
20                State-owned (owned/controlled by local                                                                            steel companies and government
                  governments)
                  Private companies                                                                                                 subsidies, provided in response to
                                                                                                                                    the sluggish business performance
15
                                                                                                                                    since 2012, have been allocated
                                                                                                                                    mainly         to        companies
10                                                                                                                                  owned/controlled      by      local
                                                                                                                                    governments.
 5
                                                                                                                                    Most loans and governmental
                                                                                                                                    subsidies have been allocated to
 0                                                                                                                                  steel companies owned/controlled
     2000 2001 2002 2003 2004 2005 2006 2007 2008 2009 2010 2011 2012 2013 2014 2015 2016 2017
Remarks: As of the end of 2016, there were 5 companies owned/controlled by the central government, 21 companies                     by local governments, according to
owned/controlled by local governments, and 7 private companies.
Source: Annual reports of 33 listed Chinese steel companies
                                                                                                                                    a comparison of three groups—
                                                                                                                                    companies owned/controlled by the
                Changes in the value of subsidies received by Chinese steel companies                                               central government, companies
   (1 million dollars)                  (33 listed companies)                                                                       owned/controlled      by     local
1,200
                           Grand total                                                                                              governments, and private companies.
1,000                      State-owned (owned/controlled by the central
                           government)
                           State-owned (owned/controlled by local governments)                                                      However, the allocation of loans
 800                       Private companies
                                                                                                                                    and subsidies has not necessarily
                                                                                                                                    contributed to any improvement of
 600                                                                                                                                the companies’ profitability or value
                                                                                                                                    added. In particular, despite the
 400                                                                                                                                intensive support they received,
                                                                                                                                    management         capability      of
 200                                                                                                                                companies owned/controlled by
                                                                                                                                    local governments has not improved,
      0
            2000 2001 2002 2003 2004 2005 2006 2007 2008 2009 2010 2011 2012 2013 2014 2015 2016 2017
                                                                                                                                    with their ROA remaining lower
                                                                                                                                    than other groups’ ROA.
     Remarks: As of the end of 2016, there were 5 companies owned/controlled by the central government, 21 companies
     owned/controlled by local governments, and 7 private companies.

                             The return on assets (ROA) for Chinese steel companies
                                          (by corporate ownership type)
          (%)                                                       Grand total
  20
                                                                    State-owned (owned/controlled by the central government)
                                                                    State-owned (owned/controlled by local governments)
  15                                                                Private companies

  10

     5

     0
           2000 2001 2002 2003 2004 2005 2006 2007 2008 2009 2010 2011 2012 2013 2014 2015 2016 2017

  -5

 -10
     Remarks 1: As of the end of 2016, there were 5 companies owned/controlled by the central government, 21 companies
     owned/controlled by local governments, and 7 private companies.
     Source: Annual reports of 33 listed Chinese steel companies.                                                                                                                      8
Part 2 Chapter 2 Rise of emerging and developing economies
 Possibility of a new excess capacity

         China’s integrated circuit (IC) industry has rapidly increased capital investment
          through governmental support. This is similar to the situation in the period (i)
          “imports surpassed exports” in the steel industry, but capital investment has not yet
          led to a profitability improvement.
         As a new support tool, industry development funds have emerged.
         There is a risk that an excess production capacity problem may occur in the future.

                                                                                                                                      In 2014, the Chinese government
                      Increase in the value of fixed assets, value of governmental subsidies,
                                                                                                                                      formulated   the     National IC
                                    and profit margin of IC-related companies                                                         Development Guidelines.
(1 million dollars)            The value of investments by the National IC Industry Development Fund (fiscal year)
    6,000                      Value of governmental subsidies (fiscal year)                                                4         Based on the guidelines, a national
                               Value of fixed assets (change from the previous year)
                               Long-term loan (change from the previous year)
                                                                                                                         3.5
                                                                                                                                      investment fund specialized in support
                               ROA (return on assets) (right axis)
    5,000
                                                                                                                      (%)             for the IC industry (National IC
                                                                                                                         3            Industry Investment Fund) was
    4,000                                                                                                                             established in the same year, and the
                                                                                                                            2.5
                                                                                                                                      fund has invested around 4 billion
    3,000                                                                                                                   2         dollars    annually   in    IC-related
                                                                                                                                      companies.
    2,000                                                                                                                   1.5

                                                                                                                            1
                                                                                                                                      As a result, in addition to governmental
    1,000                                                                                                                             subsidies and companies’ borrowings,
                                                                                                                            0.5       policy resources including investments
          0                                                                                                                           by investment funds have increased
                                                                                                                            0
                                                                                                                                      rapidly since 2014. In line with the
   -1,000                                                                                                                   -0.5      increase, the value of fixed assets rose
              2009      2010      2011          2012       2013        2014           2015    2016        2017                        steeply between 2015 and 2017.
   Remarks 1: The ROA is obtained by dividing the total value of operating profits of the 19 IC-related listed companies
   in China by the total value of assets. The ROA in 2009 was -12.4%.
   Source: Annual reports of the 19 IC-related listed companies in China.                                                             On the other hand, the return on assets
                                                                                                                                      for companies continued to decline in
                                                                                                                                      the same period.

                                                                                                                                      This trend in the Chinese IC industry is
                                                                                                                                      similar to the situation of the Chinese
                        Changes in the number of industry investment funds
                                      and the total fund value                                                                        steel industry in the period of net
 (Number of funds)
    1,800
                                                                                                              (100 million yuan)
                                                                                                                       9,000
                                                                                                                                      import, so there are concerns that an
                                                                                                                                      excess production capacity problem
    1,600                                                                                                              8,000          may occur in the IC industry as well in
                                    Number of funds (cumulative total) (right axis)
                                    Total fund value (100 million yuan)
                                                                                                                                      the future.
    1,400                                                                                                              7,000

                                                                                                                                      In recent years, industry investment
    1,200                                                                                                              6,000
                                                                                                                                      funds such as the National IC Industry
    1,000                                                                                                              5,000          Development Fund have played a
                                                                                                                                      particularly significant role as policy
       800                                                                                                             4,000          fund sources.
       600                                                                                                             3,000
                                                                                                                                      Since around 2014, the number and
       400                                                                                                             2,000          value of those funds have increased
                                                                                                                                      rapidly, and the funds’ presence as the
       200                                                                                                             1,000          main policy fund source in China is
                                                                                                                                      growing.
          0                                                                                                            0
                      2013               2014                 2015                    2016         August 2017

        Source: Database of Zero2IPO Group "Si Mu Tong"

                                                                                                                                                                                        9
Comparison between Japan and China                                                                                       Part 2 Chapter 2 Rise of emerging and developing economies
in terms of governmental support

       There is a large difference between the IC industry promotion measures in Japan and
        China in terms of the scale of governmental support.
       The Chinese government’s subsidies for those companies are equivalent in value to
        around 2 to 4% of their sales. Meanwhile, the ROA shows a downward trend.
       The Japanese government’s subsidies for those companies are equivalent in value to
        less than 0.6% of their sales, at most. Meanwhile, the ROA shows an upward trend.

                                                       China
                ROA (return on assets)                    Ratio of the value of governmental subsidies to sales
10
      (%)
 9
                                Notice concerning policy related to the   Guidelines to Promote National IC
                                promotion of development of the IC        Industry Development (State
                                                                                                                               The Chinese government’s subsidies for
 8
                                industry (State Council; 2011)            Council; 2014))                                      companies are equivalent in value to
                                →Enhancement of financial support,        →Establishment of funds
 7
                                including subsidies and loan interest     →Enhancement of loans
                                                                                                                               around 2 to 4% of their sales.
 6                              discounts, etc.                           →Enhancement of financial support
                                                                          ,etc.
                                                                                                                               Meanwhile,        the     ROA       is    trending
 5
                                                                                                                               downward.
 4

 3

 2

 1

 0
         2008       2009        2010       2011       2012       2013       2014       2015        2016       2017

     Remarks 1: The ROA is the figure obtained by dividing the total value of operating
     profits of the 19 IC-related listed companies in China by the total value of assets.
     Remarks 2: The ROA was -4.3% in 2008 and -12.4% in 2009.
     Source: Annual reports of the 19 IC-related listed companies in China.

 (%)                                                    Japan
                       ROA (return on assets)
10                     The ratio of miscellaneous revenue to sales
                                                                                                                               The     value     of  governmental
9                      The ratio of the value of governmental subsidies to sales of the Super LSI Technology Research
                                                                                                                               investments in the Super LSI
                       Association
8                                                                                                                              Technology Research Association
7                                                                                                                              was 29.0 billion yen.
6
                                                                                                                               The value of governmental subsidies
5                                                                                                                              for companies before and after the
4                                                                                                                              implementation period of the
                                                Implementation period                                                          association’s project in Japan was
3                                               of the project under the                                                       equivalent to less than 0.6% of their
                                                Super LSI Technology
2                                                Research Association                                                          sales at most.
1
                                                                                                                               Meanwhile, the ROA is trending
0
                                                                                                                               upward.
       1971 1972 1973 1974 1975 1976 1977 1978 1979 1980 1981 1982 1983 1984
     Remarks 1: Data was obtained from the five companies that participated in the Super LSI Technology Research
     Association (excluding joint venture companies).
     Remarks 2: The ROA is the figure obtained by dividing the total value of operating profits of the five companies
     by the total value of assets.
     Remarks 3: Regarding "miscellaneous revenue ("others")", figures in the non-operating revenue column of the
     profit and loss statement were used.
     Remarks 4: The ratio of the value of governmental subsidies to sales for the Super LSI Technology Research
     Association is the figure obtained by dividing by four the total value of governmental subsidies in the four-year
     project period, which was 29 billion yen, and then dividing the figure thus obtained by the total sales figure of
     the five companies.
     Source: Securities reports of the five companies that participated in the Super LSI Technology Research                                                                   10
     Association (excluding joint venture companies)
Change in the driver of China’s economic growth                                                                                                                                                                                   Part 2 Chapter 3 Rapid change in the Chinese economy
                                                                                                                                                                                                                                                       Section 1 Macroeconomic trends

                        In China, consumption has replaced gross capital formation as the largest
                         contributor to GDP growth. The economy is gradually shifting from the previous
                         investment-led growth to a consumption-led one.

                        By industry, the contribution by the information transmission, software and
                         information technology services industries, which are growth industries, grew
                         26% in 2017 compared with the previous year.

                                                  Changes in the contribution by GDP components
                                                         to China’s real GDP growth rate

                                                                                                                                                                                                                                   If GDP is looked at from the
 (%)                                                                                                                                                             Net exports turned to
20                                                                                                                                                                                                                                 viewpoint of demand, the share of
                    Net exports
                                                                                                                                                                 negative growth, but capital
                                                                                                   Lehman Shock                                                  formation made up for that.                                       exports in GDP has declined since the
                    Gross capital                                                                   (Sept. 2008)
15
                    formation
                    Final consumption
                                                                                                                                                                                                                                   Great Recession and the share of
                    GDP                                                                                                                                            Gross capital formation
                                                                                                                                                                                                                                   gross capital formation has decreased
                                                                                                                                                                                                                                   since the 4-trillion-yuan economic
10
                                                                                                                                                                                                                                   package, while the share of final
                                                                                                                                                                                                                                   consumption has been growing
 5
                                                                                                                                                                                                                                   moderately.

 0                                                                                                                                                                                                                                 If these trends are examined based on
                                                                                                                                                                       Consumption                                                 the breakdown of contributions to the
 -5                                                                                                                                                                                                                                real    GDP      growth    rate,  the
                                                                                                                                                                   Net exports                                                     contribution by investment has
-10                                                                                                                                                                                                                                declined since the Great Recession,
          2000 2001 2002 2003 2004 2005 2006 2007 2008 2009 2010 2011 2012 2013 2014 2015 2016 2017                                                                                                                                while consumption has become the
          Remarks: Regarding the contribution by final consumption, a breakdown of the consumption into government and private consumption is not
          published.                                                                                                                                                                                                               main driver of growth. In that sense,
          Source: The National Bureau of Statistics of China and CEIC database.
                                                                                                                                                                                                                                   the economy is gradually shifting
                                                                                                                                                                                                                                   from investment-led growth to
                                                                                                                                                                                                                                   consumption-led growth.

                                              Real GDP growth rate by industry in China (2017)

 (%)                                                                                                                                                                                                                               A look at the real GDP growth rate by
 30                                                                                                                                                                                                                                industry in China in 2017 shows that
                                                                                                                                                                                  26.0%
 25                                                                                                                                                                                                                                the     information     transmission,
                                                                                                                                                                                                                                   software and information technology
 20                                                                                                                                                                                                                                services industry recorded an
 15
                                                                                                                                                                                                                                   outstandingly high growth rate of
                                                                                                                                                                                                                                   26.0%.
 10
               6.9%
      5

      0
                                                                                                                                                                                  communication…
               Overall

                                                  manufacturing

                                                                                 telecommunications…

                                                                                                                               Accommodation and…
                                                                  Construction

                                                                                                                                                       Finance
                                                                                                        Wholesale and retail

                                                                                                                                                                    Real estate

                                                                                                                                                                                                                         Others
                                                                                                                                                                                                     Business services
                          Agriculture, forestry

                                                                                                                                                                                   Information and
                                                                                                                                Lodging and eateries
                                                                                   Transportation and
                                                    Industrial
                             and fisheries

                                                                                                              trade

  Source: The National Bureau of Statistics of China and CEIC database.

                                                                                                                                                                                                                                                                                   11
Development of new industries in China                                                                                                              Part 2 Chapter 3 Rapid change in the Chinese economy
                                                                                                                                                                            Section 2 Advance of new industries

       China was the global No. 1 in terms of EC transactions in 2016 with a total
        transaction value of 23 trillion yuan (around 3.4 trillion dollars).
       Internet services for consumers are wide-ranging, but the number of users
        is rising at a particularly high pace with respect to travel reservations, meal
        deliveries, car dispatching and financial services.
       The scale of the sharing economy has also been growing rapidly, rising
        47% in value in 2017 compared with the previous year to around 4.9
        trillion yuan (around 0.73 trillion dollars).
                          Utilization of internet applications by sector in China
                                          (as of the end of 2017)
  (100 million people)                                                                                                                      (%)
         8                                                                                                                                           80
              7.2                  With respect to video, music, shopping,
                                                                                                                                                            Concerning Internet applications, it is
         7                         and financial settlement, there are already                       The rate of increase is high with               70     estimated that there are more than 500
                                   more than 500 million users.                                      respect to travel reservations and
         6                                                                                           meal deliveries.                                60     million users with respect to each of
         5
                                                          The number of users                       Rate of increase                                 50
                                                                                                                                                            instant messaging, search engines,
                                                                                                    (right axis)                                            video, music, shopping, online
         4                                                                                                                                           40
                                                                                                                                                            settlement.
         3                                                                                                                                           30

         2                                                                                                                                           20     The rate of increase in the number of
         1     8.1                                                                                                                                   10     users is high with respect to travel
         0                                                                                                                                           0      reservations, meal deliveries, car
                                                                                                                                                            dispatching, and financial services,
                                                                                                                                                            indicating a rapid market expansion.

                                                                                                                                      Rate of increase
                                                                                                                                      in the number of
                                                                                                                                      internet users
Remarks: The rate of increase is on a year-on-year basis. With respect to bicycle sharing, the rate of increase is not available because this item
was not covered in the previous year’s survey.
Source: The 41st Statistical Report on Internet Development in China (January 2018) (China Internet Network Information Center )

                                    The scale of the sharing economy (2017)
                                                                                                                                                            The sharing economy has emerged as
                                                                                                 (Unit: 100 million yuan, %)                                a new type of economic activity
                                                                    Scale of the market
                                                                                                                                                            conducted via the internet.
                                                                                                                                  Value of
                                                      Value of                                            Rate of                    funds
                                                                                  Share                                                                     The scale of the market was around
                                                   transaction                                           increase                 provided                  4.9 trillion yuan in 2017, up 47%
          Medical care                                                70                      0.1                    48.0                            19     from the previous year.
          Housing and lodging                                      145                        0.3                    70.6                            37     By transaction value by sector, the
          Knowledge and skills                                  1,382                         2.8                 126.6                        266          transaction value of financial services,
          Transportation                                        2,010                         4.1                    56.8                   1,072           including online financial services,
                                                                                                                                                            amounts to around 2.8 trillion yuan,
          Production capacity                                   4,120                         8.4                    25.0                            34
                                                                                                                                                            accounting for more than half of the
          Everyday life services                             13,214                        26.9                      82.7                      512          total.
          Financial services                                 28,264                        57.4                      35.5                      220
          Total                                              49,205                      100.0                       47.2                   2,160           The total value of funds provided for
                                                                                                                                                            new market entry and business
          Source: "Report on Development of Sharing Economy 2018" (Sharing Economy
                                                                                                                                                            expansion in all sectors grew 25.7%
          Research Center, State Information Center and Working Committee on Sharing
                                                                                                                                                            from the previous year to 216.0
          Economy, Internet Society of China)
                                                                                                                                                            billion yuan.
                                                                                                                                                                                                             12
Rising entrepreneurial activity                                                                                                    Part 2 Chapter 3 Rapid change in the Chinese economy
                                                                                                                                                     Section 2 Advance of new industries

              The annual number of newly registered companies was 6.07 million in 2017
               (19.25 million if self-employed businesses are included).

              China became the second largest investing country in venture companies with a
               total investment value of 2.2 trillion yen, next to the United States, where the
               total investment value was 7.5 trillion yen.
          Changes in the number of newly registered companies in China
     (million companies)
 7
                                                                                                                                     Since around 2014, when “Mass
                       Tertiary industry
 6                                                                                                                                   Entrepreneurship and Innovation,” an
                       Secondary industry             Mass Entrepreneurship
 5                                                    and Innovation                                                                 entrepreneurship support initiative
                       Primary industry
                                                                                                                                     promoted by the Chinese government,
 4
                                                                                                                                     was announced, the number of new
 3                                                                                                                                   business startups has increased
 2                                                                                                                                   rapidly.
 1

 0
                2012                 2013                 2014               2015                2016               2017

          Source: The State Administration for Industry & Commerce of the People’s Republic of
          China and the CEIC database.
     Remarks: The total number of registered companies in China is 30.34 million, and the number is
     around 98 million if self-employed businesses are included (2017).

                            Changes in the business startup and closure rates
  (%)                           in Japan, the United States and China
  30
                                                                                                                                     As evidenced by the huge number of
                     Business startup rate in China                 Business closure rate in China                                   newly registered companies, the
                     Business startup rate in U.S.                  Business closure rate in U.S.
  25                                                                                                                                 business startup rate in China is much
                     Business startup rate in Japan                 Business closure rate in Japan
                                                                                                                                     higher than the rates in the United
  20                                                                                                                                 States and Japan.
  15

  10

     5

     0
                2010          2011            2012           2013            2014           2015
         Source: CEIC with respect to China; U.S.: Business Dynamics Statistics; Japan: Annual Report on
         Employment Insurance .

                                                                                                                                     In terms of the value of investments
                                 The value of venture investments in major countries                                                 made by venture capital, China was
     (billion yen)                                                                                                                   the second largest investing country
     10,000
                          U.S.       China           Europe      Japan
                                                                                                                                     with a value of 2.2 trillion yen, next to
      9,000                                                                                                     8,624                the United States, where the total
      8,000                                                                                           7,492              7,519       investment value was 7.5 trillion yen.
      7,000

      6,000
                                                                                                                                     It can be said that the financing
                                                                          4,820              4,876
                                                                                                                                     environment in China is very
      5,000
                                                                                    4,421                                            favorable for entrepreneurs.
                                   3,868     4,043
      4,000
                                                                 3,392
                         3,164
                                                       2,881
      3,000 2,560
                                                                                                                 2,121     2,153
      2,000                                                                                             1,703
                                                                           1,346
      1,000                                                        585                755      657
                                     389       472        303
                 155       228
           0
                 2005      2006      2007      2008       2009     2010     2011      2012     2013      2014     2015      2016

               Source: Venture White Paper 2017 (Venture Enterprise Center)
                                                                                                                                                                                      13
Improvement of China’s innovation capability                                                                                                                                                                                                                                                                                                                                                                                                                                                                                                                                                                                                                                                                                                                                                                                                                                       Part 2 Chapter 3 Rapid change in the Chinese economy
                                                                                                                                                                                                                                                                                                                                                                                                                                                                                                                                                                                                                                                                                                                                                                                                                                                                                                     Section 2 Advance of new industries

           The number of Chinese international patent publications has increased
            over the past 18 years and has almost caught up with the United States
            and Japan.
           Regarding the 10 priority fields of “Made in China 2025”, China has
            become a major global player in the field of IT-related technology.
           On the other hand, China still lags behind the United States in the field
            of biotechnology and medical products, and behind Japan in the field of
            machinery.
                                                                                                                                                                                         International Patent Applications in Major Countries
 (Number of applications)
    70,000
                                                                                                U.S.                                                                                                                                           China                                                                                                         Japan
                                                                                                Germany                                                                                                                                        South Korea                                                                                                   France                                                                                                                                                                                                                                                                                                                                                                                                                                                                                                                  Since China acceded to the Patent
    60,000                                                                                      U.K.                                                                                                                                           Switzerland                                                                                                   Netherlands                                                                                                                                                                                                                                                                                                                                                                                                                                                                                                             Cooperation Treaty (PCT) in 1994, the
                                                                                                                                                                                                                                                                                                                                                                                                                                                                                                                                                                                                                                                                                                                                                                                                     56,518
                                                                                                Sweden
                                                                                                                                                                                                                                                                                                                                                                                                                                                                                                                                                                                                                                                                                                                                                                                                                                                                                     annual number of patent applications
    50,000                                                                                                                                                                                                                                                                                                                                                                                                                                                                                                                                                                                                                                                                                                                                                                                           48,869                                                                          have risen sharply. In 2000, China was
                                                                                                                                                                                                                                                                                                                                                                                                                                                                                                                                                                                                                                                                                                                                                                                                     48,207                                                                          16th in terms of the number of
    40,000                                                                                                                                                                                                                                                                                                                                                                                                                                                                                                                                                                                                                                                                                                                                                                                                                                                                           international patent applications, with
                                                                                  38,015                                                                                                                                                                                                                                                                                                                                                                                                                                                                                                                                                                                                                                                                                                                                                                                             782 applications. China overtook the
                                                                                                                                                                                                                                                                                                                                                                                                                                                                                                                                                                                                                                                                                                                                                                                                                                                                                     Republic of Korea in 2010 and
    30,000
                                                                                                                                                                                                                                                                                                                                                                                                                                                                                                                                                                                                                                                                                                                                                                                                                                                                                     Germany in 2013, and in 2017, it
                                                                                                                                                                                                                                                                                                                                                                                                                                                                                                                                                                                                                                                                                                                                                                                              18,943
                                                                                                                                                                                                                                                                                                                                                                                                                                                                                                                                                                                                                                                                                                                                                                                                                                                                                     overtook Japan to become the global
    20,000
                                                                                                                                                                                                                                                                                                                                                                                                                                                                                                                                                                                                                                                                                                                                                                                                                                                                                     No. 2, after the United States.
                                                                      12,581                                                                                                                                                                                                                                                                                                                                                                                                                                                                                                                                                                                                                                                                                                                         15,753
    10,000
                                                                      9,569

                            0 782
                                2000 2001 2002 2003 2004 2005 2006 2007 2008 2009 2010 2011 2012 2013 2014 2015 2016 2017
                                      Source: Prepared by METI based on WIPO Statistics Database
                                                                                                                                                                                                                                                                                                                                                                                                                                                                                                                                                                                                                                                                                                                                                                                                                                                                                     Looking at the number of international
(Number of publication)
   3500                                                                                                                                                                                                                                                                                                                                                                                                                                                                                                                                                                                                                                                                                                                                                                                                                                                                              patent publications in the 10 priority
   3000                                                                                                                                                                                                                     Number of international patent publications (2000)                                                                                                                                                                                                                                                                                                                                                                                                                                                                                                                                                                                                       fields of “Made in China 2025”, China
   2500
   2000
                                                                                                                                                                                                                                                                                                                                                                                                                                                                                                                                                                                                                                                                                                                                                                                                                                                                                     has not only caught up with major
                                                                                                                                                                                                                                                                                                China                                                         Japan                                                    U.S.                                                                                                                                                                                                                                                                                                                                                                                                                                                          global countries in the field of IT-
   1500
   1000                                                                                                                                                                                                                                                                                                                                                                                                                                                                                                                                                                                                                                                                                                                                                                                                                                                                              related technology in particular but is
    500                                                                                                                                                                                                                                                                                                                                                                                                                                                                                                                                                                                                                                                                                                                                                                                                                                                                              also leading the world in some fields,
     0
                                                                                                                                                                                                                                                                                                                                                                                                                                                                                                                                                                                                                                                                                                                                                                                                                                                                                     such as digital communications.
                                                                                                                                                                                              Audio-visual technolog y
                                                                           Telecommunications

                                                                                                                                                                                                                                                                                                                                                                                                                                  Electr ical machinery, appa ratus, ener gy

                                                                                                                                                                                                                                                                                                                                                                                                                                                                                                                                                                                                                                                                                                                  Chemical engineer ing

                                                                                                                                                                                                                                                                                                                                                                                                                                                                                                                                                                                                                                                                                                                                                                                                                                                         Organic fine chemistr y
                                                                                                        IT methods for mana gement

                                                                                                                                                                                                                                                                                                                                                                                                                                                                                                                                                                                                                                                                                                                                                               Pha rmaceuticals
                                                                                                                                                                                                                             Semiconductor s

                                                                                                                                                                                                                                                                                                                                                                                                                                                                                                                                                                                                                                                                                                                                                                                                                 Analysis of biological mater ials
                                                                                                                                                                                                                                                                                                                                      Mechanical element s

                                                                                                                                                                                                                                                                                                                                                                                                                                                                                                                                                                                                                                                                                            Food chemist ry
                                                                                                                                                                                                                                                                                                                                                                                                                                                                                                                                                                                                                                                                Materials, metallur gy

                                                                                                                                                                                                                                                                                                                                                                                                                                                                                                                                                                                                                                                                                                                                                                                     Medica l technology
                                                                                                                                                                                                                                                                                                                                                                 Transport

                                                                                                                                                                                                                                                                                                                                                                                              Other special machines

                                                                                                                                                                                                                                                                                                                                                                                                                                                                                                                                                                                                                                                                                                                                            Biotechnology
                                                                                                                                            Bas ic communicat ion pr ocesses

                                                                                                                                                                                                                                                                                                                                                                                                                                                                                                                                                                                   Sur face technolog y, coating
                                                                                                                                                                                Optics

                                                                                                                                                                                                                                                                                                                                                                                                                                                                                       Micro-structural and nano-t echnology
                                                                                                                                                                                                                                                                     Meas urement

                                                                                                                                                                                                                                                                                                                                                                                                                                                                                                                                      Macr omolecular chemist ry, polymers
                                                                                                                                                                                                                                                                                     Handling
              Comput er t echnology

                                                                                                                                                                                                                                                                                                                                                                              Contr ol
                                             Digital communicat ion

                                                                                                                                                                                                                                                                                                       Engines, pumps, turbines
                                                                                                                                                                                                                                                   Machine tools

                                                                                                                                                                                                                                                                                                                                                                                                                                                                                                                                                                                                                              Bas ic mat erials chemistry

   8000
   7000                                                                                                                                                                                                                  Number of international patent publications (2017)                                                                                                                                                                                                                                                                                                                                                                                                                                                         China lags behind
   6000                                 China has become a                                                                                                                                                                                                                                                                                                                                                                                                                                                                                                                                                                                                                                                                          the United States.                                                                                                                               On the other hand, China lags behind
   5000
                                           major player.                                                                                                                                                                                                                                                                                                                                                                                                                                                                                                                                                                                                                                                                                                                                                                                                                             the United States in biotechnology and
   4000
                                                                                          (i) Next-generation IT technology
                                                                                                                                                                                                                                                         China lags behind Japan.
                                                                                                                                                                                                                                                (ii) Machine tools and robotics                      (iii) to (vi) and (viii) Aerospace and aeronautical (vii) Power                                                                                                                                                                                                                                               (ix) New materials                                                                                                              (x) Biopharmaceuticals and medical equipment                                                                                      medical technology and behind Japan in
   3000                                                                                                                                                                                                                                                                                         equipment, maritime equipment, rail transport equipment, equipment
   2000
                                                                                                                                                                                                                                Number of international patent
                                                                                                                                                                                                                                                                                                           automobiles, and agricultural equipment
                                                                                                                                                                                                                                                                                                                                                                                                                                                                                                                                                                                                                                                                                                                                                                                                                                                                                     the     field    of     machinery-related
   1000
     0
                                                                                                                                                                                                                                    publications (2017)                                                                                                                                                                                                                                                                                                                                                                                                                                                                                                                                                                                                                              technology, including robotics, in terms
                                                                                                                                                                                                                                                                                                                                                                                                                                                                                                                                                                                                                                                                                                                                          Biotechnology

                                                                                                                                                                                                                                                                                                                                                                                                                                                                                                                                                                                                                                                                                                                                                                                                                                                                                     of the number of patent publications.
                                        Digital communication

                                                                                                                                     Basic communication processes

                                                                                                                                                                                                                          Semiconductors

                                                                                                                                                                                                                                                                                                                                                                                                                                                                                                                                                                                                                                                                                         Food chemistry

                                                                                                                                                                                                                                                                                                                                                                                                                                                                                                                                                                                                                                                                                                                                                            Pharmaceuticals

                                                                                                                                                                                                                                                                                                                                                                                                                                                                                                                                                                                                                                                                                                                                                                                                           Analysis of biological materials
                                                                                                                                                                                                                                                                   Measurement

                                                                                                                                                                                                                                                                                                                                                                                                                         Electrical machinery, apparatus, energy

                                                                                                                                                                                                                                                                                                                                                                                                                                                                                                                                                                                                                                                                                                              Chemical engineering
                                                                                                                                                                               Optics

                                                                                                                                                                                                                                                                                                                                                                                                                                                                                                                                                                                                                                                                                                                                                                                  Medical technology
                                                                                                  IT methods for management

                                                                                                                                                                                                                                                                                                                                  Mechanical elements

                                                                                                                                                                                                                                                                                                                                                                                                                                                                                                                                                                                                                                                                                                                                                                                                                                                     Organic fine chemistry
                                                                                                                                                                                                                                                                                                                                                                                         Other special machines

                                                                                                                                                                                                                                                                                                                                                                                                                                                                                                                                                                                                                                                            Materials, metallurgy
                                                                                                                                                                                                                                                                                                                                                               Transport
          Computer technology

                                                                                                                                                                                                                                                                                                                                                                                                                                                                                                                               Macromolecular chemistry, polymers
                                                                                                                                                                                                                                                                                                                                                                             Control
                                                                                                                                                                                                                                                                                                  Engines, pumps, turbines
                                                                                                                                                                                         Audio-visual technology

                                                                                                                                                                                                                                                Machine tools

                                                                                                                                                                                                                                                                                                                                                                                                                                                                               Micro-structural and nano-technology
                                                                       Telecommunications

                                                                                                                                                                                                                                                                                                                                                                                                                                                                                                                                                                             Surface technology, coating
                                                                                                                                                                                                                                                                                    Handling

                                                                                                                                                                                                                                                                                                                                                                                                                                                                                                                                                                                                                         Basic materials chemistry

                                                                                                                                                                                                                                                                                                                                                                                                                                                                                                                                                                                                                                                                                                                                                                                                                                                                                     This indicates that China has focused
                                                                                                                                                                                                                                                                                                                                                                                                                                                                                                                                                                                                                                                                                                                                                                                                                                                                                     on particular fields in efforts to enhance
                                                                                                                                                                                                                                                                                                                                                                                                                                                                                                                                                                                                                                                                                                                                                                                                                                                                                     its technological capability.

                                                                                                                                                                                                                                                                                                                                                                                                                                                                                                                                                                                                                                                                                                                                                                                                                                                                                     China is attempting to strengthen its
                                                                                                                                                                                                                                                                                                                                                                                                                                                                                                                                                                                                                                                                                                                                                                                                                                                                                     competitiveness in fields where it is
                                                                                                                                                                                                                                                    (iii) to (vi) and (viii)                                                                                                                                                                                                                                                                                                                                                                                                                                                                                                                                                                                                         lagging, designating them as priority
                                                                                                                                                                                                                                 (ii) High-level NC Aerospace, maritime,
                                                                       (i) Next-generation                                                                                                                                        machine tools     rail transport, automobiles,                                                                                                                                                                                                                                                                                                                                                                                                                                                            (x)Biopharmaceuticals
                                                                           IT technology                                                                                                                                          and robotics       and agricultural            (vii) Powe                                                                                                                                                                                                                                                                                                                        (ix) New materials                                                                                                       And high-performance                                                                                                                     fields, and it is possible that the country
                                                                                                                                                                                                                                                    equipment                     equipment                                                                                                                                                                                                                                                                                                                                                                                                                                                  medical equipment
                                                                                                                                                                                                                                                                                                                                                                                                                                                                                                                                                                                                                                                                                                                                                                                                                                                                                     will make rapid advances in some of
Source: WIPO (2017) data
Remarks: The red square indicate the corresponding relationship with the priority fields of Made in                                                                                                                                                                                                                                                                                                                                                                                                                                                                                                                                                                                                                                                                                                                                                                                  those fields, as it did in the field of IT-
China 2025. In some cases, applicants choose the option of treating core technology as a “black box”                                                                                                                                                                                                                                                                                                                                                                                                                                                                                                                                                                                                                                                                                                                                                                                 related technology.
and refrain from filing a patent application concerning it. Therefore, it should be kept in mind that the
number of patent publications does not directly indicate the level of countries’ or companies’                                                                                                                                                                                                                                                                                                                                                                                                                                                                                                                                                                                                                                                                                                                                                                                                                                        14
technological capability.
Part 2 Chapter 3 Rapid change in the Chinese economy
 Massive number of highly skilled                                                                                                                                    Section 2 Advance of new industries

 human resources
      In China, the annual number of fresh university graduates who start a new
       business has been around 200,000 in recent years.
      Many Chinese students study in the United States, mainly in the STEM (science,
       technology, engineering, and mathematics) fields. Partly because of the Chinese
       government’s policy of encouraging students to return home after studying abroad,
       such students have become a major source of the supply of human resources for
       innovation and new business in China.
      It is significant to recognize anew the advance of new industries, the improvement
       of innovation capability, and the state of vigorous entrepreneurship activity in
       China and to make further efforts to vitalize Japanese domestic industries.
                                       The number of recent university graduates who
                                                                                                                                                      What is notable about China is not
(10 thousand graduates)              started new businesses and the business startup rate
25                                                                                                                                        3.5%        only the huge number of newly
                  The number of fresh university graduates                                                                    3.0%
                  who started a new business                                                                 2.9%
                                                                                                                                          3.0%
                                                                                                                                                      registered companies but also the
                  The fresh university graduate business
20
                  startup rate (right axis)                                                                                                           large number of new businesses
                                                                                         2.3%                                             2.5%
                                                                       2.0%
                                                                                                                                                      started by recent university graduates.
15
                                                      1.6%
                                                                                                                                          2.0%        Of the more than 7 million students
                                     1.5%
10        1.2%
                                                                                                              22              23
                                                                                                                                          1.5%        who graduate from university
                                                                         14
                                                                                           17
                                                                                                                                          1.0%
                                                                                                                                                      annually, around 200,000 start a new
 5
                  8
                                      10                 11                                                                                           business.
                                                                                                                                          0.5%

 0                                                                                                                                        0.0%
          2010                       2011              2012            2013              2014                2015            2016
Source: Reference materials compiled by the State Administration for Industry & Commerce of the People’s
Republic of China and the website of Dream Incubator
                                                                                                                                                      The massive supply of human
                                                                                                                                                      resources in the science and
     Number of students studying in the United States by nationality and major
                                                                                                                                                      engineering fields is considered to be
                                                                                                                             (Persons)
                               0           50,000        100,000      150,000        200,000       250,000         300,000     350,000                one reason for the large numbers of
                  2009/10                                                                                                                             patent applications, research papers
          China

                                                                                                                                                      and unicorn companies in China.
                  2015/16

                  2009/10                                                                                                                             Nearly half of Chinese students
          India

                  2015/16
                                                                                                                                                      studying in the United States major in
                                                                                                                                                      the STEM (science, technology,
                                                                      Engineering
                  2009/10
                                                                      Natural and life sciences                              STEM                     engineering and mathematics) fields.
          Japan

                                                                      Mathematics and CS             STEM
                  2015/16
                                                                      Medicine
                                                                      Business administration
                                                                                                                                                      In 2009/2010, 45.6% of Chinese
                                                                      Social sciences
                                                                      Education
                                                                                                                                                      students in the United States majored
                  2009/10
                                                                      Humanities
                                                                                                                                                      in the STEM fields, and the share was
          ROK

                                                                      English
                                                                      Arts and applied arts
                  2015/16
                                                                      Unspecified                                                                     42.7% in 2014/2015.
                                                                      Others (including agriculture and communication)

             Source: Institute of International Education (2017)

          Numbers of Chinese student who left China to study abroad and Chinese
                  students who returned to China after studying abroad                                                                                From 2000 onwards, the number of
                      (Number of students)
                  600,000                                                                                                           90%
                                                                                                                                                      Chinese students studying abroad
                                       The number of students who left China to study abroad
                                       The number of students who returned to China                                                 80%
                                                                                                                                                      continued to rise, but until 2008, the
                  500,000              Return rate (right axis)                                                                                       return rate among such students was
                                                                                                                                    70%
                                                                                                                                                      as low as less than 30%. However, the
                  400,000                                                                                                           60%
                                                                                                                                                      Chinese government announced a
                                                                                                                                    50%
                  300,000
                                                                                                                                                      series of measures to encourage
                                                                                                                                    40%
                                                                                                                                                      Chinese students studying abroad to
                  200,000                                                                                                           30%               return to China in order to secure
                                                                                                                                    20%               highly skilled human resources, and
                  100,000
                                                                                                                                    10%               as a result, the return rate has risen
                           0                                                                                                        0%
                                                                                                                                                      rapidly since then. The return rate in
                                   2000 2001 2002 2003 2004 2005 2006 2007 2008 2009 2010 2011 2012 2013 2014 2015 2016
                       Source: Meng (2018) “China’s Reform, Opening-Up and Policy for Foreign Study” (RIETI DP 18-J-016)
                                                                                                                                                      2013 was 85%.                          15
Part 2 Chapter 3 Rapid change in the Chinese economy
China’s expanding external trade                                                                                                       Section 3 External trade and investment

               Countries for which China is the largest import source country have rapidly
                increased. In 2017, China was the largest import source country for around 30%
                (57 countries) of all countries around the world.

               China is also the largest export destination country for 16% (30 countries) of all
                countries around the world, the second largest share after the United States.

      Map of countries color-coded by the largest import source country
                                   (2017)
                                                                                                                           In 2017, China was the largest import
                                                                                                                           source country for most countries
                                                                                                                           excluding Canada, Mexico, some
                                                                                                                           Central and South American countries,
                                                                                                                           and some European countries.

                                                                                                                           For Canada, Mexico and European
                                                                                             Other economies
                                                                                             Italy                         countries, the main industrialized
                                                                                             India
                                                                                             Germany                       country in their regions—the United
                                                                                             France
                                                                                             Russia                        States in the case of Canada and
                                                                                             China
                                                                                             U.S.
                                                                                                                           Mexico and Germany in the case of
                                                                                             U.K.
                                                                                             South Korea
                                                                                                                           European countries—are the largest
                                                                                                                           import source countries. However,
  Source: Prepared by METI based on IMF DOTS
                                                                                                                           China is the largest import source
                                                                                                                           country for the United States and the
  Map of countries color-coded by the largest export destination country                                                   second largest for Germany, after the
                                 (2017)
                                                                                                                           Netherlands.

                                                                                                                           In 2017, China replaced Japan as the
                                                                                                                           largest export destination country for
                                                                                                                           ASEAN and Australia. In addition,
                                                                                                                           China replaced the United States as
                                                                                                 Other economies           the largest export destination country
                                                                                                 U.S.
                                                                                                 China                     for many countries in Africa and
                                                                                                 Germany
                                                                                                 Italy
                                                                                                                           South America.
                                                                                                 India
                                                                                                 France
                                                                                                 Japan
                                                                                                 Russia
                                                                                                 U.K.
                                                                                                 Canada
      Source: Prepared by METI based on IMF DOTS                                                 South Korea

       Source: Prepared by METI based on IMF DOTS
                      Share in China’s exports by company type
      (%)
100
              Foreign
              companies                                                                                                    Looking at the share in China’s
 80           State-owned
              companies
                                                                                                                           exports by corporate ownership type,
            State-owned companies                                                                                          state-owned      companies’     share
                                         Foreign companies
 60                                                                                                                        declined, while foreign companies’
                                                                                      Private companies                    share continued to grow until the
 40                                                                                                                        middle of the 2000s. This is evidence
                                                                                                                           that foreign companies played a major
                                                                                                                           role in Chinese exports.
 20

                                                                                                                           However, as private export companies
  0                                                                                                                        have been growing, their share has
                                                                                                                           recently surpassed foreign companies’
       Remarks: Foreign companies include not only companies fully owned by foreign interests but also                     share.
       joint ventures between local and foreign companies.                                                                                                       16
       Source: The Chinese General Administration of Customs , CEI database, and Global Trade Atlas
Part 2 Chapter 3 Rapid change in the Chinese economy
Change in China’s main export industries                                                                                                                Section 3 External trade and investment

                Electrical and optical equipment have replaced textiles as the main driver of
                 Chinese exports.

                The growth in the shares of China’s electrical and optical equipment industries in
                 exports is higher on a value-added basis than on a customs-clearance basis. The
                 domestic value-added ratio in the industry's export is also growing, indicating
                 progress in a shift to local procurement of parts and to products with higher value
                 added

  Share of value in China’s exports comparison with VA and CC by industry

100%
                 5.8%                                       6.4%                  7.4%                7.8%                    5.4%
                                      10.9%
 90%             4.4%                                       6.1%                  8.0%                4.8%                    6.1%          Looking at a share of value in China’s
                                          5.1%
 80%                                                                                                                                        exports by and optical equipment
                26.6%                 16.9%
 70%                                                                                                                         35.4%
                                                                                                                                            have replaced textiles as the main
                                                           35.5%                  29.7%              35.9%
                                          8.1%                                                                                              driver of Chinese exports.
 60%             6.1%
                 8.0%                     9.5%
 50%                                                                              11.3%                                       9.8%          The growth in exports by China’s
                                                           10.7%                                     11.0%
                11.8%                 12.6%
 40%
                                                            7.9%                  9.8%                8.0%
                                                                                                                              8.4%          electrical and optical equipment
 30%                                                                                                                         12.6%
                                                                                                                                            industries is higher on a value-added
                                                           12.4%                  12.9%              12.3%
 20%            31.7%                 28.7%
                                                                                                                                            basis (VA) than on a customs-
                                                                                  16.5%                                      17.2%
                                                                                                                                            clearance basis (CC).
 10%                                                       16.9%                                     16.7%
 0%
            2000 customs         2000 value added       2011 customs        2011 value added      2014 customs         2014 value added
              clearance                                   clearance                                 clearance
         Foods, beverages, and tobacco                                          Textiles, leather, and footwear
         Lumber, paper pulp, and printing                                       Chemicals, and nonferrous metals
         Metal products                                                         Machinery and equipment
         Electrical machinery and optical equipment                             Transportation machinery
         Other manufacturing industries
 Remarks: Data from OECD TiVA was used with respect to value added in 2000 and 2011.
 Value added in 2014 was estimated based on WIOD
 Source: GTA, OECD TiVA, and WIOD

              Changes in domestic value added ratio in the export by industry
                                                                                                                                            On an industry-by-industry basis, the
                                                                        China
                                                                                                                                            share of the electrical and optical
                                                                 2000      2011       2014
                                                                                                                                            equipment industries in China was
                                                          Total for manufacturing industries
                                                                      80
                                                                                                                                            low at around 30% in 2000.
                                                                      75
                          Transportation machinery                    70                         Foods and tobacco
                                                                      65
                                                                                                                                            This is presumably because those
                                                                      60                                                                    industries were using a global value
                                                                      55
                                                                      50
                                                                                                                                            chain in their manufacturing activity,
                                                                      45                                                                    as shown by their imports of a large
       Electrical machinery and optical                               40
                  equipment
                                                                      35
                                                                                                                Textiles and footwear       volume of semiconductors and liquid
                                                                      30                                                                    crystal display panels from other
                                                                                                                                            countries.

                                                                                                                                            On the other hand, those industries’
                        General machinery                                                                Lumber and paper products
                                                                                                                                            share of the value added increased
                                                                                                                                            from the level in 2000 to around 50%
                                                                                                                                            in 2011 and 2014, indicating progress
                                Base metals and metal products                         Chemicals and ceramics
                                                                                                                                            in a shift to local procurement of parts
            Remarks: The figures for 2014 are provisional.                                                                                  and to products with higher value
            Source: OECD TiVA                                                                                                               added.
                                                                                                                                                                                             17
Trends in various countries with respect to                                                                              Part 2 Chapter 3 Rapid change in the Chinese economy
                                                                                                                                             Section 3 External trade and investment
trade with China
                  Between 1995 and 2016, China was the most frequent target of anti-dumping (AD) measures,
                   as AD measures were implemented against it in 866 cases. In recent years, the number of cases
                   in which AD measures were implemented has been trending upward. Emerging and developing
                   countries implemented anti-dumping measures against China in more cases than advanced
                   countries, such as the United States and European countries.
                  In addition to implementing AD measures against China, the United States considered and
                   implemented other measures with respect to trade with China based on Section 301 of the trade
                   act and other laws.
                  Europe has also implemented AD measures against China, and revised the AD regulation in
                   2017.
   Number of cases in which AD measures were implemented by exporting
            country (cumulative total between 1995 and 2016)
 (Cases)
1000                                                                                                                             Following the establishment of the
900        866
                                                                                                                                 WTO, China was the most frequent
                                                                                                                                 target of AD measures (866 cases)
800
                                                                                                                                 between 1995 and 2016, followed far
700                                                                                                                              behind by the Republic of Korea (239
600                                                                                                                              cases), Taiwan (191 cases), the
500
                                                                                                                                 United States (177 cases), and Japan
                                                                                                                                 (146 cases) in that order.
400

300
                       239                                                                                                       In recent years, the number of cases
                                  191
200                                             177
                                                      146        140
                                                                                                                                 of implementation of AD measures
                                                                               124       124          115
100
                                                                                                                 93              against China has increased across the
                                                                                                                                 world: the number was 61 cases in
  0
           China      Korea,    Taipei,     United    Japan    Thailand        India   Indonesia    Russian     Brazil           2015 and 44 cases in 2016, increasing
                    Republic of Chinese     States                                                 Federation
                                                                                                                                 steeply from 27 in 1995.
           1          2          3              4       5            6          7         8            9         10
Source: Prepared by METI based on WTO

       Source: Prepared by METI based on WTO

            Number of cases of implementation of AD measures against China
                (by region) (cumulative total between 1995 and 2016)

                                                                                                                                 On a region-by-region basis, ,
                                                                         13%
                                                                                                                                 emerging countries implemented AD
                                                                                                                                 measures against China in more cases
                                                                                                                                 than advanced countries did. Among
                                                                                                                                 advanced counties, the United States
                                                                                       10%
                                                                                                                                 implemented AD measures against
                                                                                                                                 China most frequently, followed by
                                                                                                                                 the EU.
                                                                                        10%

                                          67%

                   United States                                EU
                   Other Advanced Economies                     Emerging and Developing Economies
                             Source: Prepared by METI based on WTO

                                                                                                                                                                                18
Increasing China’s foreign direct                                                                                     Part 2 Chapter 3 Rapid change in the Chinese economy
                                                                                                                                           Section 3 External trade and investment
 investments
              Since the beginning of the 2010s, Chinese companies have become active in
               acquiring industrial and technology companies in advanced economies.

              The United States has strengthened regulation on foreign direct investment. For
               example, it has refused to approve acquisitions of U.S. companies by Chinese
               ones in some cases.

              As for EU, European Commission has proposed the establishment of a new
               screening framework concerning foreign direct investments in the region. At the
               national level as well, Germany and some other EU member countries are
               moving to strengthen their regulation.
         Changes in the number of Chinese companies’ cross-border M&As
                         (industrial and technology sectors)                                                                   The number of cross-border M&As
                                                                                                                               by Chinese companies increased 14-
 (Number of transactions)                                                                                                      fold, from 44 transactions in 2000 to
160
        Advanced countries                                                                                                     598 transactions in 2016. However, in
140                                                                                                                            2017, the number declined to 463
        Emerging and developing countries
120     Others                                                                                                                 transactions due to the Chinese
100                                                                                                                            government’s restrictions on capital
                                                                                                                               outflow.
 80

 60                                                                                                                            As a measure to enhance the
 40                                                                                                                            innovation capability of technologies
 20
                                                                                                                               and industries that it wants to develop
                                                                                                                               as priorities, the Chinese government
  0
      2000 2001 2002 2003 2004 2005 2006 2007 2008 2009 2010 2011 2012 2013 2014 2015 2016 2017
                                                                                                                               is actively promoting M&As as a
  Remarks 1: Acquired companies were classified by nationality into advanced countries, emerging and developing                national policy.
  countries, and others. The “advanced countries” are those in the IMF’s advanced country category excluding Hong
  Kong and Macau. “Others” are Hong Kong, Macau, the British Virgin Islands, the Cayman Islands, and Bermuda.
  Remarks 2: The industrial and high-tech sectors include software, semiconductors, electrical equipment, machinery,           In the industrial and high-tech sectors,
  and automobiles and auto parts.
  Source: Prepared by METI based on Thomson One (as of March 2018)
                                                                                                                               Chinese company M&A is mainly
                                                                                                                               targeted at countries in advanced
                                                                                                                               economies, mainly the United States
                                                                                                                               and the EU, rather than those in
                                                                                                                               emerging and developing countries.
                       Cases of prohibition of investment based on
                             recommendations from CFIUS
 Implementation
      year
                            President                                    Overview                                              With respect to foreign direct
                                                                                                                               investments in the United States, there
       2016                   Barack         Ordered the prohibition of the acquisition of
                              Obama          Aixtron, a German semiconductor company owning
                                                                                                                               has been an increasing number of
                                             assets in the United States, by Fujian Grand Chip                                 cases in which a corporate acquisition
                                             Investment Fund, a Chinese investment fund. The                                   by a Chinese company is reviewed by
                                             Congressional Research Service cited a reported                                   the Committee on Foreign Investment
                                             blocking of the transaction due to the possibility                                in the United States (CFIUS). In some
                                             that Aixtron’s overall technical body of knowledge                                cases, the president has issued an
                                             and experience could be applied to military use.
                                                                                                                               order prohibiting an acquisition.
        2017                  Donald         Ordered the prohibition of the acquisition of Lattice
                              Trump          Semiconductor, a U.S. semiconductor company, by                                   In Japan, too, the Foreign Exchange
                                             Canyon Bridge Fund, in which a company affiliated                                 and Foreign Trade Act was revised in
                                             with the Chinese government is investing. The
                                             reason was that, as Lattice is handling military-use
                                                                                                                               2017 to strengthen the control of
                                             devices used by the U.S. government, a transfer of                                foreign direct investment in Japan (the
                                             intellectual property from the company could pose                                 revised act was put into force on
                                             a national security threat.                                                       January 1, 2017).
 Source: Prepared based on materials published by the U.S. Government and JETRO                                                                                                 19
Taking advantage of China’s high growth                                                        Part 2 Chapter 3 Rapid change in the Chinese economy
                                                                                               Section 4 Business opportunities for Japanese companies

         The value of Japanese exports to China in 2017 was a record high 14.9 trillion
          yen. Exports of foods, consumer goods and industrial machinery (semiconductor-
          manufacturing equipment and machine tools) increased significantly.
         The value of cross-border EC purchases by Chinese consumers from Japan
          surpassed 1 trillion yen.

             Major product items for which Japanese exports
                 to China recorded high growth (2017)
                                                                                                    The value of Japanese exports to
 [Consumer goods]                                                                                   China reached a record high of around
                                                             (Unit: million dollars, %)
                                                     Value of
                                                                          Growth rate
                                                                                                    14.9 trillion yen in 2017, making
                                                     exports
  HS                    Items                                                                       China the second-largest export
                                                      2017       2017 alone 2014-2017
                                                                                                    destination country for Japan, after
      Beauty care products, and preparations
 3304
      for cosmetics
                                                         723.3              98           328        the United States, for which the value
 3305
      Preparations for shampoos and other
                                                         128.4              94           367        of exports from Japan was around
      haircare products
 3401 Soaps                                              199.2              77           296
                                                                                                    15.1 trillion yen. Exports to China
  3005 Sanitary cotton, gauze, and bandages               45.4              57           160        account for around 20% of overall
 9619 Baby diapers                                     1,220.8              26           121        Japanese exports.

 [Industrial machinery]                                                                             Among consumer goods, cosmetics,
                                                             (Unit: million dollars, %)             medical products, products related to
                                                     Value of
                                                                          Growth rate
  HS                    Items
                                                     exports                                        leisure, such as toys and travel-related
                                                      2017       2017 alone 2014-2017               goods, and baby goods recorded high
       Civil engineering machinery                                                                  export growth.
 8429                                            214       63.4     71.0
       (bulldozers)
       Machine tools (for laser
 8456
       processing)
                                                 245       60.9     45.6                            Among machinery, machine tools
 8477
       Rubber and plastics processing
                                                 903       48.4     52.4
                                                                                                    recorded significant export growth,
       machinery                                                                                    presumably reflecting investment for
       Semiconductor-manufacturing
 8486                                          6,552       43.5    118.1                            labor-saving   and     rationalization
       equipment
 8457 Machine tools (machining centers)        1,359       39.0       2.4                           purposes. In addition, reflecting an
 Remarks: 1. Product items whose growth rate was high or whose value                                increase in the number of internet
 was large in 2017 on an HS4 digit basis were selected.
          2. Product item names were simplified for the sake of ease of u                           users, semiconductor demand is
          3. Figures for 2014-2017 represent the total of the growth rates                          growing rapidly, resulting in a high
 Source: Global Trade Atlas
                                                                                                    value and high growth of exports of
                                                                                                    semiconductor-manufacturing
          Value of cross-border EC purchases by Chinese consumers                                   equipment.
                          from Japanese companies

  1,400 (Billion yen)
                                                                                 1,297.8

  1,200
                                                                1,036.6
  1,000
                                                                                                    In recent years, cross-border e-
                                          795.6
   800                                                                                              commerce (EC) sales from Japan to
                            606.4                                                                   China have expanded rapidly. In 2016,
   600
                                                                                                    the value of such sales surpassed the 1
             390.2
   400                                                                                              trillion yen mark and reached 1,036.6
   200
                                                                                                    billion yen, and in 2017, the value is
                                                                                                    estimated to have reached 1,297.8
     0
              2013          2014              2015               2016             2017
                                                                                                    billion yen (an increase of 25.2%
   Source: E-Commerce Market Survey (METI)                                                          from the previous year).

                                                                                                                                                    20
You can also read