Extended Cost-Effectiveness of Water Supply Options: Case Study of the Total Water Cycle Management Plan for Moreton Bay Regional Council - Murray ...
←
→
Page content transcription
If your browser does not render page correctly, please read the page content below
Extended Cost-Effectiveness of Water
Supply Options: Case Study of the
Total Water Cycle Management Plan
for Moreton Bay Regional Council

Murray R. Hall

October 2012

   Urban Water Security Research Alliance
                 Technical Report No. 88
Urban Water Security Research Alliance Technical Report ISSN 1836-5566 (Online)
Urban Water Security Research Alliance Technical Report ISSN 1836-5558 (Print)

The Urban Water Security Research Alliance (UWSRA) is a $50 million partnership over five years between the
Queensland Government, CSIRO’s Water for a Healthy Country Flagship, Griffith University and The
University of Queensland. The Alliance has been formed to address South East Queensland's emerging urban
water issues with a focus on water security and recycling. The program will bring new research capacity to South
East Queensland tailored to tackling existing and anticipated future issues to inform the implementation of the
Water Strategy.

For more information about the:
   UWSRA - visit http://www.urbanwateralliance.org.au/
   Queensland Government - visit http://www.qld.gov.au/
   Water for a Healthy Country Flagship - visit www.csiro.au/org/HealthyCountry.html
   The University of Queensland - visit http://www.uq.edu.au/
   Griffith University - visit http://www.griffith.edu.au/

Enquiries should be addressed to:

The Urban Water Security Research Alliance                   Project Leader – Shiroma Maheepala
PO Box 15087                                                 CSIRO Land and Water
CITY EAST QLD 4002                                           HIGHETT VIC 3190

Ph: 07-3247 3005                                             Ph: 03-9252 6072
Email: Sharon.Wakem@qwc.qld.gov.au                           Email: Shiroma.Maheepala@csiro.au

Authors: CSIRO
Hall, M.R. (2012). Extended Cost-Effectiveness of Water Supply Options: Case Study of the Total Water Cycle
Management Plan for Moreton Bay Regional Council. Urban Water Security Research Alliance Technical
Report No. 88.

Copyright

© 2012 CSIRO To the extent permitted by law, all rights are reserved and no part of this publication covered by
copyright may be reproduced or copied in any form or by any means except with the written permission of
CSIRO.

Disclaimer

The partners in the UWSRA advise that the information contained in this publication comprises general
statements based on scientific research and does not warrant or represent the accuracy, currency and
completeness of any information or material in this publication. The reader is advised and needs to be aware that
such information may be incomplete or unable to be used in any specific situation. No action shall be made in
reliance on that information without seeking prior expert professional, scientific and technical advice. To the
extent permitted by law, UWSRA (including its Partner’s employees and consultants) excludes all liability to
any person for any consequences, including but not limited to all losses, damages, costs, expenses and any other
compensation, arising directly or indirectly from using this publication (in part or in whole) and any information
or material contained in it.

Cover Photograph:

Description: Subtropical River
Photographer: Murray R. Hall
© CSIRO
ACKNOWLEDGEMENTS
This research was undertaken as part of the South East Queensland Urban Water Security Research
Alliance, a scientific collaboration between the Queensland Government, CSIRO, The University of
Queensland and Griffith University.

Particular thanks go to Lavanya Susarla, Moreton Bay Regional Council as well as Nicole Ramilo,
BMT WBM for access to data and support of the project.

Extended Cost-Effectiveness of Water Supply Options: Case Study of the Total Water Cycle Management Plan
for Moreton Bay Regional Council                                                                           Page i
FOREWORD
Water is fundamental to our quality of life, to economic growth and to the environment. With its
booming economy and growing population, Australia's South East Queensland (SEQ) region faces
increasing pressure on its water resources. These pressures are compounded by the impact of climate
variability and accelerating climate change.
The Urban Water Security Research Alliance, through targeted, multidisciplinary research initiatives,
has been formed to address the region’s emerging urban water issues.
As the largest regionally focused urban water research program in Australia, the Alliance is focused on
water security and recycling, but will align research where appropriate with other water research
programs such as those of other SEQ water agencies, CSIRO’s Water for a Healthy Country National
Research Flagship, Water Quality Research Australia, eWater CRC and the Water Services
Association of Australia (WSAA).
The Alliance is a partnership between the Queensland Government, CSIRO’s Water for a Healthy
Country National Research Flagship, The University of Queensland and Griffith University. It brings
new research capacity to SEQ, tailored to tackling existing and anticipated future risks, assumptions
and uncertainties facing water supply strategy. It is a $50 million partnership over five years.
Alliance research is examining fundamental issues necessary to deliver the region's water needs,
including:
ensuring the reliability and safety of recycled water systems.
advising on infrastructure and technology for the recycling of wastewater and stormwater.
building scientific knowledge into the management of health and safety risks in the water supply
system.
increasing community confidence in the future of water supply.
This report is part of a series summarising the output from the Urban Water Security Research
Alliance. All reports and additional information about the Alliance can be found at
http://www.urbanwateralliance.org.au/about.html.
Chris Davis
Chair, Urban Water Security Research Alliance
Extended Cost-Effectiveness of Water Supply Options: Case Study of the Total Water Cycle Management Plan
for Moreton Bay Regional Council Page ii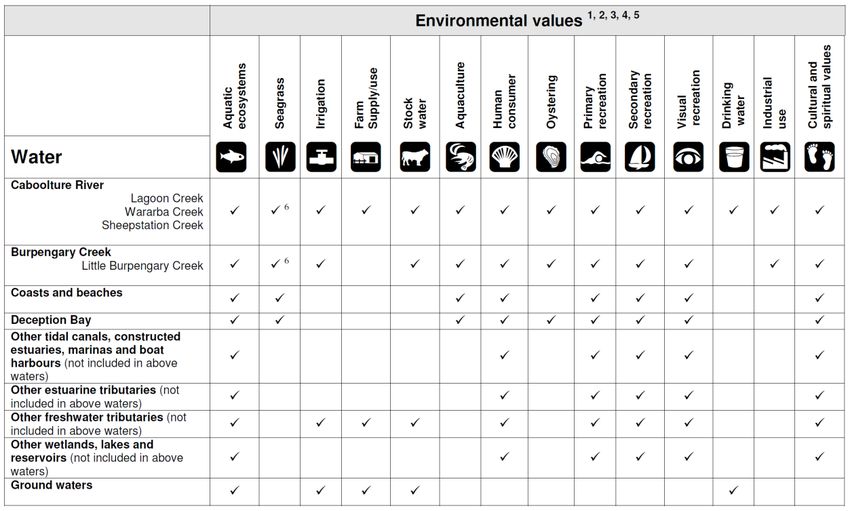
CONTENTS
Acknowledgements .............................................................................................................. i
Foreword .............................................................................................................................. ii
Executive Summary ............................................................................................................. 1
1.      Introduction................................................................................................................. 5
2.      Case Study Description.............................................................................................. 5
3.      Method......................................................................................................................... 7
        3.1.     Extended Cost-Effectiveness Analysis ................................................................................ 7
        3.2.     Pollution Abatement Costs .................................................................................................. 8
        3.3.     Multiple Objectives ............................................................................................................... 8
                 3.3.1.         Moreton Bay Bulk Water Price.......................................................................................... 9
                 3.3.2.         Agricultural Water Price .................................................................................................. 10

4.      Defining the Objective for Pollution Reduction ...................................................... 11
        4.1.     Load Reductions to Achieve Waterway Health Objectives................................................ 11
                 4.1.1.         Current and Future Pollution Loads ................................................................................ 12
                 4.1.2.         ‘No Worsening’ Load Reduction Target .......................................................................... 13
        4.2.     Benefit for Achieving a Waterway Health Objective .......................................................... 15
5.      Marginal Abatement Cost Curves ............................................................................ 18
6.      Extended Cost-Effectiveness Analysis of Water Supply Options ......................... 20
7.      Sensitivity Analysis .................................................................................................. 24
8.      Discussion ................................................................................................................ 25
Appendix 1: Pollution Status ........................................................................................... 26
Appendix 2: TWCMP and Pollution Abatement Costs.................................................... 30
        Future Development meets Queensland Development Code Requirements .............................. 30
        Water Sensitive Urban Design meets Best Practice Targets ...................................................... 31
        Increased Enforcement and Implementation of Erosion and Sediment Control on
               Development Sites ............................................................................................................. 33
        Riparian Revegetation for 3rd and 4th Order Streams ................................................................ 33
        Rural BMP – Stock Exclusion and Revegetation of 1st and 2nd Order Streams ........................ 34
        Buffer Strips ................................................................................................................................. 34
        Recycled Water to Agricultural Users .......................................................................................... 35
        Waste water reuse for dual reticulation and Public Open Space irrigation .................................. 35
        Recycled Water to Urban Users Option 2: Public Open Space Irrigation only (Class A) ............ 38
        Water Sensitive Urban Design Retrofit to Existing Areas ............................................................ 40
        Water Sensitive Urban Design to Achieve No Worsening of Pollutant Loads ............................. 41
        Stormwater Harvesting ................................................................................................................. 42
        Purified Recycled Water............................................................................................................... 42
        Retrofit of Rainwater Tanks in Existing Urban Areas ................................................................... 43
Appendix 3: Distance to Target Approach for Allocating of Costs between
    Pollutants for Each Abatement Option.................................................................... 44
References ......................................................................................................................... 46

Extended Cost-Effectiveness of Water Supply Options: Case Study of the Total Water Cycle Management Plan
for Moreton Bay Regional Council                                                                                                                    Page iii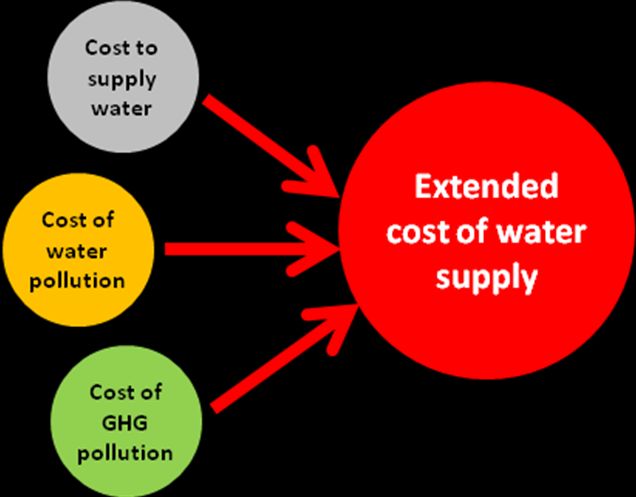
LIST OF FIGURES
Figure 1. Total Phosphorus Marginal Abatement Cost Curve for ‘no worsening’ of waterways in the
Caboolture catchment. ...................................................................................................................... 1
Figure 2. Total Nitrogen abatement cost and benefit for 'no worsening' load reduction target. ........................ 2
Figure 3. Total Suspended Solids abatement cost and benefit for 'no worsening' load reduction target. ......... 2
Figure 4. Comparison of Project Cost and Extended Cost-effectiveness for a unit of water supply for
Caboolture and CIGA Catchment Options. ........................................................................................ 3
Figure 5. Contribution of water supply and pollution costs to the extended cost-effectiveness of water
supply options. .................................................................................................................................. 4
Figure 6. Case study region illustrating catchment location and features including the location of the
Caboolture Identified Growth Area (BMT-WBM 2012)....................................................................... 5
Figure 7. Cost components considered for the cost-effectiveness of water supply options. ............................. 7
Figure 8. Options evaluation with costs extended for pollution. ........................................................................ 8
Figure 9. Assumed value of water based upon the QWC bulk water price path for Moreton Bay. ................. 10
Figure 10. Benefit of avoiding decline and achieving Water Quality Objectives in waterways of Moreton
Bay Regional Council. ..................................................................................................................... 16
Figure 11. Total phosphorus abatement cost and benefit for 'no worsening' load reduction target. ................. 18
Figure 12. Total nitrogen abatement cost and benefit for 'no worsening' load reduction target. ....................... 19
Figure 13. Total suspended solids abatement cost and benefit for 'no worsening' load reduction target. ........ 19
Figure 14. Comparison of project cost and extended cost-effectiveness for a unit of water supply for
Caboolture and CIGA Catchment options. ...................................................................................... 21
Figure 15. Caboolture and CIGA water supply options sorted by water supply cost. ....................................... 21
Figure 16. Contribution of water supply and pollution costs to the extended cost-effectiveness of
options. ............................................................................................................................................ 23
Figure 17. Sensitivity of extended cost-effectiveness to a doubling of pollutant costs. ..................................... 24
Figure 18. Caboolture River and tributaries with water types and high ecological value areas (DERM
2010). .............................................................................................................................................. 27
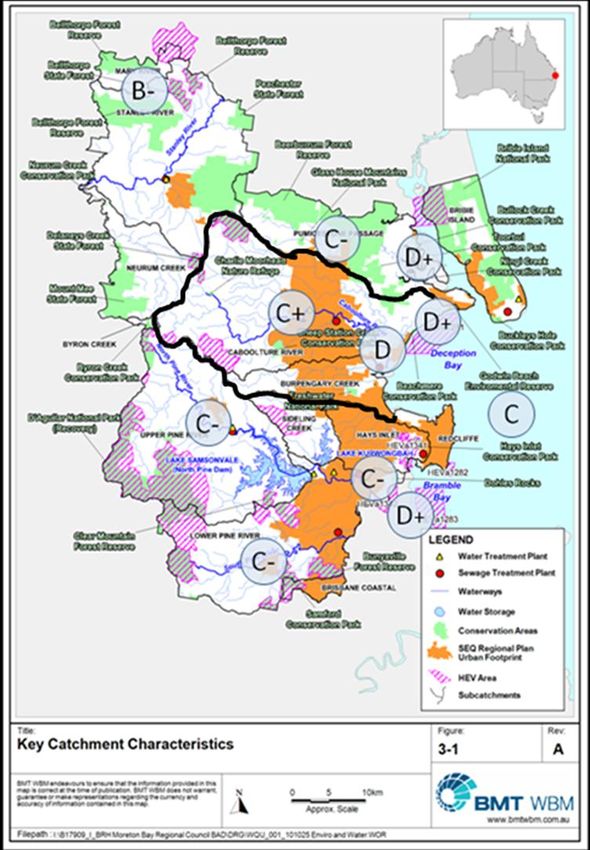
Figure 19. Key catchment characteristics and waterway health for Moreton Bay Regional Council
catchments. ..................................................................................................................................... 29
Extended Cost-Effectiveness of Water Supply Options: Case Study of the Total Water Cycle Management Plan
for Moreton Bay Regional Council Page iv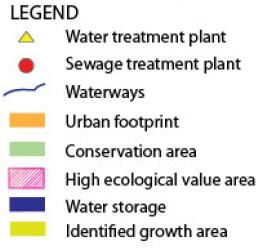
LIST OF TABLES
Table 1. Summary of material flows and cost for water supply options for Caboolture and CIGA. .................. 6
Table 2. Water quality allocation for cost and benefit of water pollution. ......................................................... 9
Table 3. Water quality allocation for cost and benefit of water pollution for recycled water. ............................ 9
Table 4. Queensland Water Commission Bulk Water Price Path for Moreton Bay Regional Council. ........... 10
Table 5. Current (2010) stormwater annual pollution loads in MBRC catchments. ....................................... 12
Table 6. Current (2010) STP annual pollution loads in MBRC catchments. .................................................. 12
Table 7. Future (2030) stormwater annual pollution loads in MBRC catchments. ......................................... 13
Table 8. Future (2030) STP annual pollution loads in MBRC catchments. .................................................... 13
Table 9. Projected increase in stormwater annual load for MBRC catchments for 2010 compared to
2031. ............................................................................................................................................... 14
Table 10. Projected increase in Sewage Treatment Plant annual load for MBRC catchments for 2010
compared to 2031............................................................................................................................ 14
Table 11. Summary of the projected increase in annual average load for Moreton Bay Regional
Council Catchments for 2010 compared with 2031. ........................................................................ 15
Table 12. Abatement Required over the Analysis Period to Achieve 'No Worsening' of Pollutant Loads. ....... 15
Table 13. The approximate marginal benefit in present value per tonne of pollution abated for the
period 2010-2031 to achieve ‘no worsening’ of waterways. ............................................................ 17
Table 14. Percentage reduction of water supply costs to water supply and pollutant costs. ........................... 22
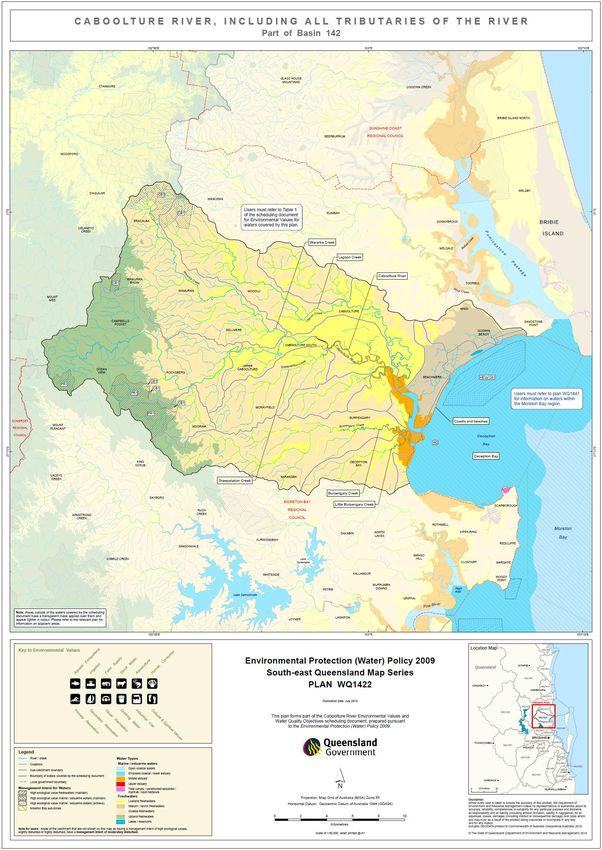
Table 15. Environmental Values for the Caboolture River and its tributaries (DERM 2010). ........................... 26
Table 16. Nutrient and sediment Water Quality Objectives to protect aquatic ecosystem environmental
value (DERM 2010 – Tab 2). ........................................................................................................... 28
Table 17. Allocation of rainwater tank Present Value to water pollutants. ....................................................... 30
Table 18. Rainwater tank pollutant load reduction and abatement cost-effectiveness. ................................... 31
Table 19. Pollutant load reduction. .................................................................................................................. 31
Table 20. Allocation of WSUD-bioretention present value to water pollutants. ................................................ 32
Table 21. WSUD-bioretention pollutant load reduction and abatement cost-effectiveness. ............................ 32
Table 22. Development site sediment load reduction and abatement cost-effectiveness. .............................. 33
Table 23. Riparian revegetation of 3rd and 4th order streams sediment load reduction and abatement
cost-effectiveness. ........................................................................................................................... 33
st nd
Table 24. Stock exclusion and revegetation of 1 and 2 order streams sediment load reduction and
abatement cost-effectiveness. ......................................................................................................... 34
Table 25. Allocation of buffer strip present value to water pollutants. .............................................................. 34
Table 26. Buffer strip pollutant load reduction and abatement cost-effectiveness. .......................................... 34
Table 27. Allocation of recycled water to agricultural users present value to water pollutants. ....................... 35
Table 28. Recycled water to agricultural users pollutant load reduction and abatement cost-
effectiveness. .................................................................................................................................. 35
Table 29. Allocation of present value for dual reticulation and public open space irrigation to water
pollutants. ........................................................................................................................................ 36
Table 30. Dual reticulation and public open space irrigation pollutant load reduction and abatement
cost-effectiveness. ........................................................................................................................... 37
Table 31. Allocation of present value for public open space irrigation only to water pollutants. ...................... 38
Table 32. Public open space irrigation only pollutant load reduction and abatement cost-effectiveness......... 39
Table 33. Pollutant load reduction. .................................................................................................................. 40
Table 34. Allocation of present value for WSUD retrofit to water pollutants. ................................................... 40
Table 35. WSUD retrofit load reduction and abatement cost-effectiveness. ................................................... 40
Table 36. Pollutant load reduction. .................................................................................................................. 41
Table 37. Allocation of present value for ‘WSUD to achieve no worsening of pollutant loads’. ....................... 41
Table 38. WSUD to achieve no worsening of pollutant loads’ load reduction and abatement cost-
effectiveness. .................................................................................................................................. 41
Table 39. Allocation of present value for stormwater harvesting to water pollutants. ...................................... 42
Table 40. Stormwater harvesting pollutant load reduction and abatement cost-effectiveness. ....................... 42
Table 41. Allocation of present value for purified recycled water to water pollutants....................................... 42
Table 42. Purified recycled water pollutant load reduction and abatement cost-effectiveness. ....................... 43
Table 43. Allocation of present value for retrofit of rainwater tank to water pollutants. .................................... 43
Table 44. Retrofit of rainwater tanks pollutant load reduction and batement cost-effectiveness. .................... 43
Extended Cost-Effectiveness of Water Supply Options: Case Study of the Total Water Cycle Management Plan
for Moreton Bay Regional Council Page vEXECUTIVE SUMMARY
This report demonstrates the use of extended cost-effectiveness analysis for evaluation of water supply
options. The case study has two parts – a section that defines pollutant costs and benefits and a section
that applies the pollutant costs to water supply options evaluation. Two catchments within the Draft
Total Water Cycle Management Plan (TWCMP) for Moreton Bay Regional Council (MBRC) were
used as a case study.
The use of extended cost-effectiveness analysis can simplify triple bottom line assessments of water
supply options and is particularly applicable to catchments with receiving water constraints. The
extended cost includes the cost of water supply and the cost of abatement of pollution from the water
supply option. The monetisation of pollutant flows allows water supply and environmental costs to be
added together as an alternative to weighting processes in Multi Criteria Analysis.
‘Willingness to pay’ studies in South East Queensland (SEQ) suggested that water quality issues
capture most of the benefits associated with resource management. The benefit of avoiding decline in
waterway health in the Caboolture catchment over the next 20 years was about $330 million dollars in
present value. Achieving legislated water quality objectives would provide an additional benefit of
$138 million in present value.
Marginal Abatement Cost Curves were developed for total phosphorus (TP), total nitrogen (TN) and
total suspended solids (TSS). The following curves illustrate the average abatement cost and benefit
per tonne of pollutant to meet the ‘no worsening’ load target over the 20-year planning period. In
summary, the weighted average cost of abatement was $334 000 per tonne, $40 000 per tonne and
$213 per tonne for TP, TN and TSS, respectively. A cost of $23 per tonne was assumed for
greenhouse gas (GHG) emissions.
800000 Abatement benefit
$344 000/tonne
Abatement Cost ($/tonne)
600000 Average abatement
cost $334 000/tonne
400000
200000
0
50 100 150 200 250 300 350 Pollution Abated
-200000 (tonnes)
Rural BMP Purified Recycled WSUD Retrofit to WSUD to Best
- Buffer strips Water Best Practice Practice Targets
-400000
-600000 Load Reduction
Recycled water
POS - South target 369 tonne
-800000 Caboolture STP
-1000000
-1200000
Recycled water POS
- New STP CIGA
-1400000
Figure 1. Total Phosphorus Marginal Abatement Cost Curve for ‘no worsening’ of waterways in the
Caboolture catchment.
Extended Cost-Effectiveness of Water Supply Options: Case Study of the Total Water Cycle Management Plan
for Moreton Bay Regional Council Page 1Abatement Cost ($/tonne)
80000
60000
Average cost of
abatement
$40 000/tonne
40000
Benefit of abatement
$25000/tonne
20000
0
Pollution Abated
Rural Recycled water to Purified Water Sensitive Urban (tonnes)
BMP - Urban Users POS Recycled Design meets Best
-20000 Buffer Only - Redcliffe STP Water Practice Targets
strips
Load reduction
-40000 target 2002 tonne
Recycled water to Urban Users
POS Only - South Caboolture
STP
-60000
Recycled water to Urban Users POS Only -
New STP Caboolture Identified Growth Area
-80000 (CIGA)
Figure 2. Total Nitrogen abatement cost and benefit for 'no worsening' load reduction target.
Average benefit of
abatement
Abatement Cost ($/tonne)
$1794/tonne
50
45
40
35 Average cost of
30 abatement
$213/tonne
25
20
15
10
5
0
Pollution Abated
Rural BMP - Rural BMP - Riparian
(tonnes)
Erosion & sediment Buffer strips Load reduction
Revegetation of 3rd &
control on target 85 126 tonne
4th order streams
development sites
Figure 3. Total Suspended Solids abatement cost and benefit for 'no worsening' load reduction target.
The abatement of TSS had a very high benefit to cost ratio for achieving the ‘no worsening target’.
This suggests it should be a priority for water quality expenditure and that additional abatement
beyond ‘no worsening’ should be considered because the marginal benefit is likely to be greater than
the marginal cost. This also suggests that it may be more cost-effective to ‘trade’ pollution abatement
of nutrients for sediment abatement to achieve water quality improvements.
Extended Cost-Effectiveness of Water Supply Options: Case Study of the Total Water Cycle Management Plan
for Moreton Bay Regional Council Page 2The following results show a comparison of water supply and water supply plus pollution costs. Water supply options such as water recycling, stormwater harvesting and rainwater tanks reduced water pollution flows which resulted in cost savings for abatement. The ranking of options did not change when considering pollutant costs. However, the sensitivity analysis suggested that upper range value for pollutant abatement costs could potentially change the ranking of options such as recycled water compared to the bulk water supply. Figure 4. Comparison of Project Cost and Extended Cost-effectiveness for a unit of water supply for Caboolture and CIGA Catchment Options. The following figure provides a comparison of the cost components for the extended cost of water supply options. Nutrient abatement for water supply options such as recycling had the largest effect on the cost-effectiveness. Water supply options such as stormwater harvesting also had a small cost saving for sediment abatement while grid water had a very small additional cost for GHG pollution. The effect of various pollutants on the cost-effectiveness was largely a function of the abatement cost. For example, the abatement cost per tonne of TP was over ten thousand times higher than the cost for abating carbon dioxide. Extended Cost-Effectiveness of Water Supply Options: Case Study of the Total Water Cycle Management Plan for Moreton Bay Regional Council Page 3
Figure 5.    Contribution of water supply and pollution costs to the extended cost-effectiveness of water
supply options.

Some caution is required when applying the data in this report to another TWCMP. The cost of
pollution depends upon the range of abatement options available in the catchment. The abatement
options in the case study were based upon the draft TWCMP for MBRC and did not include point
source or agricultural abatement of nutrients. In addition, catchment characteristics such as slope can
affect cost and performance of abatement options and need to be considered for each catchment.

The pooling of resources from a number of TWCMPs may provide the most cost-effective approach to
improving water quality in the region. Willingness to pay studies suggest that residents in one part of
SEQ are willing to pay for improvement in other parts of SEQ if it is more cost-effective. This would
require setting priorities for improvement across the region and may link with policies such as Water
Quality Trading. However, this requires cooperation and coordination across council areas and linking
TWCMPs rather than consider them in isolation.

Extended Cost-Effectiveness of Water Supply Options: Case Study of the Total Water Cycle Management Plan
for Moreton Bay Regional Council                                                                           Page 4
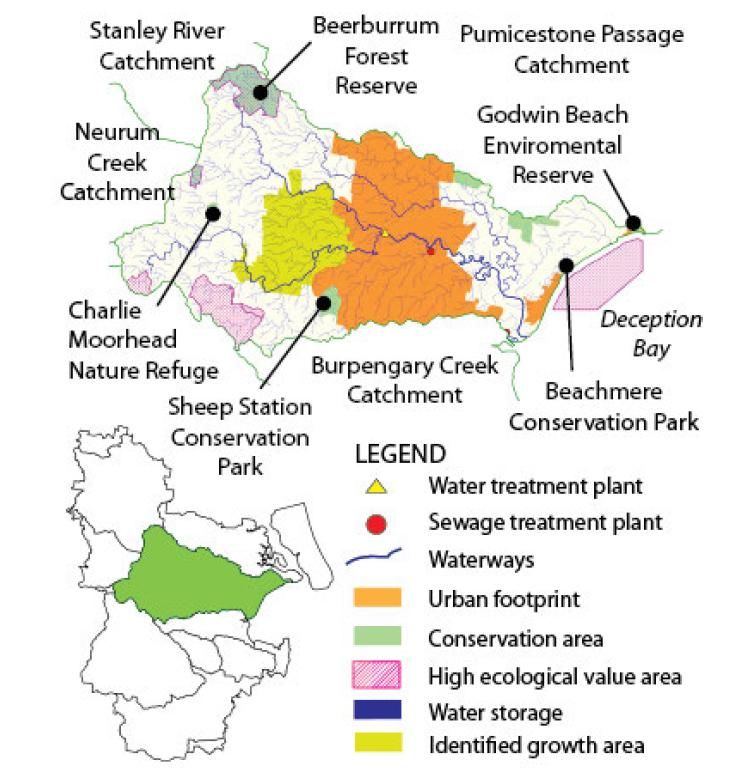
1.     INTRODUCTION
This report provides an example of applying pollution abatement costs to Total Water Cycle
Management (TWCM) planning, and aims to support water supply options evaluation by including
pollutant costs in cost-effectiveness analysis. A case study for Moreton Bay Regional Council
(MBRC) Total Water Cycle Management Plan (TWCMP) was used as a demonstration. The case
study has two parts – a section that defines pollutant costs for MBRC and a section that applies the
pollutant costs to options evaluation. The method draws upon the companion report Cost of Pollution:
Supporting Cost-effective Options Evaluation and Pollution Reduction (Hall 2012).

The current Draft TWCMP for MBRC uses Multi Criteria Analysis (MCA) for options evaluation
(BMT-WBM 2010; BMT-WBM 2012). Many of the environmental, social and economic criteria in
the MCA were related to water quality. In addition, a ‘willingness to pay’ study performed in the
region found that most benefits for natural resource management were related to water quality (Binney
2010). This suggests that capturing water quality costs and benefits in dollars may provide an
approximation of the broader scope of externalities. The dollar value for externalities can then be
added directly to capital and operating costs for supplying water and options ranked by cost-
effectiveness.

2.     CASE STUDY DESCRIPTION
Moreton Bay Regional Council selected a case study region of the Caboolture Catchment and the
Caboolture Identified Growth Area (CIGA) to demonstrate the use of Extended Cost-Effectiveness
Analysis for water supply options evaluation. The CIGA is part of the Caboolture Catchment and
represents a potential development pressure on the catchment over the coming decades. Figure 6
illustrates the location of the catchment on the east coast of Australia as well as important catchment
features.

Figure 6.    Case study region illustrating catchment location and features including the location of the
Caboolture Identified Growth Area (BMT-WBM 2012).

Extended Cost-Effectiveness of Water Supply Options: Case Study of the Total Water Cycle Management Plan
for Moreton Bay Regional Council                                                                           Page 5
The water supply options were defined by the Draft TWCMP (BMT-WBM 2012). Table 1 provides a
summary of the water quantities, pollutant flows and indicative costs to supply water in Net Present
Value. These values were used to define the options and provide input to extended cost-effectiveness
calculations. The Draft TWCMP also considered a number of pollution abatement options as
‘solutions’ as part of each ‘management scenario’. These abatement options were considered
separately using marginal abatement cost curves for the Caboolture catchment. The average cost of
abatement in the catchment was then used for calculating pollutant abatement costs for ‘solutions’ that
supplied water. For further details of the case study region, refer to the Draft TWCMP (BMT-WBM
2012).

Table 1.         Summary of material flows and cost for water supply options for Caboolture and CIGA.

Catchment      Management       Solution ^                              Potable     Water Pollutant Flow ^           GHG          Indicative
               Scenario                                                 Water       (kg/yr)                          Pollutant    Cost to
                                                                        Saving                                       Flow *       Supply
                                                                        (ML/yr)                                      (t/yr)       Water
                                                                                                                                  ($M 2011
                                                                                                                                  PV) *
                                                                                      TSS         TN         TP

Caboolture     Scenario 1       Future Development meets QDC                869       17,370      1,581      112         1,737         49.47
                                Alternative Water Supply Target
                                Grid water                               13,635                                         21,680          5.96

               Scenario 2       Future Development meets QDC                869       17,370      1,581      112         1,737         49.47
                                Alternative Water Supply Target
                                Recycled Water Supplied to                2,920        5,840      7,300      876         2,044         14.90
                                Agricultural Users
                                Grid water                               13,635                                         21,680          5.96

               Scenario 3       Future Development meets QDC                433        8,665        788        56          866         24.68
                                Alternative Water Supply Target
                                Recycled Water Supplied to Urban          2,297        5,932      7,689      890         2,076         81.62
                                Users
                                Stormwater Harvesting for Non-              184       36,161        436        81          713         27.97
                                Potable Use
                                Grid water                               10,641                                         16,920          4.65

CIGA           Scenario 1       Future Development meets QDC              1,064       21,280      1,936      137         2,128         28.34
                                Alternative Water Supply Target
                                using Rainwater Tanks
                                Recycled Water for POS                      671        3,815      4,769      572         1,335         28.63

                                Grid water                                5,840                                          9,285          2.55

               Scenario 2       Recycled Water for Dual                   1,688        9,066    11,333     1,360         2,047         37.02
                                Reticulation & POS
               Scenario 3       Stormwater Harvesting Dual                1,232     326,310       3,933      733         1,297         68.90
                                Reticulation & POS
                                PRW to NPD                                3,626        7,751      4,832      934         5,802         81.22

                                Grid water                                2,717                                          4,320          1.19

* Grid water Greenhouse Gas emissions assume 1.59 MWh/ML and 1 tC02e/MWh (Hall, West et al. 2009). The indicative cost to supply water
was based on the bulk water price path considered in the method. Marginal bulk water supplies are likely to be from desalination and this was
considered in the Sensitivity Analysis.
^ Queensland Development Code (QDC), Public Open Space (POS), Potable Recycled Water (PRW), Non Potable Demand (NPD), Mega Litre
(ML), TSS (Total Suspended Solids), Total Nitrogen (TN), Total Phosphorus (TP), Present Value (PV).

Extended Cost-Effectiveness of Water Supply Options: Case Study of the Total Water Cycle Management Plan
for Moreton Bay Regional Council                                                                                                     Page 6
3. METHOD
3.1. Extended Cost-Effectiveness Analysis
Cost-Effectiveness Analysis (CEA) is an established economic method for evaluating the cost of an
option to achieve an objective (Pearce, Atkinson et al. 2006). The application of cost-effectiveness
analysis in assessing water quality interventions in SEQ has also recently been reviewed (Alam, Rolfe
et al. 2008; Hall 2012). Cost-effectiveness analysis can be used for evaluating both pollution
abatement options as well as water supply options. In this case, pollution abatement costs were
reviewed to extend the cost-effectiveness analysis of water supply options. This method was noted as
being suitable for capturing sustainability issues of sub regional TWCMPs for water supply
conservation and water supply augmentation (Hurikino, Lutton et al. 2010, p12; Fane, Blackburn et al.
2010, p12). This method also supports National Water Initiative pricing principles for including full
cost recovery, including recovery of environmental externalities (DEWHA 2010). This study
considered pollution abatement costs for greenhouse gases, nutrients and sediments to extend the cost-
effectiveness analysis. Figure 7 illustrates the cost components considered for the supply of water.
Figure 7. Cost components considered for the cost-effectiveness of water supply options.
Equation 1 captures the algebraic relationship of the cost components for calculating the extended
cost-effectiveness. Note that the capital and operating costs as well as the flow of pollutants relate to
the water supply option. The value of the pollution was defined by pollution mitigation costs for
achieving a particular pollution reduction target.
Equation 1
Where
Y = extended cost-effectiveness
Cp = capital cost per unit of water supplied
Op = operating cost in present value per unit of water supplied
Pj = pollution emitted by the water supply option per unit of water supplied
Wj = unit value for pollution abatement for a defined reduction target
j = first pollutant considered
m = last pollutant considered
Extended Cost-Effectiveness of Water Supply Options: Case Study of the Total Water Cycle Management Plan
for Moreton Bay Regional Council Page 7Figure 8 illustrates the comparison of two water supply projects using the extended cost-effectiveness.
The capital and operating costs for supplying water are shown in grey. The costs of abating pollution
from the water supply project is added for Greenhouse Gas emissions (GHG), Total Nitrogen (TN),
Total Phosphorus (TP) and Total Suspended Solids (TSS). The example also illustrates that the most
cost-effective option may change depending on the scope of costs considered. Water supply Project A
appears more expensive if only the capital and operating costs for supply water are considered.
However, Project A appears less expensive when pollution costs are included.
Project A
$Capital $Operating $GHG $TN $TSS $TP
Project B
$Capital $Operating $GHG $TN $TSS $TP
Cost ($) B A A B
Water Quantity Costs Water Quantity AND Quality
B < A for A < B for
Figure 8. Options evaluation with costs extended for pollution.
Pollutant costs were developed using pollutant targets and Marginal Abatement Cost Curves (Hall
2012). The case study drew upon pollution costs and quantities calculated for the TWCMP for MBRC
(BMT-WBM 2010; BMT-WBM 2011; BMT-WBM 2012).
3.2. Pollution Abatement Costs
The following three steps provide a summary of the method used to calculate pollution costs and
draws upon the National Academy of Science process for designing stormwater control measures
(SCM) on a catchment (watershed) scale (NAS 2009 – pp422-423).
Pollution status. Consideration of current catchment ecosystem health, current pollutant loads, future
pollutant loads and sustainable pollutant load targets.
Mitigation options. Mitigation options available and approximate cost-effectiveness and load
reduction potential for the catchment.
Value of pollution and cost-effective strategy. Development of a cost curve and illustrating the
relationship of pollutant value to sustainable load targets and cost-effective options to achieve targets.
The approach was different to the Draft TWCMP, where abatement options were selected and
modelled on a sub-catchment basis to achieve Water Quality Objectives in each sub catchment.
Detailed calculations for steps 1 and 2 for the pollution status and the mitigation options are provided
in the Appendices. This information was used to construct the Marginal Abatement Cost Curves with
the following methodological considerations.
3.3. Multiple Objectives
Cost-effectiveness analysis typically focusses on achieving one objective and does not seek to account
for other benefits. This can create a methodological problem when there is more than one objective
(Jones-Lee 2003; Pearce, Atkinson et al. 2006). This problem was addressed for abatement options
that reduce more than one pollutant by considering a common metric of ‘water quality’ and by
Extended Cost-Effectiveness of Water Supply Options: Case Study of the Total Water Cycle Management Plan
for Moreton Bay Regional Council Page 8accounting for other benefits as ‘avoided costs’. A water quality metric was developed based upon the
load reductions required to achieve legislated pollutant concentrations which maintain the
environmental values of the ecosystems (QG 2009). This was similar to an allocation based upon
Water Sensitive Urban Design (WSUD) minimum reductions in pollutant loads for urban stormwater
(DERM 2009; Hall 2012). The WSUD-allocation apportioned 43%, 24% and 32% of costs to TSS, TN
and TP respectively. The main difference was for TN which may suggest that TN pollutant loads in
MBRC are closer to the sustainable load target than the other pollutants.
The allocation presented in Table 2 was modified by apportioning the TSS allocation to the TN and
TP. There was a large difference in this allocation compared to reported cost drivers for point source
abatement measures that reduce both total nitrogen and total phosphorus. For example, a survey of
cost drivers for Australian wastewater utilities reported that approximately 75% of the cost was
allocated to nitrogen abatement and 25% to phosphorus abatement (Pickering and Marsden 2007).
This assumption was similar to an allocation assumed by the US EPA (USEPA 2008).
Table 3 shows a variation of the allocation for recycled water. It was assumed that water recycling
would affect water quality only through reductions in nutrients.
An additional allocation rule was developed for Water Sensitive Urban Design, rainwater tanks and
stormwater harvesting. This rule illustrates a refinement of the original approach based upon the
results. The results indicated these options (after accounting for water supply avoided costs) would not
be adopted on a least-cost basis to abate TSS for ‘no worsening’ of catchment conditions. This meant
that the primary pollution abatement purpose of these options was nutrient abatement and TSS was an
additional benefit. The weighted average cost for TSS abatement from the MACC was considered as
an ‘avoided cost’ for these options and the remainder allocated to nutrients. For example, a TSS
abatement cost of $213/t reduced the present value of WSUD by about 10%. The remaining costs were
then allocated to TN and TP following the approach in Table 3.
Table 2. Water quality allocation for cost and benefit of water pollution.
TSS TN TP Total
Sustainable load 2,762 140.9 8.63
Load reduction required to achieve sustainable load 34,013 576 88
Distance from sustainable load target 12.3 4.09 10.2 26.6
Allocation 0.46 0.15 0.38 1
Table 3. Water quality allocation for cost and benefit of water pollution for recycled water.
TSS TN TP Total
Allocation 0 0.28 0.72 1
An allocation based upon the load reduction required to achieve ‘no worsening’ was not adopted
because it does not account for the current load levels and their effect on water quality. For example,
existing sediment loads due to agriculture would not be captured, although they may contribute
significantly to the current state of waterway health. This approach captures the relative importance of
abating various pollutants to improve existing water quality.
3.3.1 Moreton Bay Bulk Water Price
If an abatement option also provided a water supply, then the value of water was subtracted from the
capital and operating costs and the remaining costs allocated to pollution abatement. Table 4 presents
the Queensland Water Commission (QWC) bulk water price path for MBRC (Queensland Water
Commission http://www.qwc.qld.gov.au/reform/bulkwaterprices.html). This price path was inflation
adjusted but not discounted. Figure 9 provides the value of bulk water in present value for discount
Extended Cost-Effectiveness of Water Supply Options: Case Study of the Total Water Cycle Management Plan
for Moreton Bay Regional Council Page 9rates of 3 and 5.5%. Note that the revised QWC price path appears to cap bulk water prices at
$2812/ML. Moreton Bay reaches this cap in 2016 and the same price is applied in 2017 (other
Councils such as Somerset reach this cap in 2014). It was assumed that the price was also capped up to
2030. The value of water is sensitive to this assumption because the trajectory of bulk water prices
prior to 2016 suggests a much higher value of water.
Table 4. Queensland Water Commission Bulk Water Price Path for Moreton Bay Regional Council.
2010-11 2011-12 2012-13 2013-14 2014-15 2015-16 2016-17 2017-18
Bulk Water Price
$1,652 $1,875 $2,086 $2,286 $2,475 $2,653 $2,812 $2,812
Path ($2011/ML)
Figure 9. Assumed value of water based upon the QWC bulk water price path for Moreton Bay.
3.3.2 Agricultural Water Price
A value of $3.80 per megalitre was assumed for agricultural water based upon Schedule 14 Water
Charges of the Water Regulation 2002 (QG 2011). This water has a relatively low value compared to
bulk water for the urban water supply. It was assumed that no other higher value use of the water was
available and that the provision of recycled water to agriculture provided a disposal option that
minimised impact on receiving waters. The recycling of water to agriculture may also reduce the
treatment requirements, such as Class B effluent rather than Class A+ effluent. This means that
recycled water to agriculture is not an urban water supply option. If it is argued that the use of recycled
water avoids the use of urban water supplies then the value of the avoided cost is the bulk water price.
Nonetheless, the option is retained in the results to illustrate the cost saving of pollution abatement
compared to the cost of the water.
Extended Cost-Effectiveness of Water Supply Options: Case Study of the Total Water Cycle Management Plan
for Moreton Bay Regional Council Page 104. DEFINING THE OBJECTIVE FOR POLLUTION REDUCTION
The objective for pollution reduction was assumed to focus on water quality within the catchments of
MBRC outlined in the draft TWCMP. This means that abatement options in other catchments that may
be more cost-effective or address more pressing pollution problems were not considered. For example,
abatement measures in the Lockyer Valley may be more cost-effective for improving water quality in
Moreton Bay but were not considered in this study. It should be noted that residents in SEQ are
willing to invest in other areas for water quality improvement if it is more cost-effective (Binney
2010).
Objectives for waterway health have been defined in the Environmental Protection (Water) Policy
1997 (EPP Water) and the South East Queensland Natural Resource Management Plan 2009-2031
(SEQ NRM Plan). The SEQ NRM Plan references the EPP Water and has three targets that are
particularly relevant to pollution impacts on SEQ waterways:
In 2031, High Ecological Value (HEV) waterways scheduled in the EPP Water will maintain
their 2008 classification (W5 – High Ecological Value waterways).
In 2031, Water Quality Objectives (WQO) to achieve Environmental Values (EV) scheduled in
the EPP Water will be achieved or exceeded for all SEQ waterways (W6 – Waterways
maintenance and Enhancement).
By 2031, waterways that are currently classified as ranging from slightly to moderately
disturbed and/or highly disturbed will have their ecosystem health and ecological processes
restored (DERM 2009 - p34-35).
The environmental values have been defined and mapped for the Caboolture catchment and tributaries.
In addition, pollution concentrations to achieve the Water Quality Objectives (WQO) have been
defined for TN, TP and TSS. Further details are provided in the Appendices.
The following section outlines how the objectives were considered for the MBRC TWMP. In general,
the objective for pollution reduction was defined in terms of a load reduction and the associated
benefit for a level of waterway health.
4.1. Load Reductions to Achieve Waterway Health Objectives
Load reductions can be defined to achieve objectives which can range from: ‘do nothing’; maintaining
the current condition as the population increases; achieving Water Quality Objectives for
Environmental Values; to returning the waterways to their original condition. Each load reduction
target has both a cost and a benefit for pollution abatement.
Two load reductions were initially considered, namely a ‘no worsening’ and a ‘sustainable’ load target
to achieve the EPP Water WQO. Benefits for pollution abatement were available for both targets.
However, the quantification of the actual load reduction associated with the targets became
complicated due to modelling constraints. Calculating the load reduction was required to express both
the costs and benefits in terms the amount of pollution abated.
The calculation of ‘no worsening’ load reductions was relatively uncomplicated because it assumed
the long-term average for current conditions and based the future load upon projections of
development for the catchment. However, assuming the average load meant that available modelling
for determining the sustainable load was no longer compatible (Pers. Comm, Nicole Ramilo BMT-
WBM 16 April 2012). The sustainable load calculation was based upon 2005-6 data due to modelling
constraints (BMT-WBM 2012 – p6-1). This was a dry year, which means that the pollutant loads were
low, which in turn had two effects. Firstly, the low pollutant loads meant that the reduction in load
from the current dry year to a sustainable dry year was low. This reduction in load was actually less
than the load reduction for average conditions for ‘no worsening’. This illustrates that the same
conditions (preferably typical conditions) should be used for the calculation of both the ‘no worsening’
Extended Cost-Effectiveness of Water Supply Options: Case Study of the Total Water Cycle Management Plan
for Moreton Bay Regional Council Page 11and ‘sustainable’ loads. In addition, the modelling suggested that loads needed to be reduced to less
than pre-European conditions in some cases to meet the EPP (Water) pollution concentrations. This
suggests EPP (Water) pollution concentrations are unlikely to be achieved all the time in all parts of
the catchment, regardless of the level of abatement.
4.1.1 Current and Future Pollution Loads
The following tables provide a summary of the current and future loads based upon BMT-WBM (2010
– Tables 3-4, 3-7, 3-17, 3-20). This data does not include reductions for urban stormwater based on
WSUD requirements. Consequently, this data provides a good starting point for considering all
possible abatement measures.
Table 5. Current (2010) stormwater annual pollution loads in MBRC catchments.
Catchment TSS (t/yr) TN (t/yr) TP (t/yr)
Bribie Island 585 13 1.4
Pumicestone Passage 3,111 73 9.3
Redcliffe 1,143 19 2.6
Mary River 797 20 1.6
Caboolture River 8,816 136 16.3
Burpengary Creek 2,415 34 4.5
Hays Inlet 2,603 42 5.3
Brisbane Coastal 922 15 2.0
Byron Creek 50 1 0.1
Neurum Creek 1,595 36 3.3
Sideling Creek 1,195 15 1.8
Lower Pine Creek 7,980 109 12.6
Upper Pine Creek 4,466 87 8.0
Stanley River 5,981 133 12.7
Total 41,659 733 81.5
Table 6. Current (2010) STP annual pollution loads in MBRC catchments.
Catchment STP TSS (t/yr) TN (t/yr) TP (t/yr)
Stanley Woodford 0.271 0.421 0.03
Bribie Bribie Is 3.949 2.962 0.355
Caboolture Burpengary East 7.126 13.895 0.428
South Caboolture 5.912 4.729 0.591
Upper Pine Dayboro 0 0 0
Lower Pine Murrumba Downs 14.242 21.363 3.561
Brendale 4.681 8.894 0.468
Hays Redcliffe 10.369 20.738 0.518
Total 46.55 73.002 5.951
Extended Cost-Effectiveness of Water Supply Options: Case Study of the Total Water Cycle Management Plan
for Moreton Bay Regional Council Page 12Table 7. Future (2030) stormwater annual pollution loads in MBRC catchments.
Catchment TSS (t/yr) TN (t/yr) TP (t/yr)
Bribie Island 725 15 1.7
Pumicestone Passage 3,557 79 10.4
Redcliffe 1,344 21 3.1
Mary River 797 20 1.6
Cabooluture River with CIGA 12,382 199 27.2
Burpengary Creek 2,832 43 6.3
Hays Inlet 4,021 60 9
Brisbane Coastal 956 15 2.1
Byron Creek 50 1 0.1
Neurum Creek 1,595 36 3.3
Sideling Creek 1,215 16 1.9
Lower Pine Creek 9,652 132 17.4
Upper Pine Creek 4,477 86 7
Stanley River 6,118 135 13.2
Total including CIGA 49,721 858 104.3
Table 8. Future (2030) STP annual pollution loads in MBRC catchments.
Catchment STP TSS (t/yr) TN (t/yr) TP (t/yr)
Stanley Woodford 0.7 1.8 0.4
Bribie Bribie Is 6.0 4.5 3.0
Caboolture Burpengary East 12.7 19.0 1.9
South Caboolture (includes 23.8 29.7 3.6
CIGA)
Upper Pine Dayboro 0.0 0.0 0.0
Lower Pine Murrumba Downs 23.8 35.7 6.0
Brendale 11.3 14.1 2.8
Hays Redcliffe 13.6 33.9 0.7
Total including CIGA 91.8 138.7 18.3
4.1.2 ‘No Worsening’ Load Reduction Target
A ‘no worsening’ load reduction target was calculated for the abatement required to offset the increase
in pollutant loads due to population and development over the next 20 years. The calculations of the
‘no worsening’ load reduction considered the change in the annual load for the current load and the
2030 load. It was then assumed that there would be a linear increase in load from the current load to
the 2030 load. This can be thought of as the pollution abatement required each year to maintain loads
at their current levels. The load reduction required over the period was calculated as the sum of the
abatement required each year to achieve ‘no worsening’ of pollutant loads.
Tables 9 and 10 illustrate the change in annual load predicted over the next 20 years for stormwater
and Sewage Treatment Plants (STP) as the population increases based upon the Total Water Cycle
Strategy for Moreton Bay Regional Council (BMT-WBM 2010 – Tables 3-4, 3-7, 3-17, 3-20). The
Caboolture River (with the CIGA) catchment will experience the largest increase in load of any of the
catchments. Note that Burpengary East STP and Burpengary Creek were included in the loads as they
discharge to the estuary. On the other hand, the loads do not include WSUD stormwater load
reductions which were considered as an abatement option.
Extended Cost-Effectiveness of Water Supply Options: Case Study of the Total Water Cycle Management Plan
for Moreton Bay Regional Council Page 13Table 11 summarises the projected annual increase in loads by 2030 of approximately 8107, 191, 35
tonnes per year for TSS, TN and TP respectively. Assuming a linear increase in annual load, this
amounts to a total increase in load over the period of 2010 to 2031 of approximately 89,179 tonnes of
TSS, 2097 tonnes of TN and 386 tonnes of TP.
Table 11 also provides a comparison of point and diffuse loads for the all of the MBRC catchments.
Stormwater in urban and rural catchments is the main source of pollution and contributes twice the
load of STPs for nutrients and almost all of the sediment load. This is an important consideration for
identifying abatement options to meet load reduction targets.
Table 9. Projected increase in stormwater annual load for MBRC catchments for 2010 compared to
2031.
Catchment TSS (t/yr) TN (t/yr) TP (t/yr)
Bribie Island 140 2 0.3
Pumicestone Passage 446 6 1.1
Redcliffe 201 2 0.5
Mary River 0 0 0.0
Caboolture River with CIGA 3566 63 10.9
Burpengary Creek 417 9 1.8
Hays Inlet 1418 18 3.7
Brisbane Coastal 34 0 0.1
Byron Creek 0 0 0.0
Neurum Creek 0 0 0.0
Sideling Creek 20 1 0.1
Lower Pine Creek 1,672 23 4.8
Upper Pine Creek 11 -1 -1.0
Stanley River 137 2 0.5
Total including CIGA 8,062 125 22.8
Table 10. Projected increase in Sewage Treatment Plant annual load for MBRC catchments for 2010
compared to 2031.
Catchment STP TSS (t/yr) TN (t/yr) TP (t/yr)
Stanley Woodford 0.4 1.4 0.3
Bribie Bribie Is 2.0 1.5 2.6
Caboolture Burpengary East 5.6 5.1 1.5
South Caboolture (includes 17.9 25.0 3.0
CIGA)
Upper Pine Dayboro 0.0 0.0 0.0
Lower Pine Murrumba Downs 9.6 14.4 2.4
Brendale 6.6 5.2 2.3
Hays Redcliffe 3.2 13.2 0.2
Total including CIGA 45.2 65.7 12.3
Extended Cost-Effectiveness of Water Supply Options: Case Study of the Total Water Cycle Management Plan
for Moreton Bay Regional Council Page 14Table 11. Summary of the projected increase in annual average load for Moreton Bay Regional
Council Catchments for 2010 compared with 2031.
Load Source TSS (t/yr) TN (t/yr) TP (t/yr)
Stormwater 8,062 125 23
STP 45 66 12
Total 8,107 191 35
Table 12. Abatement Required over the Analysis Period to Achieve 'No Worsening' of Pollutant Loads.
Year TSS (t/yr) TN (t/yr) TP (t/yr)
2010 0 0 0
2011 405 10 2
2012 811 19 4
2013 1,216 29 5
2014 1,621 38 7
2015 2,027 48 9
2016 2,432 57 11
2017 2,838 67 12
2018 3,243 76 14
2019 3,648 86 16
2020 4,054 95 18
2021 4,459 105 19
2022 4,864 114 21
2023 5,270 124 23
2024 5,675 133 25
2025 6,080 143 26
2026 6,486 153 28
2027 6,891 162 30
2028 7,296 172 32
2029 7,702 181 33
2030 8,107 191 35
Total load reduction over 85,126 2,002 369
the period of analysis for
‘no worsening’
4.2. Benefit for Achieving a Waterway Health Objective
There has been a significant amount of recent work to quantify the value of SEQ waterways (Windle
and Rolfe 2006; Binney 2010; Binney and James 2011; MJA and BCC 2011). It was estimated that the
present value1 of avoiding further decline in SEQ coastal, marine, and inland waterways over the next
20 years is approximately $2 billion (Binney and James 2011 – p5). This estimate does not include
benefits to businesses that are affected by water quality such as water treatment, fisheries or tourism.
In terms of TWCMP, it is interesting to note that some of the ‘externalities’ are not far removed from
the provision of water. For example, it was estimated that riparian revegetation of the Lockyer Creek
could reduce chemical costs for Mt Crosby water treatment by around $240,000 per annum
(AUD2005) (Weber 2005). This follows the well-known example of New York City where it was
estimated that $1.5 billion spent over 10 years on watershed protection avoided over $6 billion in
capital and $300 million in annual operating costs for water filtration (Postel and Thompson 2005).
1
Assuming a 5.5% discount rate.
Extended Cost-Effectiveness of Water Supply Options: Case Study of the Total Water Cycle Management Plan
for Moreton Bay Regional Council Page 15You can also read


