Somatic Characteristics and Special Motor Fitness of Young Top-Level Polish Table Tennis Players - MDPI
←
→
Page content transcription
If your browser does not render page correctly, please read the page content below
International Journal of
               Environmental Research
               and Public Health

Article
Somatic Characteristics and Special Motor Fitness of Young
Top-Level Polish Table Tennis Players
Beata Pluta * , Szymon Galas, Magdalena Krzykała                          , Marcin Andrzejewski           and Karolina Podciechowska

                                          Faculty of Tourism and Recreation, Poznan University of Physical Education, Poland Królowej Jadwigi 27/39,
                                          61-871 Poznan, Poland; galas.szymon@gmail.com (S.G.); krzykala@awf.poznan.pl (M.K.);
                                          andrzejewski@awf.poznan.pl (M.A.); podciechowska@awf.poznan.pl (K.P.)
                                          * Correspondence: bpluta@awf.poznan.pl; Tel.: +48-6-1835-5000; Fax: +48-6-1835-5099

                                          Abstract: In the present study, we aimed to identify the impact of chosen anthropometric measure-
                                          ments on the special physical fitness of elite junior table tennis players at different stages of sport
                                          training. A total of 87 table tennis players aged 13.4 ± 1.74 years (43.7% girls and 56.3% boys) from
                                          two Polish teams were analyzed. The anthropometry measurements included height, sitting height,
                                          body weight, arm span, humerus and femur breadths, five skinfold thicknesses, and five girths were
                                          assessed. Participants’ somatotypes were also calculated using the Heath–Carter method as well as
                                          body mass index (BMI), which was constructed using the lambda, mu, sigma (LMS) method. Body
                                composition via a bioelectric impedance analysis was also analyzed. The level of special fitness of
                                   athletes was determined using tests from the Table Tennis Specific Battery Test, assessing reaction
Citation: Pluta, B.; Galas, S.;           and displacement speeds. Mesomorphic (4.1) and ectomorphic (3.8) profiles were registered for
Krzykała, M.; Andrzejewski, M.;           boys and girls, respectively. Boys achieved higher scores than girls for almost all variables, with
Podciechowska, K. Somatic                 the exception of ectomorphic somatotype (p = 0.274), skinfold triceps (p = 0.444), and calf skinfold
Characteristics and Special Motor         medial (p = 0.609). The relationship between the body height, thickness of the skinfolds of the triceps
Fitness of Young Top-Level Polish         and suprailiac, biceps, and waist circumference and arm span in all three motor tests was observed,
Table Tennis Players. Int. J. Environ.    simultaneously significantly higher results were obtained by competitors at the specialist stage of
Res. Public Health 2021, 18, 5279.
                                          training. Knowledge of the somatic and motor characteristics of young athletes can help coaches in
https://doi.org/10.3390/
                                          creating a specific training program for improved health and performance, taking into consideration
ijerph18105279
                                          the athletes’ biological development, potential, and pre-disposition.
Academic Editors:
                                          Keywords: table tennis; young athletes; anthropometry; body composition; somatotype; special
Gabriele Mascherini and
Pascal Izzicupo
                                          physical fitness

Received: 27 April 2021
Accepted: 14 May 2021
Published: 16 May 2021                    1. Introduction
                                               Table tennis is one of the fastest racquet sports in terms of game speed. Hence, many
Publisher’s Note: MDPI stays neutral      physical factors are important in order to meet the requirements of this activity [1,2]. The
with regard to jurisdictional claims in   most important factor for a successful table tennis player involves their technical skills,
published maps and institutional affil-   but many other factors can also determine good results in this sport discipline, such as
iations.                                  body proportions, somatotype, and body composition. The structure of the athletic body
                                          can be related to specialized functions that are required for many specific tasks and allows
                                          to understand the limitations of such relationships [3,4]. For example, both body shape
                                          and size can influence balance; the lengths of upper and lower limbs may provide a
Copyright: © 2021 by the authors.         mechanical advantage during play and reaching the ball. On the other hand, excess body
Licensee MDPI, Basel, Switzerland.        mass can have a negative effect on speed and endurance, whereas excess body fat can
This article is an open access article    increase body fatigue [5,6]. Such an association between anthropometric measurements
distributed under the terms and           and functional characteristics is highly important for scientists and coaches during athletic
conditions of the Creative Commons        potential identification [7]. Most research in table tennis has focused on physical fitness
Attribution (CC BY) license (https://
                                          and abilities. Little attention has been directed to the relation between anthropometric
creativecommons.org/licenses/by/
                                          measures and special motor fitness [8–10]. Several authors have studied the relationship
4.0/).

Int. J. Environ. Res. Public Health 2021, 18, 5279. https://doi.org/10.3390/ijerph18105279                    https://www.mdpi.com/journal/ijerph
Int. J. Environ. Res. Public Health 2021, 18, 5279 2 of 12
between various anthropological variables and body composition for success in table
tennis [11–13]. However, some research states that, between the ages of 10 and 14 years,
no distinct anthropometric player profile exists [6]. However, determining sport persons’
somatic profiles remains an interesting subject for research within the field of racket sports.
In the scientific literature, there have been isolated studies addressing the topic of
somatotype and anthropometric profiles of table tennis players, but these analyses did not
indicate one clearly dominant type of somatic construction. Munivrana and Paušić [14]
point out that somatic construction often results not only from lifestyle or diet but also
from genetic heritage. The authors carried out anthropometric measurements on a group
of 62 young Croatian table tennis players aged 10–14 years playing at the national champi-
onships level in the context of sporting success.
The results indicated the dominance of the mesomorphic type of body, which was vis-
ible in almost half of the subjects. More than a third of those surveyed had an ectomorphic
body type, and more than 16% were endomorphic. Based on comprehensive research, it has
been concluded that the somatotype of players of this age is not a key factor in achieving
success in table tennis but, rather, increases its likelihood. Similar studies were carried
out by Carrasco et al. [13] on a group of 63 players (including 38 boys) aged 10–13 years
belonging to the Spanish national table tennis team; Chatterjee et al. [5] also examined
29 players (including 14 men) aged 10–20 years in India. In both cases, the analysis indicated
an endomorphic–mesomorphic physique type for boys and endomorphic–ectomorphic
for girls.
Khasawneh [15] conducted a study in Jordan to measure anthropometric measure-
ments and determined their relationship to the level of static and dynamic equilibrium,
showing a correlation between static balance and hip width and between calf circumference
and ankle width and dynamic balance. The study involved 24 young table tennis players
playing at the national championship level. Söğüt et al. [16] studied anthropometric pro-
files and the level of selected components of overall fitness (assessing speed, agility, hand
strength, or vertical jump) of young Turkish table tennis players in the context of table
tennis serving speed.
The results indicated the importance of several anthropometric characteristics in
performing a fast service and the correlation between service speed, body weight, and
body mass index (BMI). Behdari et al. [17] compared anthropometric profiles and the level
of selected general fitness components taken from EUROFIT European Physical Fitness
Test trials. Sixteen Iranian table tennis players participating in the national championships
took part in the survey. Comparisons of the top five in the ranking with the others
pointed to significant differences in the types of somatotypes among players, indicating
the dominant mesomorphic–ectomorphic body-building type for players in the top five of
the rankings and mesomorphic–endomorphic for the other players. Generally speaking,
the aforementioned studies showed that table tennis players have an average body height,
relatively low amount of fat tissue, and high aerobic capacity.
However, despite an increasing number of publications, the research has frequently
yielded contradictory results, which engenders an animated discussion on somatic factors
that determine the sports development of players in table tennis. Therefore, this study
aims to determine what somatotype factors influence the level of physical special fitness
of young table tennis players. To achieve this goal, our study was twofold, addressing
both physical fitness and somatotype and body composition of young top-level table
tennis players. The aim of the study was to identify the impact of some anthropometric
measurements on special physical fitness among elite junior table tennis players (girls and
boys, at different stages of sport training).
2. Materials and Methods
2.1. Participants
The study included data collected from 87 young Polish table tennis players aged
13.4 ± 1.74 years (43.7% girls with a body mass M = 47.2 ± 8.97 and height M = 158.2 ± 8.99Int. J. Environ. Res. Public Health 2021, 18, 5279 3 of 12
and 56.3% boys with a body mass M = 55.1 ± 14.15 and height 165.0 ± 11.81) from the
teams of two provinces: Dolnoślaskie
˛ and Wielkopolskie. The group was selected from a
larger study group (n = 98 players). The final group (n = 87) was composed of players, who
meet inclusion criteria (listed below).
The participants were born between 2002 and 2007 and trained in table tennis 3–4 times
a week at the targeted or specialized sports training stage (according to the National Table
Tennis Development Program in Poland guidelines for 2018–2033). The targeted training
stage includes players aged 9–12 years, and the specialized training stage includes players
aged 13–17 years. The study group was selected arbitrarily using the following criteria:
written consent from parents to participate in the research, membership in the province
team, current license of the Polish Table Tennis Association, a minimum three-year training
period, health conditions, allowing all physical fitness tests to be carried out, and playing
style, requiring the use of rackets with a so-called smooth lining (excluding people using
rackets with atypical cladding, such as anti-spin cladding, short pin, or long pin, where
play is characterized by a different technique than top-spin strokes used in a battery of
special tests).
The study was conducted in compliance with the Declaration of Helsinki and was ap-
proved by the local ethics committee: The Bioethics Committee of the Karol Marcinkowski
Medical University, Poznań, Poland (No. 543/18). All data were analyzed confidentially.
2.2. Protocol of the Study
The design of the study is described in Figure 1. The players were familiarized with
the procedures and equipment before the tests began. Anthropometric measures were
conducted between 7.00 and 9.00 in the morning and participants were asked to refrain
from consuming food before baseline measurements. All measurements were taken and
data were collected before exercise (TTSBT). Prior to the start of each trial, the athletes
performed the same standard “warm-up” including a block of formative exercises (15 min)
and a special “warm-up” on the table (20 min) under the supervision of the coach and were
instructed on the correct way to perform it. The trials were performed on an official table
tennis court, in the usual training area, in the same time slot (17:00 and 19:00).
2.3. Anthropometric Measurements
Anthropometric measurements were taken, according to standard procedures, follow-
ing the guidelines described by Martin and Saller [18]. All measurements were evaluated
by trained personnel. The following characteristics were measured: body height (cm), body
weight (kg), sitting height (cm), humerus breadth and femur breadth (cm), five skinfold
thicknesses—triceps (cm), suprailiac (cm), subscapular (cm), medial calf skinfold, and calf
(cm), the circumferences of the arm relaxed, waist, hip, thigh, and lower leg. Moreover,
the arm span of each athlete was measured. Stature (body height) was measured to the
nearest 0.1 cm with a stadiometer (GPM, Zurich, Switzerland), with the child standing
upright. When sitting height was measured, the subject was asked to sit on a chair with
their back and buttocks touching the backboard of the stadiometer, knees directed straight
ahead, arms and hands resting at their side. During arm span measurement, which is
the maximum distance between the extended middle fingers of the right and left hands,
the athletes stood with their backs to the wall with the arms held exactly horizontally at
shoulder level. The distance between fingers was measured with a tape measure. Humerus
breadth and femur breadth were measured with a sliding caliper (GPM, Zurich, Switzer-
land). All skinfolds were measured to the nearest 0.1 mm, using a Harpenden caliper
(Baty International, Burgess Hill, UK), whereas all circumferences were determined with
anthropometric tape (cm).Int. J. Environ. Res. Public Health 2021, 18, x FOR PEER REVIEW 4 of
Int. J. Environ. Res. Public Health 2021, 18, 5279 4 of 12
Figure 1. Graphical overview of the study protocol.
Figure 1. Graphical overview of the study protocol.
Body mass was measured with a Tanita MC-780 MA analyzer (Tanita Corp., Tokyo,
Japan) with GMON software (version 3.2.8, Tanita Europe BV, Amsterdam, The Nether-
lands), following the directions and procedures of the manufacturer. All participants were
instructed to refrain
2.3. from exercising
Anthropometric and eating or drinking anything for 3 h prior to testing
Measurements
and to void their bladders in order to ensure that the test results were not influenced by
Anthropometric measurements were taken, according to standard procedures, f
body temperature, breathing rate, and/or the presence of food/beverages in the gastroin-
lowing the guidelines described by Martin and Saller [18]. All measurements were eva
testinal tract [19]. During the test, children stood erect with their bare feet on the contact
ated by trained personnel. The following characteristics were measured: body height (cm
electrodes while holding the electrodes of the BIA unit in their hands. The chronological
body weight (kg), sitting height (cm), humerus breadth and femur breadth (cm), five sk
age was calculated to the decimal using the date of birth (day, month, year) and the date
fold thicknesses—triceps (cm), suprailiac (cm), subscapular (cm), medial calf skinfold, a
(day, month, year) the anthropometric measurements were taken. Decimal age categories
calf (cm), the circumferences of the arm relaxed, waist, hip, thigh, and lower leg. More
were based on one-year intervals (e.g., 12.50 to 13.49 = 13 years). The biological age of
ver, the arm span of each athlete was measured. Stature (body height) was measured
body height and body mass of young tennis players was estimated. Growth references for
the nearest
height, weight 0.1 cmand
(body mass), with a stadiometer
BMI (GPM,with
were constructed Zurich,
theSwitzerland), with the
lambda, mu, sigma child standi
(LMS)
upright. When sitting height was measured, the subject was
method, using data from a large, recent, population-representative sample of school-agedasked to sit on a chair w
children and adolescents in Poland [20]. Participants were classified as underweight, nor- straig
their back and buttocks touching the backboard of the stadiometer, knees directed
mal weight, ahead, arms and hands
or overweight, resting
according at their
to age- andside. During armcut-off
gender-specific span measurement,
points [21]. All which is t
anthropometric dimensions were measured on two occasions for a sample of 87 players to hands, t
maximum distance between the extended middle fingers of the right and left
athletes stoodtechnical
calculate intra-observer with their backsoftomeasurement.
errors the wall with the arms held exactly horizontally at sho
der level. The distance between fingers was the
To determine the table tennis players’ somatotypes, measured with a tape
most frequently usedmeasure.
model Humer
breadth and femur breadth were measured with a sliding
the Heath and Carter method [22] was employed, which was developed on the basis caliper (GPM, Zurich,
of Switz
land).
Sheldon’s type All skinfoldsAll
classification. were measured to the
morphological nearest
traits were 0.1
usedmm, using a Harpenden
to calculate somatotype caliper (Ba
components International,
of endomorphy Burgess Hill,
(a high UK), of
degree whereas all circumferences
subcutaneous were determined
fat tissue), mesomorphy (a with a
thropometric
highly developed tape (cm). system), and ectomorphy (the linearity of the body is
musculoskeletal
Body mass
emphasized). In the next step, was all
measured with awere
participants Tanita MC-780
assigned toMA
threeanalyzer
groups (Tanita
accordingCorp., Toky
Japan) with GMON software (version 3.2.8, Tanita
to the highest value of their somatotype components. A component lower than 2.5 is Europe BV, Amsterdam, T
considered to be low, from 3.0 to 5.0 medium, and from 5.5 to 7.0 high. Values higher than
7.5 are considered extreme [23]. The data obtained using anthropometric measurementsInt. J. Environ. Res. Public Health 2021, 18, 5279 5 of 12
were entered into the “Somatotype—calculation and analysis” computer program [24].
This computer program recognizes different combinations of the individual components of
a somatotype and places subjects in different groups and sub-groups depending on the
influence of each component. All measurements were performed in the morning.
2.4. Special Motor Fitness
To determine the level of special fitness of young table tennis players, tests from the
Table Tennis Specific Battery Test (TTSBT) were used, assessing reaction and displacement
speeds [25]. In reaction speed tests, balls are thrown at high speed (70 balls/minute) to
different areas of the table tennis table, and the player has to perform forehand (T1) or
backhand (T2) top-spins. The return of balls that touch the table for over 15 s is considered
successful. In T3, balls are thrown at high speed (80 balls/minute) to the sides of the table,
and the player should alternately perform forehand and backhand top-spins. The return
of balls that touch the table for over 15 s is considered successful. The selected options
included the use of two strokes, considered basic at the stage of targeted and specialized
training, and top-spin forehand and top-spin backhand, previously used for similarly aged
participants [26]. The intraclass correlation coefficient (ICC) overall absolute agreement
of the assessed parameters of the TTSBT was high (0.85). More specifically, Cronbach’s
α (coefficient of reliability or consistency) for T1 was 0.83, for T2 was 0.86, and for T3
was 0.69.
A Tibhar Robo Pro Junior (Racket-Company OHG, Offenbach, Germany), a compact
machine with an oscillator and remote control, was used to carry out the test samples.
For the test, the machine was programmed to throw balls without rotation and with a
central ball spread angle. The balls were thrown in the following variants: (1) top-spin
forehand diagonally, (2) top-spin backhand straight, and (3) mixed attempt to play once
with top-spin forehand and once with top-spin backhand with the machine in the center of
the table. Before the start of each test sample, the competitors performed a block of shaping
exercises and special exercises and were informed about the correct way of performing
the test samples. All tests were measured on two occasions to calculate the intra-observer
technical errors of measurement.
2.5. Statistical Analyses
The level of special fitness of young table tennis players was considered a dependent
variable in this study. The independent variables were anthropometric measurements,
BMI, somatotype categories of trained young male and female table tennis players, their
age, gender, and sport training stage. Descriptive statistics were presented as mean and
standard deviation or range (minimum–maximum). The difference in mean results between
two independent groups was checked using a Student’s t-test for independent samples.
The normality of the distributions was determined using a Kolmogorov–Smirnov test. In
the event of failure to meet the Student’s t-test assumption about the normality of the
distribution of the studied variable, and in the case of ordinal variables, a Mann–Whitney
U test (Z) was used to check the significance of differences. Correlations between variables
were checked using Spearman’s rank correlation coefficient (rs ). To accomplish the study
goal, separate hierarchical multiple regression models were built, with T1, T2, and T3
as dependent variables. All three models included only the independent variables that
were shown to be significantly associated with special motor fitness tests by univariate
analyses. In all three models, potential predictors were anthropometric measurements, BMI
(according to LMS), somatotype, age, and training experience of the young table tennis
players. The threshold of statistical significance for the inclusion of independent variables
in the multiple regression models was set at p < 0.05. IBM SPSS Statistics 23 (IBM Corp.,
Armonk, New York, NY, USA) was used for the statistical analyses.Int. J. Environ. Res. Public Health 2021, 18, 5279 6 of 12
3. Results
The sample characteristics and descriptive results are presented in Table 1.
Table 1. Demographic characteristics of the players.
Girls (n = 38, 43.7%) Boys (n = 49, 56.3%)
Variable
M ± SD Min–Max M ± SD Min–Max
chronological age (years) 13.4 ± 1.76 10.7–16.5 13.7 ± 1.75 11.0–17.0
biological age (years) 12.3 ± 1.52 9.9–16.1 13.4 ± 2.01 8.6–17.9
targeted stage of sport training (n, %) 23, 60.5% 27, 55.1%
specialized stage of sport training (n, %) 15, 39.5% 22, 44.9%
M = mean; SD = standard deviation; Min = minimum value; Max = maximum value.
Analysis data from Table 2 connecting the coefficient of variation of the anthropometric
characteristics showed that the group was, on average, differentiated in terms of variables
related to morphological structure (mean variability 21.2%). In the area analyzed, only the
values of the four coefficients of variation (body height, sitting height, humerus diameter,
femur diameter) did not exceed 10%. Statistical analysis showed that boys achieved
higher scores than girls for almost all variables studied, with the exception of ectomorphic
somatotype (p = 0.274), skinfold triceps (p = 0.444), and calf skinfold medial (p = 0.609).
The detailed analysis of the data showed that the average BMI (according
. J. Environ. Res. Public Health 2021, 18, x FOR PEER REVIEW to13LMS) of the
8 of
subjects was 102.6 (±15.18) points. Nearly 55% of the players surveyed had the correct
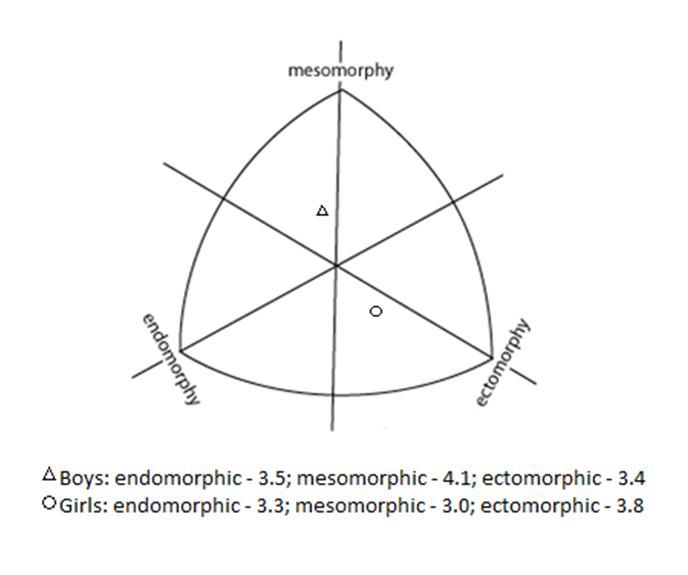
degree of nutrition, whereas 14% were diagnosed with obesity. Mean somatotypes for table
tennis players according to sex and components (endomorphy, mesomorphy, ectomorphy)
were presented in Figure 2.
Figure 2. Somatochart—the mean somatotype for boys and girls.
Statistically
Figure 2. Somatochart—the significant
mean correlations
somatotype between
for boys and girls. age and body mass, body height, sitting
height, subscapular skinfold girths: biceps (relaxed), waist, hip, calf, and arm span were
demonstrated.
The group In addition,
of table tennis players age also correlated
moderately with humerus
differentiated and
the area of femur
specialdiameter
motor measure-
ments. In all cases, the correlations were positive, with older respondents
fitness. Table 3 presents the results obtained by young table tennis players in three special achieving higher
values for the above-mentioned measurements (Table 2). A correlating analysis did not
fitness trials.
show statistically significant links between the players’ ages and their body type.
Table 3. Results ofThethe group of table
Table Tennis tennisBattery
Specific players moderately
Test differentiated
(TTSBT) (the thethat
number of balls area of special motor
touch
fitness.
the table in 15 Table 3 presents
s): comparison by genderthe
andresults obtained
training stages. by young table tennis players in three special
fitness trials.
Boys Girls U Manna-Whitneya Test
Variable
M ±SD M ±SD Z p
Test 1 13.4 ± 3.32 13.6 ± 3.08 −0.34 0.734
Test 2 13.1 ± 3.91 13.4 ± 3.17 −0.40 0.686Int. J. Environ. Res. Public Health 2021, 18, 5279 7 of 12
Table 2. Morphological characteristics of high-level table tennis players for gender, age and stage of sport training.
Boys Girls
Test t Student or U Age Targeted Stage Specialized Stage Test t Student or U
Variable (n = 49, 56.3%) (n = 38, 43.7%) V (%)
M ± SD M ± SD t/Z p rs p M ± SD M ± SD t/Z p
endomorphic somatotype 3.5 ± 1.53 3.3 ± 1.04 0.75 0.452 38.6 −0.03 0.790 3.5 ± 1.35 3.3 ± 1.32 0.72 0.476
mesomorphic somatotype 4.1 ± 1.39 3.0 ± 1.00 −3.95 *Int. J. Environ. Res. Public Health 2021, 18, 5279 8 of 12
Table 3. Results of the Table Tennis Specific Battery Test (TTSBT) (the number of balls that touch the
table in 15 s): comparison by gender and training stages.
Boys Girls U Manna-Whitneya Test
Variable
M ± SD M ± SD Z p
Test 1 13.4 ± 3.32 13.6 ± 3.08 −0.34 0.734
Test 2 13.1 ± 3.91 13.4 ± 3.17 −0.40 0.686
Test 3 10.9 ± 3.03 10.4 ± 3.05 −0.68 0.496
Targeted Stage Specialized Stage Z p
Test 1 12.5 ± 3.16 14.8 ± 2.77 −3.28 * 0.001
Test 2 12.0 ± 3.52 14.9 ± 2.98 −3.96 *Int. J. Environ. Res. Public Health 2021, 18, 5279 9 of 12
Table 4. Regression analysis factors for T1, T2 and T3.
B SE β T p
Model for T1:
(constant) 11.66 2.91 4.01 0.000
triceps skinfold [cm] −0.62 0.14 −0.858 −4.47 0.000
biceps girth (relaxed) [cm] 0.62 0.22 0.616 2.79 0.007
waist girth [cm] −0.29 0.10 −0.699 −2.80 0.006
arm span [cm] 0.06 0.02 0.368 2.71 0.008
endomorphic somatotype 1.40 0.56 0.582 2.51 0.014
Model for T2:
(constant) 5.08 2.98 1.70 0.092
age (in years) 0.78 0.20 0.378 3.87 0.000
triceps skinfold [cm] −0.18 0.08 −0.221 −2.26 0.026
Model for T3:
(constant) −1.27 4.54 −0.28 0.781
age (in years) 0.52 0.17 0.298 3.01 0.003
suprailiac skinfold [mm] 0.29 0.10 0.635 2.94 0.004
endomorphic somatotype −1.22 0.49 −0.534 −2.46 0.016
B—the unstandardized beta, SE, B—the standard error for the unstandardized beta, β—the standardized beta,
t—the t test statistic, p—the probability value.
4. Discussion
The present study aimed to determine which somatotype factors influence the phys-
ical special fitness of young Polish table tennis players. The main results showed that:
(i) the examined young table tennis players presented differences in anthropometry and
somatotype according to sex and sport training stages; (ii) somatotype was predominantly
mesomorphic in boys and ectomorphic in girls; (iii) changes in morphological and special
motor fitness characteristics were influenced by age; (iv) links were revealed between the
special motor fitness area and selected anthropometric measurements.
It is also important to remember that the morpho-functional characteristics of young
athletes are influenced by growth and maturity [11,27], and this fact can offer advantages
or disadvantages during competition. The calculated biological age for body height was
91.8% (n = 45) in boys and 79.9% (n = 30) in girls in accordance with current physical
development standards for Polish children and adolescents [20]. For biological age for
body mass, an identical relationship was achieved for boys, whereas for girls, it was 82.2%
(n = 32) of compliance.
The main results showed that the examined young table tennis players were, on
average, diversified in terms of variables related to the morphological structure. These
results agree with previous studies. The results of other studies conducted on a similar age
group mostly indicate a dominant mesomorphic or mesophical–endomorphic physique
type [5,13,14]. Differing values in body type, as well as the absence of one clearly dominant
body type, indicate that in table tennis at an early stage of sports training, players of
different types of somatic construction are trained. In general, the dominant mesomorphic
type of physique, particularly among boys, can be explained by the fact that its wide
shoulders, long torso, strongly developed and relatively wide hips, and strongly developed,
but proportional, lower and upper limbs help young players to manifest themselves in
table tennis, which requires a high level of coordination and speed [6,28,29].
However, a gender gap in results can be observed. The mean body-building type
index among the boys studied for the ectomorphic type was 3.4, for the mesophical
type 4.1, and for the endomorphic type 3.5. In contrast, among girls, the mean body-
building index for the ectomorphic type was 3.8, for the mesomorphic type 3.0, and for the
endomorphic type 3.3. This result concurs with previous findings e.g., [5,13], which seems
to indicate a potential advantage of this types of body constitution in high-level young
table tennis players.
In modern elite table tennis, the appropriate level of a player’s technical skills is
extremely important. Therefore, coaches place emphasis on this factor from the moment aInt. J. Environ. Res. Public Health 2021, 18, 5279 10 of 12
young player begins playing table tennis as they strive to reach the elite level. Technical
skills are considered a classic limitation in early development, and a period of targeted and
specialized stages of sport training is an important time frame for high-potential young
athletes to develop their technical skills as a fundament to be able to reach the elite level [6].
The correlation analysis showed statistically significant links between the area of
special motor fitness and the selected anthropometric measurements, as confirmed in other
studies conducted in this age group (e.g., [15] (Jordan players); [12] (Brazilian players)).
Based on the results of our studies, it can be concluded that in table tennis, the level of
special motor fitness is not determined by a single, dominant somatotype; hence, it is most
likely not a key success factor at this level of athletic sophistication. Therefore, it is not
possible to discuss the model type of the somatotype of the tested table tennis players. The
predominance of the mesomorphic component, or in some cases ectomorphy, reveals the
potential advantage of these types of construction, without, however, directly translating
into the results of the test trials.
As Pradas et al. [6] noted, this predominance could be explained by the potential
biomechanical and technical–tactical advantage of taller players with longer arm span,
being able to return a higher number of balls (i.e., covering a wider playing area around the
table) and most likely able to produce more force when hitting the ball. Carrasco et al. [13]
indicated that although the influence of anthropometric characteristics on young table
tennis players is not clear yet, the mesomorphic predominance could play a highly impor-
tant role in this sport. Investigations carried out using different athletes of the same age
reported similar results (e.g., [30]).
Our study on young tennis table players indicated a positive correlation between
special motor fitness and the independent variables. However, in the three regression
models examined, these correlations explained only a part of the variance. Table tennis is a
particularly fast-paced sport that has a small margin of error due to the small size of the
ball and racket in relation to the limited playing surface. Thus, to ensure a high level of
ball velocity during strokes, correct upper limb muscle mass and arm reach are necessary.
Our study showed a relationship between the body height, thickness of the skinfolds of
the triceps and suprailiac, biceps, and waist circumference and arm span in the T1, T2,
and T3 tests. As Robertson et al. [4] noted, taller players with longer arms can generate
more power during the game. Furthermore, table tennis players require considerable
upper-limb muscle activity to be able to perform brief explosive movements, change
direction rapidly, and effectively hit the ball during decisive strokes such as forehand
smashes and forehand top-spin strokes on repeated occasions during the game. In turn,
high body weight values would impair performance by speed while possibly increasing
the risk of injury. These associations are consistent with the results of other researchers
(e.g., [4,6]). Clearly, there are other factors that might mediate these relationships, such
as ranking positions, performance level, school environment, differences in maturation,
sporting traditions of the local community or a particular family, individual interests, and
engagement in sports [4,6,31,32].
In this study, we only focused on anthropometry and special motor fitness, which are
important for excelling in racquet sports, particularly table tennis. The main limitation
of this study that should be highlighted is that it only assessed young Polish table tennis
players, and further studies should be performed with athletes of different nationalities.
5. Conclusions
The results presented an idea of an under-explored way of combining important
variables in the context of child and youth sport, namely an assessment of the level of
motor fitness and anthropometric profile. Somatotype was predominantly mesomorphic
in the examined boys and ectomorphic in girls. Higher muscle mass in the upper limbs
appeared to be associated with better special motor fitness in young table tennis players.
These results could suggest the importance of muscle mass and body height in table tennis
players during formative stages.Int. J. Environ. Res. Public Health 2021, 18, 5279 11 of 12
Knowledge of the somatic and motor characteristics of young table tennis athletes
can help coaches in creating specific training programs for optimal physical preparation
to improve health and performance, taking into consideration the athletes’ biological
development, potential, and predisposition. These results could suggest the importance
of anthropometric profile in young table tennis players, particularly during the selection
stage; hence, it is worth paying more attention to the physical characteristics because, as
studies have shown, they determine a better level of technical preparation of young table
tennis players.
Author Contributions: Conceptualization, B.P., M.K. and S.G.; methodology, B.P., M.K. and S.G.;
software, B.P., M.K. and K.P.; validation, B.P., M.A. and M.K.; formal analysis, B.P.; investigation,
B.P., M.K. and S.G.; resources, B.P., K.P.; data curation, B.P., M.K. and K.P.; writing—original draft
preparation, B.P.; writing—review and editing, M.A., M.K. and K.P.; visualization, B.P. and K.P.;
supervision, B.P. and M.A.; project administration, B.P. All authors have read and agreed to the
published version of the manuscript.
Funding: This research did not receive any specific grant from founding agencies in the public,
commercial, or not-for-profit sectors.
Institutional Review Board Statement: The study was conducted in compliance with the Dec-
laration of Helsinki and was approved by the local ethics committee: The Bioethics Committee
of the Karol Marcinkowski Medical University, Poznań, Poland (No. 543/18). All data were
analyzed confidentially.
Informed Consent Statement: Informed consent was obtained from all subjects involved in the study.
Data Availability Statement: The data presented in this study are available on request from the corre-
sponding author. The data are not publicly available due to no access to publicly accessible repository.
Conflicts of Interest: The authors declare no conflict of interest.
References
1. Ryu, D.; Abernethy, B.; Park, S.H.; Mann, D.L. The Perception of Deceptive Information Can Be Enhanced by Training That
Removes Superficial Visual Information. Front. Psychol. 2018, 9, 1132. [CrossRef] [PubMed]
2. Lees, A. The evolution of racket sport science—A personal reflection. Ger. J. Exerc. Sport Res. 2019, 49, 213–220. [CrossRef]
3. Selder, D.J.; Roll, G.F.; Lindsay Carter, J.E. Profiles of Super Senior Tennis Players. Physician Sportsmed. 2017, 8, 101–105. [CrossRef]
[PubMed]
4. Robertson, K.; Pion, J.; Mostaert, M.; NorjaliWazir, M.R.W.; Kramer, T.; Faber, I.R.; Vansteenkiste, P.; Lenoir, M. A coaches’
perspective on the contribution of anthropometry, physical performance, and motor coordination in racquet sports. J. Sport Sci.
2018, 36, 2706–2715. [CrossRef]
5. Chatterjee, P.; Goswami, A.; Bandyopadhyay, A. Somatotyping and some physical characteristics of trained male and female
young table tennis players. Am. J. Sport Sci. 2016, 4, 15–21. [CrossRef]
6. Pradas, F.; de la Torre, A.; Carrasco, L.; Muñoz, D.; Courel-Ibáñez, J.; González-Jurado, J.A. Anthropometric Profiles in Table
Tennis Players: Analysis of Sex, Age, and Ranking. Appl. Sci. 2021, 11, 876. [CrossRef]
7. Sánchez-Muñoz, C.; Muros, J.J.; Cañas, J.; Courel-Ibáñez, J.; Sánchez-Alcaraz, B.J.; Zabala, M. Anthropometric and Physical
Fitness Profiles of World-Class Male Padel Players. Int. J. Environ. Res. Public Health 2020, 17, 508. [CrossRef] [PubMed]
8. Zavadskaya, N.; Grishko, L. Table tennis in the system of physical education of female students of technical institutions of higher
education. Sci. J. NPDU Phys. Cult. Sports 2020, 8, 69–71. [CrossRef]
9. Bonato, M.; Maggioni, M.A.; Rossi, C.; Rampichini, S.; La Torre, A.; Merati, G. Relationship between anthropometric or functional
characteristics and maximal serve velocity in professional tennis players. J. Sports Med. Phys. Fitness 2015, 55, 1157–1165.
10. Sepúlveda, R.Y.; Barraza, F.; Soto, G.R.; Báez, E.; Tuesta, M. Anthropometric chilean table tennis players of competitive features.
Nutr. Hosp. 2015, 32, 1689–1694.
11. Coelho-e-Silva, M.J.; Konarski, J.M.; Krzykała, M.; Galas, S.; Pluta, B.; Żurek, P.; Faria, J.; Tavares, O.M.; Oliveira, T.G.;
Rodrigues, I.; et al. Growth and maturity status of young male table tennis players. Res. Sports Med. 2021. [CrossRef] [PubMed]
12. Zagatto, A.M.; Milioni, F.; Freitas, I.F.; Arcangelo, S.A.; Padulo, J. Body composition of table tennis players: Comparison between
performance level and gender. Sport Sci. Health 2015, 12, 49–54. [CrossRef]
13. Carrasco, L.; Pradas, F.; Martínez, A. Somatotype and body composition of young top-level table tennis players. Int. J. Table Tennis
Sci. 2010, 6, 175–177.
14. Munivrana, G.; Paušić, J. The Influence of Somatotype on Young Table Tennis Players’ Competitive Success. Kinesiol. Slov. 2011,
51, 42–51.Int. J. Environ. Res. Public Health 2021, 18, 5279 12 of 12
15. Khasawneh, A. Anthropometric measurements and their relation to static and dynamic balance among junior tennis players.
Sport Sci. 2015, 8 (Suppl. 1), 87–91.
16. Söğüt, M.; Luz, L.G.; Kaya, Ö.B.; Altunsoy, K. Ranking in young tennis players—A study to determine possible correlates. Ger. J.
Exerc. Sport Res. 2019, 49, 325–331. [CrossRef]
17. Behdari, R.; Ahadi, M.; Husseini, M.; Göktepe, M. Comparison and description of fitness level physiological and anthropometric
profiles of selected versus non selected Iranian national team table tennis players. Int. J. Sport Cult. Sci. 2015, 4, 371–382.
[CrossRef]
18. Martin, R.; Saller, K. Lehrbuch der Anthropologie; Gustav Fischer Verlag: Stuttgart, Germany, 1957.
19. Demerath, E.W.; Guo, S.S.; Chumlea, W.C.; Towne, B.; Roche, A.F.; Siervogel, R.M. Comparison of percent body fat estimates
using air displacement plethysmography and hydrodensitometry in adults and children. Int. J. Obes. 2002, 26, 389–397. [CrossRef]
20. Kułaga, Z.; Różdżyńska-Swiatkowska,
˛ A.; Grajda, A.; Gurzkowska, B.; Wojtyło, M.; Góźdź, M.; Swiader-Leśniak,
˛ A.; Litwin, M.
Percentile charts for growth and nutritional status assessment in Polish children and adolescents from birth to 18 year of age.
Stand. Med. Pediatr. 2015, 12, 119–135.
21. Cole, T.J.; Lobstein, T. Extended international (IOTF) body mass index cut-offs for thinness, overweight and obesity. Pediatr. Obes.
2012, 7, 284–294. [CrossRef]
22. Heath, B.H.; Carter, J.E.L. A modified somatotype method. Am. J. Phys. Anthropol. 1967, 27, 57–74. [CrossRef]
23. Toth, T.; Michalíková, M.; Bednarčíková, L.; Zivcak, J.; Kneppo, P. Somatotypes in Sport. Acta Mech. Autom. 2014, 8, 27–32.
[CrossRef]
24. Martinez-Rodriguez, A.; Roche Collado, E.; Vicente-Salar, N. Body composition assessment of paddle and tennis adult male
players. Nutr. Hosp. 2015, 31, 1294–1301.
25. Gomes, F.; Amaral, F.; Venture, A.; Agular, J. Table Tennis specific test battery. Int. J. Table Tennis Sci. 2000, 4, 11–18.
26. Katsikadelis, M.; Pilianidis, T.; Mantzouranis, N. Test-retest reliability of the “table tennis specific battery test” in competitive
level young players. Eur. Psychomot. J. 2014, 6, 3–11.
27. Coelho-e-Silva, M.J.; Moreira Carvalho, H.; Goncalves, C.E.; Figueiredo, A.J.; Elferink-Gemser, M.T.; Philippaerts, R.M.; Malina,
R.M. Growth, maturation, functional capacities and sport-specific skills in 12-13-year-old basketball players. J. Sports Med. Phys.
Fitness 2010, 50, 174–181.
28. Kondrič, M.; Zagatto, A.M.; Sekulić, D. The physiological demands of table tennis: A review. J. Sports Sci. Med. 2013, 12, 362.
29. Faber, I.; Damsma, T.; Pion, J. Finding Talent and Establishing the Road to Excellence in Table Tennis. In Talent Identification and
Development in Sport; Baker, J., Cobley, S., Schorer, J., Eds.; Routledge: New York, NY, USA, 2020; pp. 115–129.
30. de Hoyo, M.; Cohen, D.D.; Sañudo, B.; Carrasco, L.; Álvarez-Mesa, A.; del Ojo, J.J.; Domínguez-Cobo, S.; Mañas, V.; Otero-Esquina,
C. Influence of football match time–motion parameters on recovery time course of muscle damage and jump ability. J. Sports Sci.
2016, 14, 1363–1370. [CrossRef]
31. Sanchis-Moysi, J.; Dorado, C.; Olmedillas, H.; Serrano-Sanchez, J.A.; Calbet, J.A. Bone and lean mass inter-arm asymmetries in
young male tennis players depend on training frequency. Eur. J. Appl. Physiol. 2010, 110, 83–90. [CrossRef] [PubMed]
32. Pluta, B.; Galas, S.; Krzykała, M.; Andrzejewski, M. The Motor and Leisure Time Conditioning of Young Table Tennis Players’
Physical Fitness. Int. J. Environ. Res. Public Health 2020, 17, 5733. [CrossRef]You can also read