Interaction between Vegetarian Versus Omnivorous Diet and Unhealthy Eating Patterns (Orthorexia Nervosa, Cognitive Restraint) and Body Mass Index ...
←
→
Page content transcription
If your browser does not render page correctly, please read the page content below
Article

Interaction between Vegetarian Versus Omnivorous
Diet and Unhealthy Eating Patterns (Orthorexia
Nervosa, Cognitive Restraint) and Body
Mass Index in Adults
Anna Brytek-Matera
 Institute of Psychology, University of Wroclaw, 50-527 Wroclaw, Poland; anna.brytek-matera@uwr.edu.pl

 Received: 25 January 2020; Accepted: 26 February 2020; Published: 28 February 2020

 Abstract: The objective of the present study was two-fold: Firstly, to investigate unhealthy eating
 patterns and body mass index among individuals following a vegetarian diet and those following
 an omnivorous diet. Secondly, to examine interaction between vegetarian versus omnivorous diet
 and unhealthy eating patterns (orthorexia nervosa, cognitive restraint) and body mass index using
 a structural equation modeling approach (SEM). The study included 370 participants: 188
 participants following a vegetarian diet and 182 following an omnivorous diet. Unhealthy eating
 patterns and body mass index were measured. Our results showed that individuals following a
 vegetarian diet were more likely to engage in orthorexic eating behavior compared to individuals
 following an omnivorous diet. In addition, they had a significantly lower levels of cognitive restraint
 and lower body mass index than individuals following an omnivorous diet. Use of SEM method
 showed that: (1) following a vegetarian diet and orthorexia nervosa were directly associated, (2)
 following an omnivorous diet and cognitive restraint were directly related and (3) following an
 omnivorous diet had a greater tendency to cognitive restraint and an elevated body mass index.
 More research is necessary to further understand the complexity of the relationship between type
 of diet and unhealthy eating patterns in adults.

 Keywords: vegetarian diet; orthorexia nervosa; cognitive restraint; body mass index

1. Introduction
     In recent years, there has been an increased number of individuals following a vegetarian diet
[1]. The main motives for following a free-meat diet include health, moral, economy, ecology,
environment, society, culture, ethics and religion [1]. According to the American Dietetic Association,
an appropriately planned vegetarian diets are healthful, nutritionally adequate, and may provide
health benefits in the prevention and treatment of certain diseases [2]. For many individuals, health
considerations are one of the motivations for choosing particular dietary pattern [3]. Nevertheless, in
some cases, interest in healthy food consumption and health could lead to orthorexia nervosa—an
obsessional focus on a diet considered to be healthy, focusing on concerns regarding the quality of
food, with overly care for one’s health [4]. This unhealthy eating pattern is associated with excessive
time spent preparing food, inflexible dietary rules, recurrent and persistent preoccupations related
to “pure” or “clean” food, rigid avoidance of foods considered “unhealthy”, compulsive behaviors,
distress at violation of food rules, as well as consequent, clinically significant, impairment (e.g.,
medical or psychological complications, social isolation, and/or impairment in important areas of
functioning) [5–7]. Recently, the bidimensional nature of orthorexia nervosa was proposed: with one
dimension related to healthy interest in diet and healthy behavior with regard to diet (a protective

Nutrients 2020, 12, 646; doi:10.3390/nu12030646                               www.mdpi.com/journal/nutrients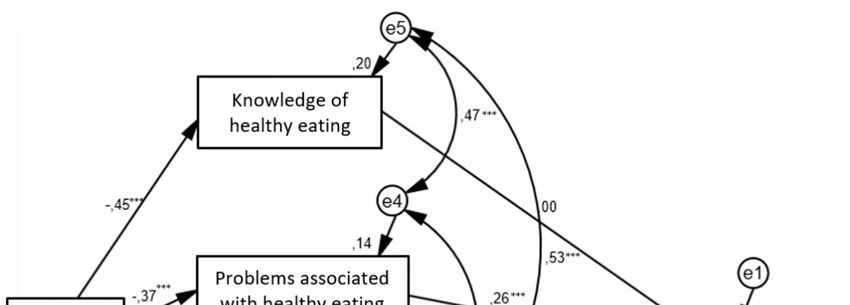
Nutrients 2020, 12, 646                                                                             2 of 13

factor against emotional distress) named healthy orthorexia (HeOr) and another dimension related
to a pathological preoccupation with eating healthily (a new variant of disordered eating related to
negative affect) named orthorexia nervosa (OrNe) [8–10]. The findings have demonstrated that OrNe
is more common among vegetarians and vegans, compared to people who are not adhering to a
special diet [9]. In addition, the latest review of the literature [11] reveals that following a vegetarian
diet was found to be associated with orthorexic eating behaviors (in 11 out of 14 studies published
within the last five years). Furthermore, in seven studies (out of 14), individuals following a
vegetarian diet in the general population have been found to report more orthorexic behaviors or to
be at risk of developing orthorexia nervosa than those who follow an omnivorous diet [11].
      For some individuals, adoption of a vegetarian diet is a socially acceptable attempt to mask their
disordered eating behaviors [12]. Disordered eating is characterized by a disturbed and unhealthy
eating pattern that can include restrictive dieting, compulsive eating or skipping meals [13].
Cognitive restraint is defined as the intention to constantly deliberately control food intake in order
to maintain or lose weight [14]. This leads to a reduction in the intake of specific macronutrients (e.g.,
fats or carbohydrates) or types of foods, and not to a reduction in overall caloric intake [15]. Cognitive
restraint is frequently used as a marker of pathological eating behaviors [16]. Consequences of
cognitive restraint are associated with: (a) dysregulation of internal perceptions of hunger and satiety
which is followed by four consecutive phases: (1) low cognitive restraint—perceived food sensations
and emotions and deliberately ignorance of sensations; (2) moderate cognitive restraint—perceived
food sensations and emotions and lack of following the sensations due to induced negative emotions;
(3) severe cognitive restraint—not perceived food sensations and emotions and struggle with
maintenance of mental control (not surrendering to the emotions induction); (4) decompensated
cognitive restraint—not perceived food sensations and emotions and the eating behavior is under the
control of not food-evoked emotions and induced emotions; (b) disinhibition which results in the
growth in food consumption (overeating); (c) emotional dysregulation—individuals that use
cognitive restraint fail to reduce their anxiety levels by eating and their eating behaviors are
completely managed by not food-evoked emotions or induced by food (four consecutive phases of
cognitive restraint); and (d) low self-esteem and low body satisfaction [14]. Previous studies have
shown the link between vegetarianism and eating-related pathology [16]. The findings have
demonstrated that vegetarian diet is associated with higher levels of cognitive restraint [17]. Some
studies have presented that individuals following a vegetarian diet endorses higher levels of
cognitive restraint that those following an omnivorous diet [18], whereas other studies have found
no difference in cognitive restraint between these both groups [17,19,20]. Although orthorexia
nervosa shares a key component with cognitive restraint (self-imposed restriction of allowed food)
[10], these both should be considered as distinct constructs.
      Restraint theory [21] suggests that restraint (under cognitive rather than physiological control)
leads reduced sensitivity to internal cues for satiety, resulting in disinhibition and overeating in
situations where cognitive control is undermined (e.g., stressful events) [22]. The cross-sectional
relationship between cognitive restraint and body mass index has been examined in several studies,
and positive, negative and null associations between both variables have been described [22].
Nevertheless, it is worth to pointing out that in normal weight groups increased cognitive restraint
has been found to be associated with increased body mass index [23,24]. That could be explained by
the fact that high cognitive restraint in normal weight individuals increases the risk of overeating
tendencies when restraint is relaxed, thus leading to further increases in body mass index [22].
      Previous studies have indicated that body mass index increases when a wider spectrum of
animal products were consumed. The results of the European Prospective Investigation into Cancer
and Nutrition (EPIC—Oxford) [25] have shown that age-adjusted mean body mass index was highest
in the individuals following an omnivorous diet and lowest in the individuals following a vegan diet.
In addition, individuals following a pescatarian diet, vegetarian diet and especially vegan diet had
lower body mass index than those following an omnivorous diet. Other studies [26,27] have recorded
similar findings. All variants of vegetarian diets (vegan, lactoovo-, pesco- and semi-vegetarian diets)
were associated with lower body mass index than nonvegetarian diets. The protective effects of
Nutrients 2020, 12, 646 3 of 13
vegetarianism against overweight may be due to avoidance of major food groups, displacement of
calories to-ward food groups that are more satiating [27].
Scholars have used a diversity of methodological approaches and different measurement tools
(ORTO-15, Eating Habits Questionnaire (EHQ), Düsseldorfer Orthorexia Scale (DOS), orthorexia self-
test) that had different levels of validity and reliability [11] to study orthorexia nervosa. The
Orthorexia Self-Test (BOT) has not evaluated the necessary psychometric properties and the cut-off
scores of a reference group. A lack the basic psychometric properties of the ORTO-15 (the most widely
used self-report measure of orthorexia nervosa), a low reliability and the internal consistency has
been criticized. Wherefore, taking into consideration all listed limitations, in the present study, we
used the Eating Habits Questionnaire (EHQ), a new research tool developed for the measurement of
orthorexia nervosa and displayed good internal consistency and test-retest reliability in a college
student sample. The latest review of the literature [11] provides evidence that for having more strong
evidence researchers should use the EHQ and/or the DOS instead of the ORTO-15.
In our latest research [28], we used a multiple linear regression to determine the predictors of
orthorexia nervosa in samples with a meat-free diet. In addition, we explored the moderating role of
the ethical and health reasons for following a vegetarian diet on the relation between vegan versus
vegetarian diet and eating behaviors and orthorexia nervosa [28]. Therefore, the objectives of the
present study were to: (1) assess unhealthy eating patterns and body mass index among individuals
following a vegetarian diet and those following an omnivorous diet; (2) examine the relation between
type of diet (vegetarian versus omnivorous diet) and unhealthy eating patterns (orthorexia nervosa,
cognitive restraint) and body mass index using the structural equation modeling (SEM) technique. In
this SEM model we postulate that: (H1) vegetarian diet and orthorexia nervosa are directly related;
(H2) vegetarian diet and cognitive restraint are directly related; and (H3) body mass index is directly
affected by the cognitive restraint and vegetarian diet. The conceptual model of the present study is
shown in Figure 1. In the conceptual model, there are six variables, including the main dependent
variable (type of diet) with the independent variable: knowledge of healthy eating, problems
associated with healthy eating, feeling positively about healthy eating (three aspects of orthorexia
nervosa), cognitive restraint and body mass index.
Orthorexia nervosa
Knowledge of
healthy eating
Type of diet
Problems associated Cognitive Body mass
(vegetarian vs
with healthy eating restraint index
omnivorous diet)
Feeling positively
about healthy eating
Figure 1. Conceptual model for the association between vegetarian versus omnivorous diet and
unhealthy eating patterns (orthorexia nervosa, cognitive restraint) and body mass index in adult
population.
2. Materials and MethodsNutrients 2020, 12, 646 4 of 13
2.1. Participants and Study Design
We used G*Power [29] and ran a series of simulations using R statistical software to determine
the sample size needed to be able conduct our least sensitive statistical tests at a power of 80% (α =
0.05, two-tailed). These analyses revealed that we would need a sample size of 191 participants (effect
size = 0.3, significance level = 0.05, power = 0.95). We have assumed an attrition/unusable data rate of
20% over the study period (N = 268). Finally, the sample was composed of 370 participants: 188
participants following a vegetarian diet (Mage = 28.87 ± 10.32; MBMI = 21.72 ± 3.24) and 182 participants
following an omnivorous diet (Mage = 27.05 ± 8.87; MBMI = 23.07 ± 4.98).
Data of samples were collected via online survey (SurveyMonkey). Participants were randomly
selected. The notice about the research was distributed among various Silesian (Poland) institutions
(vegetarian restaurants, vegan and vegetarian associations, organic grocery stores, fitness centers,
dance studios, sports clubs, universities, companies) and vegetarian social networking. The
announcement included a link to study information, consent procedures (anonymous and voluntary
nature of participation, freedom to refuse or withdraw without penalties) and the questionnaires.
Informed consent was obtained from all participants (via an online consent form). At any time and
for any reason, they could refuse to answer a question or stop filling out the questionnaire and not
send their data using the ‘send’ button.
Vegetarian diet was assessed through self-report. However, it is noted that individuals following
a vegetarian diet were selected through predefined objective criteria (participants had to answer
several questions regarding their eating behaviors and had to follow a vegetarian diet for at least 12
months). Furthermore, participants were asked to identify themselves as vegetarian (a “yes/no”
item). The reason participants were excluded due to “consistency of self-defined types of diet and
objective criteria” was following: discrepancy between self-description of the diet and self-
identification as one of the following: vegetarian or vegan (e.g., those who described themselves as
vegetarians and declared to often eat fish were eliminated). The procedure was based on the Barthel
et al. [17] criteria (vegetarianism: exclusion of meat from the diet) and described in our latest
publication [20].
The touch pen (worth approximately €6.00) was compensation for participation in the research.
The study protocol has received the approval of a research ethics committee (no. WKEB45/03/2017).
In addition, all procedures performed in this study were in accordance with the 1964 Helsinki
declaration and its later amendments or comparable ethical standards. The research project was
funded by the National Science Centre (NCN), Poland (Grant no. 2017/01/X/HS6/00007). The current
study is part of a large project focusing on the assessment of rumination and eating behaviors in daily
life among individuals with differential food preferences.
2.2. Outcome Measures
All participants were questioned about their age, height and weight (to calculate their body mass
index) as well as their eating habits
2.2.1. The Three-Factor Eating Questionnaire (TFEQ-R18)
The TFEQ-R18 [30] assesses three different aspects of eating behaviors: cognitive restraint
(conscious restriction of food intake in order to control body weight or to promote weight loss; e.g.,
“I consciously hold back at meals in order not to gain weight”), emotional eating (inability to resist
emotional cues; e.g., “When I feel anxious, I find myself eating”) and uncontrolled eating (tendency
to eat more than usual due to a loss of control over intake accompanied by subjective feelings of
hunger; e.g., “When I see a real delicacy, I often get so hungry that I have to eat right away”). In the
present study, we used the Polish version of the TFEQ-R18 [28] which has demonstrated satisfactory
levels of internal reliability (α = 0.78 for cognitive restraint, α = 0.84 for uncontrolled eating and α =
0.86 for emotional eating). In the present study, we only used cognitive restraint scale (its Cronbach’s
α values was 0.77).Nutrients 2020, 12, 646 5 of 13
2.2.2. The Eating Habits Questionnaire (EHQ)
The Eating Habits Questionnaire [31] assesses cognitions (knowledge of healthy eating; “I
prepare food in the most healthful way”), behaviors (problems associated with healthy eating; e.g.,
“I turn down social offers that involve eating unhealthy food”) and feelings (feeling positively about
healthy eating; e.g., “Eating the way I do gives me a sense of satisfaction”) related to an extreme focus
on healthy eating, which has been called orthorexia nervosa. The EHQ displayed good internal
consistency and test-retest reliability in a college student sample [31]. The exploratory and
confirmatory factor analyses support and shed further light on the construct validity of the tests. In
the present study, the Cronbach’s α values of the three subscales were: 0.81 for knowledge of healthy
eating, 0.82 for problems associated with healthy eating and 0.70 for feeling positively about healthy
eating.
3. Results
3.1. Statistical Analysis
All analyses were carried out using the Statistical Package for Social Sciences (version 22.0 with
AMOS; IBM®, Armonk, NY, U.S.A.). Descriptive findings for continuous data were reported using
means and standard deviations which were determined using an independent sample t-test.
Structural equation modeling (SEM) was performed to examine the structural relationship between
type of diet (vegetarian versus omnivorous), unhealthy eating patterns (cognitive restraint as well as
cognitions, behaviors and feelings related to orthorexia nervosa) and body mass index in adults. In
the first step of the SEM, the assessment of normality (multivariate normal distribution) was
performed. The asymptotically distribution-free (ADF) method was used because the critical ratio
(CR) [−2, 2] and skew/kurtosis [−1, 1] for all variables did not fit in the adequate range [32]. In this
work to evaluate the goodness-of-fit of a model the root mean square error of approximation
(RMSEA) statistic and the comparative fit index (CFI) were used as these are the most commonly
used indices [32]. The RMSEA estimates the lack of fit in a model compared to a saturated model.
Values of RMSEA of 0.06 or less indicate a good-fitting model and a value larger than 0.10 is indicative
of a poor model [32]. While, the comparative fit index (CFI) assesses fit relative to other models. CFI
values greater than 0.90 indicate reasonably good fit of the model [32]. All statistics indicate that the
goodness of fit is appropriate (Table 1).
Table 1. Goodness of fit statistics1.
χ2 df p χ2/df Hoelter’s N2 F03 RMSEA4 pclose
3.93 3 0.269 1.31 734 0.00 0.03 0.603
GFI NFI CFI AIC5 BIC6
0.99 0.99 0.99 39.93 110.37
Note: 1 The current recommendations of goodness of fit (GOF) of a statistical model [32] were used in
the present study: (1) p (for χ2) > 0.05, (2) χ2/df ≤ 2, (3) Hoelter’s N > 200, (4) F0 confidence interval
includes ‘0′, (4) RMSEA (root mean square error of approximation ) < 0.06, (5) pclose > 0.05, (6) CFI
(comparative fit index), NFI (normed fit index), GFI (goodness-of-fit index) ≥ 0.95, (7) AIC (Akaike
information criterion), BIC (Bayes information criterion) hypothesized models are much closer to
saturated model than independence one. 2 Confidence interval 95%; 3 F0 with approximately 90%
confidence (0.00; 0.03); 4 RMSEA with approximately 90% confidence (0.00; 0.097); 5 saturated model:
42.00, independence model: 415.51; 6 saturated model: 124.18, independence model: 438.99.
3.2. Characteristics of the Study Population
The characteristics of the participants are shown in Table 2.Nutrients 2020, 12, 646 6 of 13
Table 2. Characteristics of the study population.
Vegetarian Diet Omnivorous Diet
Variable
N = 188 N = 182
Mean (SD)
Age 28.87 (10.32) 27.05 (8.87)
Body mass index (kg/m2) 21.72 (3.24) 23.07 (4.98)
N (%)
Number of meals consumed per day
1 0 (0) 2 (1.1)
2 9 (4.8) 7 (3.8)
3 46 (24.5) 56 (30.8)
4 76 (40.4) 71 (39.0)
5 46 (24.5) 37 (20.3)
More than 5 11 (5.9) 9 (4.9)
Daily breakfast consumption
No 7 (3.7) 10 (5.5)
Sometimes 24 (12.8) 26 (14.3)
Yes 157 (83.5) 146 (80.2)
Daily second breakfast consumption
No 29 (15.4) 36 (19.8)
Sometimes 52 (27.7) 53 (29.1)
Yes 107 (56.9) 93 (51.1)
Daily lunch consumption
No 4 (2.1) 5 (2.7)
Sometimes 9 (4.8) 15 (8.2)
Yes 175 (93.1) 162 (89.0)
Daily afternoon snack consumption
No 49 (26.1) 57 (31.3)
Sometimes 76 (39.9) 63 (34.6)
Yes 64 (34.0) 62 (34.1)
Daily diner consumption
No 6 (3.2) 7 (3.8)
Sometimes 32 (17.0) 35 (19.2)
Yes 150 (79.8) 140 (76.9)
Snacking between meals
Never 12 (6.4) 8 (4.4)
Rarely 63 (33.5) 72 (39.6)
Sometimes 69 (36.7) 58 (31.9)
Often 29 (15.4) 22 (12.1)
Always 15 (8.0) 22 (12.1)
Between-meal snacks
Nothing 4 (2.1) 0 (0)
Fruits 88 (46.8) 60 (33.0)
Vegetables 11 (5.9) 4 (2.2)
Sweets 39 (20.7) 75 (41.2)
Salty snacks 28 (14.9) 28 (15.4)
Other 18 (9.6) 15 (8.2)
Dietary supplement consumption
No 69 (36.7) 121 (66.5)
Yes 119 (63.3) 61 (33.50
Weight less method
No 138 (73.5) 114 (62.6)
Yes 50 (26.5) 68 (37.4)
Diet 14 (7.4) 14 (7.8)
Physical activity 35 (18.6) 52 (28.6)
Laxatives 0 (0) 1 (0.5)
Vomit 0 (0) 0 (0)
Starvation diet 1 (0.5) 1 (0.5)
Daily weighing
No 177 (94.1) 165 (90.7)
Yes 11 (5.9) 17 (9.3)
Alcohol consumption
Never 60 (31.9) 25 (13.7)
Once a month 54 (28.7) 59 (32.4)Nutrients 2020, 12, 646 7 of 13
From twice to four times a month 53 (28.2) 68 (37.4)
From twice to three time a week 17 (9.0) 22 (12.1)
Four or more time a week 4 (2.1) 8 (4.4)
Cigarette consumption
Never 145 (77.1) 110 (60.4)
Once a month 14 (7.4) 18 (9.9)
From twice to four times a month 5 (2.7) 17 (9.3)
From twice to three time a week 5 (2.7) 10 (5.5)
Four or more time a week 19 (10.1) 27 (14.8)
Drug consumption
Never 171 (91.0) 157 (86.3)
Once a month 16 (8.5) 19 (10.4)
From twice to four times a month 1 (0.5) 4 (2.2)
From twice to three time a week 0 (0) 1 (0.5)
Four or more time a week 0 (0) 1 (0.5)
No significant between-group difference was observed in terms of age, (t(368) = 181; p > 0.05,
Cohen’s d = 0.18). Whereas, there was a significant difference in body mass index between the two
groups, (t(368) = − 3.09; p < 0.001, Cohen’s d = 0.32).
3.3. Comparison between Participants Following a Vegetarian Versus Omnivorous Diet: An Independent
Sample t-test
The mean (M) (and standard deviation; SD) unhealthy eating patterns and body mass index
across the different diets is outlined in Table 3. There was a significant group difference in orthorexia
nervosa, especially in the dimensions linked to knowledge of healthy eating, t(368) = 9.42; p < 0.001,
Cohen’s d = 0.98, problems associated with healthy eating, t(368) = 7.48; p < 0.001, Cohen’s d = 0.78,
and feeling positively about healthy eating, t(368) = 6.42; p < 0.001, Cohen’s d = 0.67. In addition, there
were significant differences between the groups in cognitive restraint, t(368) = −5.30; p < 0.001,
Cohen’s d = 0.55, and body mass index, t(368) = −3.10; p < 0.01, Cohen’s d = 0.32. Individuals following
a vegetarian diet reported more orthorexic behaviors compared with those following an omnivorous
diet. They had a significantly lower levels of cognitive restraint compared to the second group.
Furthermore, individuals following a vegetarian diet had lower body mass index than individuals
following an omnivorous diet.
Table 3. Unhealthy eating patterns and body mass index across the dietary patterns.
Vegetarian Diet Omnivorous Diet
Variable p-Value
(N = 188) (N = 182)
M (SD)
Knowledge of healthy eating 13.16 (2.95) 10.26 (2.98) < 0.001
Problems associated with healthy eating 20.97 (4.41) 17.27 (5.08) < 0.001
Feeling positively about healthy eating 11.22 (2.69) 9.46 (2.57) < 0.001
Cognitive restraint 6.99 (3.85) 9.09 (3.75) < 0.001
Body mass index 21.72 (3.24) 23.07 (4.97) < 0.01
3.4.. Relationship between Diet, Unhealthy Eating Behaviours and Body Mass Index: a Structural Equation
Modeling
The structural relationships between the different type of diets and unhealthy eating behaviors
and body mass index are presented in Figure 2. For this model the estimated RMSEA is 0.03 with the
90% confidence interval (0.00; 0.097) and the p-value for the test of closeness of fit of 0.603. Given that
the upper bound of the 90% confidence interval is less than the suggested value of 0.06 [32], and the
probability value associated with this test of close fit is > 0.50, it can be concluded that the
hypothesized model fits the data well. In addition, the CFI value is 0.99 which indicates an acceptable
level for model fitting. The path coefficients for the path from type of diet to body mass index, from
type of diet to cognitive restraint, from cognitive restraint to body mass index, from type of diet to
three aspects of orthorexia nervosa, from problems associated healthy eating to cognitive restraint
and from feeling positively about healthy eating to cognitive restraint were all significant. Only the
path from knowledge of healthy eating to cognitive restraint was insignificant. Vegetarian diet wasNutrients 2020, 12, 646 8 of 13
directly associated with higher levels of all aspects of orthorexia nervosa (knowledge of healthy
eating, problems associated with healthy eating and feelings positively about healthy eating).
Moreover, omnivorous diet had a greater tendency to cognitive restraint and an elevated body mass
index. The indirect relationship between dietary patterns and cognitive restraint have shown that
vegetarian diet contributed to stronger tendency to orthorexia nervosa. That predisposed participants
to higher levels of cognitive restraint in the case of problems associated with healthy eating and
feelings positively about healthy eating. Cognitive restraint was positively associated with body mass
index.
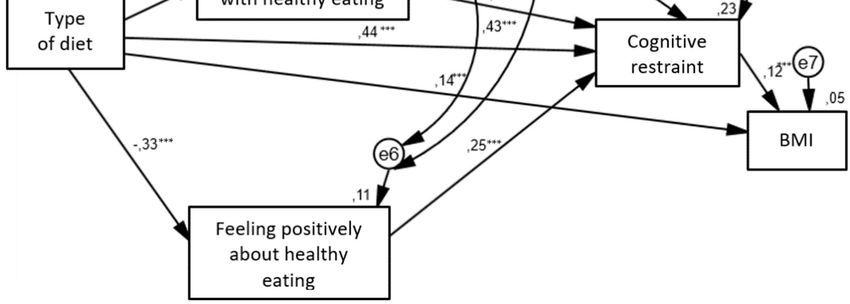
Figure 2. Structural equation model in adult population. —observed variable; —latent
variable; —impact of one variable on another; e—residual error in the prediction of an
unobserved factor; diet—dichotomous variable (1 = vegetarian diet, 2 = omnivorous diet); BMI—body
mass index; * p < 0.05, ** p < 0.01, *** p < 0.001. The values of standardized coefficients and squared
multiple correlations (R2; over the observed variables) are presented.
Table 4 presents the coefficients with standard errors and p-values of the direct effects of
variables on each other.
Table 4. Coefficient, standard error and p-value of the structured equation modeling (SEM)
approach model.
Variable Coefficient Standard Error p-Value
Omnivorous diet - - -
Knowledge of healthy eating −7.73 0.49 < 0.001
Problems associated with healthy eating −9.74 0.30 < 0.001
Feeling positively about healthy eating −6.77 0.27 < 0.001
Cognitive restraint 0.43 0.42 < 0.001
Body mass index 0.14 0.40 0.004
Knowledge of healthy eating
Cognitive restraint 0.5 0.7 > 0.05
Problems associated with healthy eating
Cognitive restraint 4.57 0.4 < 0.001
Feeling positively about healthy eating
Cognitive restraint 4.33 0.8 < 0.001
Cognitive restraint
Body mass index 2.33 0.5 0.02
4. DiscussionNutrients 2020, 12, 646 9 of 13
The first objective of the present study was to evaluate unhealthy eating patterns and body mass
index among individuals following a vegetarian diet and those following an omnivorous diet. Our
findings confirmed that individuals following a vegetarian diet were more likely to engage in
orthorexic eating behavior related to knowledge of healthy eating, problems associated with healthy
eating and feelings positively about healthy eating compared to individuals following an omnivorous
diet. Unlike individuals following an omnivorous diet, individuals following a vegetarian diet often
turn down social events that involve eating unhealthy food, follow a diet with many rules, are
distracted by thoughts of eating healthily, consider their healthy eating as a source of stress in their
relationship, have difficulty finding restaurants that serve the foods they eat, place more restrictions
on the foods they can eat (the EHQ’s items [31] related to problems with healthy eating). In addition,
they go out less since they began eating healthily and spend more than three hours a day thinking
about healthy food and following a health-food diet rigidly (the EHQ’s items [31] related to problems
with healthy eating). Furthermore, they often make efforts to eat more healthily over time, feel in
control when they eat healthily, feel a sense of satisfaction in eating the way they do, feel great and
peaceful when they eat healthily (the EHQ’s items [31] related to feeling positively about healthy
eating). Moreover, individuals following a vegetarian diet, compared to individuals following an
omnivorous diet, are more informed than others about healthy eating, know more about healthy
eating than other people, prepare food in the most healthful way and are convinced that their diet is
more healthy than most diets, their diet is better than other people’s diets and their eating habits are
superior to others (the EHQ’s items [31] related to knowledge of healthy eating). Our results are
consistent with previous research using the same questionnaire (EHQ) [20,33]. Other studies (using
another methods) have also indicated that individuals following a vegetarian diet reported more
orthorexic behaviors than those who follow an omnivorous diet [17,34,35]. It is worth pointing out
that both vegetarian diet and orthorexia nervosa share some similarities: specific food selection
(consuming healthy and organic food), making eating-related issues an important area of one’s own
life, focusing on quality of food intake, reduction of food intake according to specific nutrition rules,
nutrition rules specifying which foods are “allowed” and which are “forbidden, rigid food rules and
an inability to remain flexible in one’s eating habits” [20]. Our findings suggest that following a
special diet (vegetarian diet) could prompt more focus on the quality of food and food consumption
which may indicate that individuals following a vegetarian diet are more likely to display orthorexia
nervosa.
Our results have shown that cognitive restraint differs between the groups with different dietary
patterns. In contrast to the findings of previous studies [18,36], our results have indicated that
individuals following a meat-free diet had a significantly lower control over food intake in order to
influence body weight and body shape compared to individuals following an omnivorous diet. This
could be explained by the fact that individuals following an omnivorous diet cognitive restraint could
counteract the effects of overeating, whereas in individuals following a vegetarian diet, the
overeating tendency is nearly absent. This ineffective form of weight control on food intake may
results in individuals following a vegetarian diet eating less (because they are used to restrict the
amount and quality of food consumed) and could lead to undereating, whereas in individuals
following an omnivorous diet could lead to episodes of overeating.
Our results have shown that individuals’ following a vegetarian diet had a body mass index that
was lower than the body mass index of individuals following an omnivorous diet. That could indicate
that vegetarian dietary patterns may be protective in gain weight. It can be assumed that individuals
following a meat-free diet engage in non-dietary lifestyle habits that promote weight loss and good
health [37]. In addition, by reducing meat intake, they consume more plant-based foods that are low
in saturated fat and high in fiber, both of which contribute to weight control opposite to animal
products that tend to be higher in saturated fat and their intake may cause weight gain [38,39].
The second purpose of the present study was to examine the relation between type of diet
(vegetarian versus omnivorous diet) and unhealthy eating patterns (orthorexia nervosa, cognitive
restraint) and body mass index using the structural equation modeling (SEM) approach. To the best
of our knowledge, prior research has not investigated this association. Our results indicated thatNutrients 2020, 12, 646 10 of 13
vegetarian diet was directly associated with higher levels of all aspects of orthorexia nervosa
(knowledge of healthy eating, problems associated with healthy eating and feelings positively about
healthy eating) (H1 was confirmed). These findings are in line with prior studies in the literature that
also find that higher rate of orthorexic behaviors was linked to a vegetarian diet [12,17,40–42]. It can
be supposed that a vegetarian diet might increase the risk of developing orthorexia nervosa [11].
The direct path from vegetarian diet to cognitive restraint was not found (H2 was not
confirmed). Contrary to our hypothesis, we reported that omnivorous diet and cognitive restraint
were directly related. Cognitive restraint could lead to an alteration of internal perceptions of hunger
and satiety and/or a disinhibition [14], therefore, it can be hypothesized that cognitive restraint in
individuals following an omnivorous diet may indicate disordered eating behaviors or maladaptive
eating-related attitudes.
It is worth mentioning that in the case of the indirect relationship between dietary patterns and
cognitive restraint vegetarian diet predisposed to higher levels of cognitive restraint in the case of
problems associated with healthy eating and feelings positively about healthy eating. One
explanation of these results could be motivation for following a vegetarian diet [43]. Some individuals
(especially women) with high level of cognitive restraint may adopt a vegetarian diet as a means of
limiting food intake or may represent an attempt to conceal dieting behaviors form others [43].
Individuals with higher levels of cognitive restraint consume a larger amount of low-fat and calorie-
reduced foods (healthy food groups), less energy, less carbohydrate and eat less food in general [44].
In addition, they may use a combination of behavioral strategies for weight control. The influential
theory of dietary restraint has argued the cognitive effort required to effortfully restrict one’s intake
is a causal risk factors for disordered eating behaviors [44]. This could indicate that dietary patterns
that involve reduced meat intake may be employed as a socially accepted approach to engage in
maladaptive weight control strategies. The adoption of a vegetarian diet after the development of an
eating disorder may indicate that a vegetarian diet may play more of a role in the maintenance of
eating pathology rather than being a causal factor [45]. It can be hypothesized that this mechanism
could also occur in orthorexia nervosa.
Consistent with our hypothesis increased cognitive restraint was associated with higher body
mass index but body mass index was not related to vegetarian diet (H3 was partially confirmed). This
indicate that following an omnivorous diet had a greater tendency to cognitive restraint and an
elevated body mass index.
This study has some limitations. Firstly, we conducted a cross-sectional study therefore we are
unable to directly examine the causal relationship between type of diet and unhealthy eating
behaviors. For investigating the causality, the future study should be focused on experimental and
longitudinal studies. Secondly, we only used the subjective measures. Body mass index should be
assessed by the objective methods (e.g., dual-energy x-ray absorptiometry (DXA), magnetic
resonance imaging (MRI), bioelectrical impedance analysis (BIA)). Thirdly, in our study we used the
structural equation modeling. It is worth mentioning that that multigroup structural equation
modeling provides a powerful tool to assess the similarities and differences between different
populations and equality or inequality between populations can be examined by testing whether
particular parameters (e.g., factor loadings, regression coefficients between latent variables, or
variances of factors and errors) in various groups are the same or different [46].
5. Conclusions
Our findings have demonstrated that individuals following a vegetarian diet reported more
orthorexic behaviors compared with those following an omnivorous diet. Our findings have found
that cognitive restraint was significantly higher in individuals following an omnivorous diet
compared with those following a vegetarian diet. Furthermore, individuals following a vegetarian
diet had lower body mass index than individuals following an omnivorous diet .
Use of SEM method showed that following a vegetarian diet and higher levels of all aspect of
orthorexia nervosa were directly associated. More research is necessary to further understand the
complexity of the relationship between type of diet and unhealthy eating patterns in adults.Nutrients 2020, 12, 646 11 of 13
Funding: This research was funded by National Science Centre (NCN), Poland, grant number
2017/01/X/HS6/00007
Acknowledgments: My grateful thanks are extended to members of EAT Lab for their help in conducting
research.
Conflicts of Interest: The author declares no conflict of interest. The founding sponsors had no role in the design
of the study; in the collection, analyses, or interpretation of data; in the writing of the manuscript, and in the
decision to publish the results.
References
1. Ruby, M.B. Vegetarianism. A blossoming field of study. Appetite 2012, 58, 141–150,
doi:10.1016/j.appet.2011.09.019.
2. Craig, W.J.; Mangels, A.R. American Dietetic Association. Position of the American Dietetic Association:
Vegetarian diets. J. Am. Diet Assoc. 2009, 109, 1266–1282.
3. Chen, M. The joint moderating effect of health consciousness and healthy lifestyle on consumers’
willingness to use functional foods in Taiwan. Appetite 2011, 57, 253–262, doi:10.1016/j.appet.2011.05.305.
4. Bratman, S.; Knight, D. Health Food Junkies: Overcoming the Obsession with Healthful Eating; Broadway Books:
New York, NY, USA, 2000; pp. 104–118.
5. Dunn, T.M.; Bratman, S. On orthorexia nervosa: A review of the literature and proposed diagnostic criteria.
Eat Behav. 2016, 21, 11–17, doi:10.1016/j.eatbe h.2015.12.006.
6. Moroze, R.M.; Dunn, T.M.; Craig, J.H.; Yager, J.; Weintraub, P. Microthinking about micronutrients: A case
of transition from obsessions about healthy eating to near-fatal “orthorexia nervosa” and proposed
diagnostic criteria. Psychosomatics 2015, 56, 397–403, doi:10.1016/j.psym.2014.03.003.
7. Cena, H.; Barthels, F.; Cuzzolaro, M.; Bratman, S.; Brytek-Matera, A.; Dunn, T.; Varga, M.; Missbach, B.;
Donini, L.M. Definition and diagnostic criteria for orthorexia nervosa: A narrative review of the literature.
Eat Weight Disord. 2019, 24, 209–246, doi:10.1007/s40519-018-0606-y.
8. Barrada, J.R.; Roncero, M. Bidimensional structure of the orthorexia: Development and initial validation of
a new instrument. Ann. Psicol. 2018, 34, 283–291, doi:10.6018/analesps.34.2.299671.
9. Depa, J.; Barrada; J.R.; Roncero, M. Are the motives for food choices different in orthorexia nervosa and
healthy orthorexia? Nutrients 2019, 11, 697, doi:10.3390/nu11030697.
10. Barthels, F.; Barrada, J.R.; Roncero, M. Orthorexia nervosa and healthy orthorexia as new eating styles.
PLoS ONE 2019, 14, e0219609, doi:10.1371/journal.pone.0219609.
11. Brytek-Matera, A. Vegetarian diet and orthorexia nervosa: A review of the literature. Eat Weight Disord.
2019, 29, doi:10.1007/s40519-019-00816-3.
12. Barnett, M.J.; Dripps, W.R.; Blomquist, K.K. Organivore or organorexic? Examining the relationship
between alternative food network engagement, disordered eating, and special diets. Appetite 2016, 1, 713–
720, doi:10.1016/j.appet.2016.07.008.
13. The New European Driving Cycle. Available online: https://www.nedc.com.au/eating-disorders/eating-
disorders-explained/disordered-eating-and-dieting/ (accessed on 3 December 2019).
14. Sweerts, S.J.; Apfeldorfer, G.; Romo, L.; Kureta-Vanoli, K. Treat or Enhance Cognitive Restraint in
Individuals Suffering from Overweight or Obesity? Systematic Revue of the Literature. SOJ Psychol. 2016,
3, 1–8, doi:10.15226/2374-6874/3/1/00125.
15. Timko, C.A.; Juarascio, A.; Chowansky, A. The effect of a pre-load experiment on subsequent food
consumption. Caloric and macronutrient intake in the days following a pre-load manipulation. Appetite
2012, 58, 747–753, doi:10.1016/j.appet.2011.11.030.
16. Heiss, S.; Hormes, J.M.; Timko, C.A. Vegetarianism and Eating Disorders. In Vegetarian and Plant-Based Diets
in Health and Disease Prevention; Mariotti, F., Ed.; Academic Press: Cambridge, MA, USA, 2017; pp. 51–69.
17. Barthels, F.; Meyer, F.; Pietrowsky, R. Orthorexic and restrained eating behaviour in vegans, vegetarians,
and individuals on a diet. Eat Weight Disord. 2018, 23, 159–166, doi:10.1007/s40519-018-0479-0.
18. McLean, J.A., Barr, S.I. Cognitive dietary restraint is associated with eating behaviors, lifestyle practices,
personality characteristics and menstrual irregularity in college women. Appetite 2003, 40, 185–192.
19. Fisak, B.; Peterson, R.D.; Tantleff-Dunn, S.; Molnar, J.M. Challenging previous conceptions of
vegetarianism and eating disorders. Eat. Weight Disord. 2006, 11, 195–200.Nutrients 2020, 12, 646 12 of 13
20. Brytek-Matera, A.; Rogoza, R.; Czepczor-Bernat, K. The Three-Factor Eating Questionnaire-R18: An
analysis of the factor structure of the Polish version among normal weight and obese adult women. Arch.
Psychiatr. Psychother. 2017, 3, 81–90, doi:10.12740/APP/76342.
21. Herman, C.P.; Mack, D. Restrained and unrestrained eating. J. Pers. 1975, 43, 647–660, doi:10.1111/j.1467-
6494.1975.tb00727.x.
22. Johnson, F.; Pratt, M.; Wardle, J. Dietary restraint and self-regulation in eating behavior. Int. J. Obes. 2012,
36, 665–674.
23. Abdella, H.M.; El Farssi, H.O.; Broom, D.R.; Hadden, D.A.; Dalton, C.F. Eating Behaviours and Food
Cravings; Influence of Age, Sex, BMI and FTO Genotype. Nutrients 2019, 12, E377, doi:10.3390/nu11020377.
24. de Lauzon-Guillain, B.; Basdevant, A.; Romon, M.; Karlsson, J.; Borys, J.M.; Charles, M.A. Is restrained
eating a risk factor for weight gain in a general population? Am. J. Clin. Nutr. 2006, 83, 132–138.
25. Spencer, E.A.; Appleby, P.N.; Davey, G.K.; Key, T.J. Diet and body mass index in 38000 EPIC-Oxford meat-
eaters, fish-eaters, vegetarians and vegans. Int. J. Obes. Relat. Metab. Disord. 2003, 27, 728–734.
26. Benatar, J.R.; Stewart, R.A.H. Cardiometabolic risk factors in vegans; A meta-analysis of observational
studies. PLoS ONE 2018, 13, e0209086, doi:10.1371/journal.pone.0209086.
27. Tonstad S, Butler T, Yan R, Fraser GE. Type of vegetarian diet, body weight, and prevalence of type 2
diabetes. Diabetes Care 2009, 32, 791–796, doi:10.2337/dc08-1886.
28. Brytek-Matera, A.; Czepczor-Bernat, K.; Jurzak, H.; Kornacka, M.; Kołodziejczyk, N. Strict health-oriented
eating patterns (orthorexic eating behaviors) and their connection with a vegetarian and vegan diet. Eat
Weight. Disord. 2018, 1–12, doi:10.1007/s40519-018-0563-5.
29. Faul, F.; Erdfelder, E.; Buchner, A.; Lang, A.-G. Statistical power analyses using G*Power 3.1: Tests for
correlation and regression analyses. Behav. Res. Methods 2009, 41, 1149–1160.
30. Karlsson, J.; Persson, L.-O.; Sjöström, L.; Sullivan, M. Psychometric properties and factor structure of the
Three-Factor Eating Questionnaire (TFEQ) in obese men and women. Results from the Swedish Obese
Subjects (SOS) study. Int. J. Obes. 2010, 24, 1715–1725, doi:10.1038/sj.ijo.0801442.
31. Gleaves, D.; Graham, E.C.; Ambwani, S. Measuring “orthorexia:” development of the Eating Habits
Questionnaire. Int. J. Educ. Psychol. Assess. 2013, 12, 1–18.
32. Byrne, B. Structural Equation Modeling with AMOS, Basic Concepts, Applications, and Programming, 2th ed.;
Routledge: New York, NY, USA, 2010.
33. Chard, C.A.; Hilzendegen, C.; Barthels, F.; Stroebele-Benschop, N. Psychometric evaluation of the English
version of the Düsseldorf Orthorexie Scale (DOS) and the prevalence of orthorexia nervosa among a US
student sample. Eat Weight Disord. 2019, 24, 275–281, doi:10.1007/s40519-018-0570-6.
34. Heiss, S.; Coffino, J.A.; Hormes, J.M. What does the ORTO-15 measure? Assessing the construct validity of
a common orthorexia nervosa questionnaire in a meat avoiding sample. Appetite 2019, 135, 93–99,
doi:10.1016/j.appet. 2018.12.042.
35. Dittfeld, A.; Gwizdek, K.; Jagielski, P.; Brzęk, J.; Ziora, K. A study on the relationship between orthorexia
and vegetarianism using the BOT (Bratman Test for Orthorexia). Psychiatr. Pol. 2017, 51, 1133–1144,
doi:10.12740/PP/75739.
36. Forestell, C.A.; Spaeth, A.; Kane, S.A. To eat or not to eat red meat. A closer look at the relationship between
restrained eating and vegetarianismin college females. Appetite 2012, 58, 319–325,
doi:10.1016/j.appet.2011.10.015.
37. Rizzo, N.S.; Jaceldo-Siegl, K.; Sabate, J.; Fraser, G.E. Nutrient Profiles of vegetarian and nonvegetarian
dietary patterns. J. Acad. Nutr. Diet. 2013, 113, 1610–1619, doi:10.1016/j.jand.2013.06.349.
38. Giudici, K.V.; Baudry, J.; Méjean, C.; Lairon, D.; Bénard, M.; Hercberg, S.; Bellisle, F.; Kesse-Guyot, E.;
Péneau, S. Cognitive restraint and history of dieting are negatively associated with organic food
consumption in a large population-based sample of organic food consumers. Nutrients 2019, 15, 11,
doi:10.3390/nu11102468.
39. Forestell, C.A. Flexitarian diet and weight control: Healthy or risky eating behavior? Front. Nutr. 2018, 5,
59, doi:10.3389/fnut.2018.00059.
40. Missbach, B.; Hinterbuchinger, B.; Dreiseitl, V.; Zellhofer, S.; Kurz, C.; König, J. When eating right, is
measured wrong! A validation and critical examination of the ORTO-15 questionnaire in German. PLoS
ONE 2015, 10, e0135772, doi:10.1371/journal.pone.0135772.
41. Valera, J.H.; Ruiz, P.A.; Valdespino, B.R.; Visioli, F. Prevalence of orthorexia nervosa among ashtanga yoga
practitioners: A pilot study. Eat Weight Disord. 2014, 19, 469–472, doi:10.1007/s4051 9-014-0131-6.Nutrients 2020, 12, 646 13 of 13
42. Luck-Sikorski, C.; Jung, F.; Schlosser, K.; Riedel-Heller, S.G. Is orthorexic behavior common in the general
public? A large representative study in Germany. Eat Weight Disord. 2018, doi:10.1007/s40519-018-0502-5.
43. Barr, S. Women’s reproductive function. In Vegetarian Nutrition; Sabaté, J., Ed.; CRC Press: Washington,
DC, USA, 2001; pp. 221–249.
44. Norwood, R.; Cruwys, T.; Chachay, V.S.; Sheffield, J. The psychological characteristics of people consuming
vegetarian, vegan, paleo, gluten free and weight loss dietary patterns. Obes. Sci. Pract. 2019, 5, 148–158,
doi:10.1002/osp4.325.
45. Timko, C.A.; Hormes, J.M.; Chubski. J. Will the real vegetarian please stand up? An investigation of dietary
restraint and eating disorder symptoms in vegetarians versus non-vegetarians. Appetite 2012, 58, 982–990,
doi:10.1016/j.appet.2012.02.005.
46. Deng, L.; Yuan, K.-H. Multiple-group analysis for structural equation modeling with dependent samples.
Struct. Equ. Modeling 2015, 22, 552–567, doi:10.1080/10705511.2014.950534.
© 2020 by the author. Licensee MDPI, Basel, Switzerland. This article is an open access
article distributed under the terms and conditions of the Creative Commons Attribution
(CC BY) license (http://creativecommons.org/licenses/by/4.0/).You can also read