Novel Analgesic Index for Postoperative Pain Assessment Based on a Photoplethysmographic Spectrogram and Convolutional Neural Network: ...
←
→
Page content transcription
If your browser does not render page correctly, please read the page content below
JOURNAL OF MEDICAL INTERNET RESEARCH                                                                                                           Choi et al

     Original Paper

     Novel Analgesic Index for Postoperative Pain Assessment Based
     on a Photoplethysmographic Spectrogram and Convolutional
     Neural Network: Observational Study

     Byung-Moon Choi1*, MD, PhD; Ji Yeon Yim2*, BSc; Hangsik Shin2*, PhD; Gyujeong Noh1,3, MD, PhD
     1
      Department of Anaesthesiology and Pain Medicine, Asan Medical Center, University of Ulsan College of Medicine, Seoul, Republic of Korea
     2
      Department of Biomedical Engineering, Chonnam National University, Yeosu, Republic of Korea
     3
      Department of Clinical Pharmacology and Therapeutics, Asan Medical Center, University of Ulsan College of Medicine, Seoul, Republic of Korea
     *
      these authors contributed equally

     Corresponding Author:
     Hangsik Shin, PhD
     Department of Biomedical Engineering
     Chonnam National University
     50 Daehak-ro
     Yeosu, 59626
     Republic of Korea
     Phone: 82 1068998679
     Email: hangsik.shin@jnu.ac.kr

     Abstract
     Background: Although commercially available analgesic indices based on biosignal processing have been used to quantify
     nociception during general anesthesia, their performance is low in conscious patients. Therefore, there is a need to develop a new
     analgesic index with improved performance to quantify postoperative pain in conscious patients.
     Objective: This study aimed to develop a new analgesic index using photoplethysmogram (PPG) spectrograms and a convolutional
     neural network (CNN) to objectively assess pain in conscious patients.
     Methods: PPGs were obtained from a group of surgical patients for 6 minutes both in the absence (preoperatively) and in the
     presence (postoperatively) of pain. Then, the PPG data of the latter 5 minutes were used for analysis. Based on the PPGs and a
     CNN, we developed a spectrogram–CNN index for pain assessment. The area under the curve (AUC) of the receiver-operating
     characteristic curve was measured to evaluate the performance of the 2 indices.
     Results: PPGs from 100 patients were used to develop the spectrogram–CNN index. When there was pain, the mean (95% CI)
     spectrogram–CNN index value increased significantly—baseline: 28.5 (24.2-30.7) versus recovery area: 65.7 (60.5-68.3); P
JOURNAL OF MEDICAL INTERNET RESEARCH                                                                                                       Choi et al

     require an appropriate index to quantify their pain. However,          observational study. Exclusion criteria were as follows:
     current commercial analgesic indices were developed for the            clinically significant impairment of the cardiovascular, hepatic,
     purpose of evaluating nociception in patients under general            or renal function; history of cardiac arrhythmia; use of
     anesthesia [2,3]; therefore, there is no standard for the              medication that might affect autonomic function; the presence
     quantification of postoperative pain in conscious patients [4].        of presurgical acute or chronic pain (Visual Analog Scale score
     Thus, developing a new pain index to quantify pain in patients         [VAS] > 0, measured before surgery); clinically significant
     who cannot directly communicate their level of pain may also           laboratory findings; and evidence of pregnancy.
     help in the clinical setting; it will also reduce the need to ask
     questions each time the patient is conscious when pain must be
                                                                            Procedure and Data Acquisition
     evaluated frequently.                                                  All patients fasted from midnight on the day of surgery without
                                                                            premedication. In the operating theater, patients were monitored
     A photoplethysmogram (PPG) is a biosignal that can be obtained         for their heart activity using electrocardiography, end-tidal
     continuously and noninvasively using a pulse oximeter. Because         carbon dioxide partial pressure, and noninvasive blood pressure
     a PPG conveys much information about a patient’s condition,            measurement. Neuromuscular transmission was monitored using
     many attempts have been made to quantify pain by analyzing             an M-NMT module at the adductor pollicis muscle
     PPG signals [3,5-7]. The surgical pleth index (SPI; GE                 (CARESCAPE B850; GE Healthcare). A reusable SPI sensor
     Healthcare), developed for quantifying nociception during              was placed on the index finger of each patient (on the arm not
     general anesthesia, only considers the amplitude and heartbeat         used for blood pressure measurement). Patients were allowed
     interval of a PPG [3]. In addition to these 2 parameters, other        to acclimatize for at least 5 minutes in the supine position in a
     pain-related features are present in PPG signals [6,7]. Therefore,     quiet operating theater, after which baseline data (without pain)
     the application of a new analytical method has the potential to        were collected for 6 minutes, of which the latter 5 minutes were
     improve the performance of analgesic indices.                          used for analysis. General anesthesia was performed by
     Deep learning architectures, such as a convolution neural              administering propofol and remifentanil by a target effect-site
     network (CNN), can be a good solution to elucidate the hidden          concentration–controlled infusion using the Schnider and Minto
     features in a PPG because they can identify optimal abstracted         models [11,12]. Target effect-site concentrations (Ces) of
     features that are beyond human comprehension without any               propofol were titrated to maintain the bispectral index
     manual procedure [8]. Furthermore, in determining the presence         (Covidien) at less than 60 during the induction and maintenance
     of pain, machine learning has a strong advantage owing to its          of anesthesia. The target Ces of remifentanil were adjusted to
     nonlinear characteristics compared with the SPI, which assesses        maintain stable hemodynamics (ie, systolic blood pressure >80
     pain based on simple linear regression [8,9], potentially making       mmHg and heart rate over 45 beats/min). All patients received
     it possible to effectively predict nonlinear deviations among          a bolus dose of oxycodone (0.1 mg/kg) 30 minutes prior to the
     individuals or situations [10]. Therefore, a combination of the        end of surgery.
     extended features of PPG and machine learning–based scoring            Intravenous patient-controlled analgesia with oxycodone began
     is expected to overcome the limitations of existing pain               after the administration of the bolus dose of oxycodone.
     assessment techniques. However, because a PPG is a 1D signal,          Neuromuscular blockade was reversed with neostigmine and
     whereas CNNs have the advantage of multidimensional data               glycopyrrolate at the end of surgery. Tracheal extubation was
     analysis, a dimensional extension of a PPG without loss of             performed when the train-of-four ratio was greater than 0.9 and
     time–frequency characteristics is required to apply it optimally       bispectral index value was greater than 80. Patients were then
     in a CNN. A spectrogram, which is a 2D image including the             transported to the postanesthesia care unit (PACU). When the
     intact time–frequency characteristics of a PPG, can be a good          patients arrived in the PACU, their state of consciousness was
     method for applying a CNN to PPGs.                                     assessed with a modified Aldrete score [13]. Electrocardiogram,
     This study aimed to develop a new analgesic index using PPG            pulse oximetry, and noninvasive blood pressure were also
     spectrograms and a CNN to objectively assess pain in conscious         monitored. Additional PPG and SPI data were obtained for the
     patients. In addition, the performance of our newly developed          initial 5 minutes in the PACU. After obtaining the data, patients
     index was compared with that of the SPI.                               were assessed for pain using a VAS (0=no pain; 100=the most
                                                                            severe pain). Oxycodone was administered according to
     Methods                                                                postoperative pain intensity. The PPG and SPI values were
                                                                            measured using an S/5 Anesthesia Monitor (Datex-Ohmeda,
     Patient Population                                                     Inc.) and recorded on a laptop for offline analysis. The PPG
     The study protocol was approved by the Institutional Review            data were sampled at 300 Hz, and SPI data were recorded every
     Board of Asan Medical Centre (approval number: 2016-0477)              10 seconds.
     and registered on an international clinical trials registry platform   Pain Assessment Model
     (registration number KCT0002080). Written informed consent
                                                                            A spectrogram–CNN model was developed and validated
     was obtained from all patients. All procedures were conducted
                                                                            through fivefold cross-validation. The developed model outputs
     in accordance with relevant guidelines and regulations. In total,
                                                                            the spectrogram–CNN index as a pain score using a PPG
     120 patients (American Society of Anesthesiologists Physical
                                                                            spectrogram as input and CNN as a pain scorer. During model
     Status 1, 2, or 3) between the ages of 20 and 80, who were
                                                                            development, patients and test sets were separated to prevent
     scheduled to undergo elective surgery, were included in this
                                                                            intrasubject interference to avoid data overlaps between the

     http://www.jmir.org/2021/2/e23920/                                                              J Med Internet Res 2021 | vol. 23 | iss. 2 | e23920 | p. 2
                                                                                                                   (page number not for citation purposes)
XSL• FO
RenderX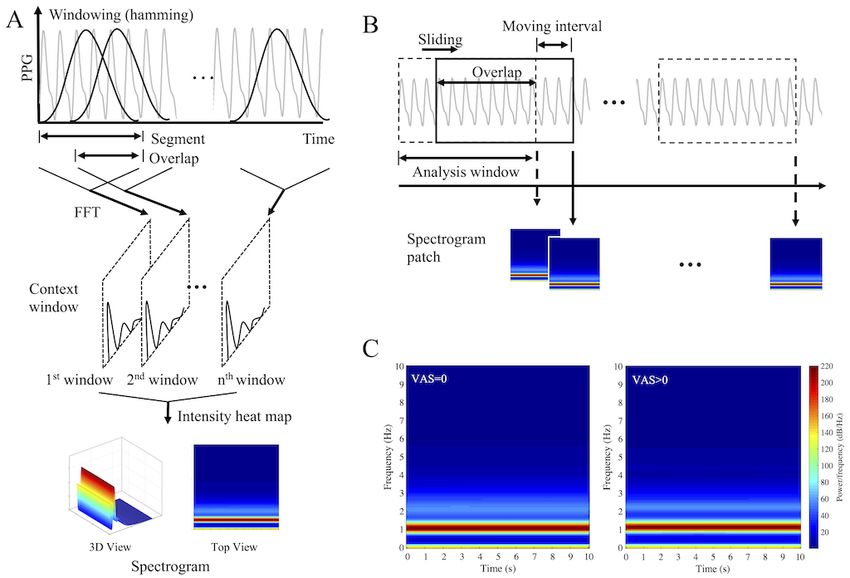
JOURNAL OF MEDICAL INTERNET RESEARCH                                                                                                             Choi et al

     development and test sets of each fold. For model training, 90%           response bandpass filter with a 0.5-10-Hz passband and a 30-tap
     of the development set was used as a training set and 10% as a            moving average filter. In addition, considering that PPG
     validation set. Finally, for each fold, 20, 73, and 7 patients’ data      amplitude is an arbitrary unit, a normalization process was
     were used as a test set, training set, and validation set,                performed to reduce the intersubject and intermeasurement
     respectively. Pain and nonpain data labels were created based             deviations [17]. In the normalization process, z-scores were
     on the VAS, where VAS>0 was defined as pain and VAS=0                     obtained by subtracting the mean of the measured values from
     was defined as nonpain with labels “1” and “0,” respectively.             each measured value and dividing by the standard deviation.
     Detailed descriptions of the spectrograms and CNN used in this            The spectrogram generation process is illustrated in Figure 1.
     study are given below.
                                                                               Spectrogram images were generated by short-time Fourier
     Spectrogram                                                               transforms of 10-second PPGs every 10 seconds without overlap
     Spectrogram creation is a method used for time–frequency                  (Figure 1A). At the time, to generate a single spectrogram image,
     analysis of time series signals. A spectrogram reconstructs 2D            each 10-second PPG was divided into 6.3-second segments with
     images while maintaining the information contained in 1D time             a 6.27-second overlap and transformed to the frequency domain
     series data [14]. Spectrograms are useful for visually describing         using fast Fourier transform after windowing with a Hamming
     changes in the frequency characteristics of nonstationary signals,        window (Figure 1B). The frequency range of the spectrogram
     such as physiological signals over time [15,16]. Spectrograms             image was set to 0-10 Hz, and the frequency resolution was set
     can be generated by repeating short-time Fourier transforms               to 0.81 Hz to equalize the number of time frames and frequency
     that divide a longer time signal into shorter segments of equal           bins, that is, to equalize the numbers of horizontal and vertical
     length and then computing the Fourier transforms separately               pixels in the spectrogram image, respectively. Finally, 30
     on each shorter segment. In this study, 2D spectrogram images             spectrogram patches of size 124 × 124 were generated for each
     generated from 1D PPGs were used as the pain classifier input             5-minute PPG. Figure 1C shows the averaged spectrograms
     to reflect the whole waveform and change of waveform, not the             without pain (left) and with pain (right). All preprocessing and
     specific feature of the PPG waveform. Prior to spectrogram                spectrogram patches were generated using MATLAB (version
     generation, all PPGs were filtered using both a finite impulse            2018a; The MathWorks, Inc.).

     Figure 1. Process for generation of a single spectrogram (A), process of generating multiple spectrograms over time using a sliding window (B) and
     the average spectrogram during pain (left) and non-pain (right) conditions (C); FFT: fast Fourier transform; PPG: photoplethysmogram.

                                                                               inputs. CNNs enable data-driven learning, are highly
     Convolutional Neural Network                                              representative, and effectively combine the spatial information
     CNNs are useful for image analysis because they have the                  of multidimensional inputs [18]; supervised CNNs extract
     advantage of maintaining the spatial information of 2D or higher          information more effectively due to class-specific information

     http://www.jmir.org/2021/2/e23920/                                                                    J Med Internet Res 2021 | vol. 23 | iss. 2 | e23920 | p. 3
                                                                                                                         (page number not for citation purposes)
XSL• FO
RenderX
JOURNAL OF MEDICAL INTERNET RESEARCH Choi et al
[19,20]. The CNN used in this study has a 2D PPG spectrogram map size of 15 × 15. The fully connected layer consists of 2
input and binary-coded labels: “0” is a pain-free state and “1” hidden layers and 1 output layer, and the ReLU activation
is pain state. Figure 2 shows the structure of the CNN developed function and dropout are also applied to the hidden layer to
in this study. First, in the convolution-max pooling layer reduce overfitting [24]. The dropout rate was set to 0.5 in
(Conv-Maxpool), 32, 64, and 128 filters are applied to the training, but there was no dropout during testing. Cross-entropy
spectrogram input to perform a convolution process, and the is employed as a cost function [25], and adaptive moment
spatial characteristics are simplified through max pooling. In estimation (Adam) is used as an optimizer [26]. Finally, the
Conv-Maxpool, the filter size of all convolutional layers is 2 × result is output to 2 nodes, representing “pain free” and “pain,”
2 and the stride is 1. The size of the feature map is reduced by and the values are probabilistically expressed using the SoftMax
setting the filter size of the max pooling layer to 2 × 2 and stride function [27]. Because the output of SoftMax gives the
to 2, equal to the filter size. A batch normalization layer and probability of the input data being a painful condition with a
rectified linear unit (ReLU) activation functions are applied to value between 0 and 1, it is converted into a pain index as the
the Conv-Maxpool to increase learning speed and efficiency. “likelihood of pain.” Consequently, the spectrogram–CNN index
Batch normalization is a structure that improves the speed and is calculated by multiplying the probability value output from
stability of neural networks by normalizing interlayer input data the pain node by 100. The CNN model was implemented and
[21], and ReLU improves the expressive power of neural trained using Python 3.7 (Python Software Foundation) and
networks based on nonlinear features [22,23]. The TensorFlow 2.0 in the Anaconda environment.
Conv-Maxpool process is repeated 3 times, resulting in a feature
Figure 2. Architecture of the convolutional neural network proposed in this study. X: input, F: filter, C: convolution layer, M: max pooling, N: number
of filters, BN: batch normalisation, ReLU: rectifier linear unit, Conv-Maxpool: convolution-max pooling.
SPI for categorical variables. P valuesJOURNAL OF MEDICAL INTERNET RESEARCH Choi et al
calling) who later had a value of 2 points upon leaving the 16.7) versus PACU SPI: 53.5 (SD 17.8), PJOURNAL OF MEDICAL INTERNET RESEARCH Choi et al
Table 2. Areas under the receiver-operating characteristic curves (AUCs) and cutoff values for assessing pain in the spectrogram-convolutional neural
network index and surgical pleth index (SPI) in surgical patients.
Parameter Spectrogram–CNNa index SPI
Training set Validation set Test set
AUC (95% CI) 0.992 (0.991-0.993) 0.932 (0.921-0.942) 0.757 (0.746-0.768) 0.659 (0.646-0.671)
P valueJOURNAL OF MEDICAL INTERNET RESEARCH Choi et al
Figure 5. Frequency distribution of the spectrogram-convolutional neural network index (SCI, A and B) and surgical pleth index (SPI, C and D) values
observed without (A and C) and with (B and D) pain. During the data collection period (baseline: 5 min, postanaesthesia care unit: 5 min), the SCI and
SPI values were observed every 10 sec. The vertical red lines show the median frequency (A: 11, B: 82, C: 32, D: 53).
transformed, while the underlying information is retained. This
Discussion feature of the proposed model is its differentiating factor from
The spectrogram–CNN index proposed in this study SPI, which requires a complicated process of extracting pain
outperformed the commercialized SPI pain index in the features from biosignals, including PPG pulsation start and
postoperative pain assessment of conscious patients. One of the systolic maximum detection and verification. These
main reasons for its outperformance is the spectrogram input preprocessing steps are necessary in existing pain assessment
containing the PPG’s intact waveform information, making it methods, but they are cumbersome and vulnerable, providing
possible to use hidden pain-related factors that could not be only limited features. Therefore, a simplified preprocessing
provided only by the peaks. Because existing pain assessment process that still provides plentiful feature information can
methods, such as the SPI, use only certain features of a PPG significantly improve the robustness of pain assessment.
that show significant changes in surgical stimuli, numerous Another key technique proposed in this study is the
pain-related information reflected in the PPG may be discrimination of postoperative pain using machine learning.
overlooked. To overcome these limitations, research has been Although machine learning–based pain assessment has already
conducted on new pain-related features derived from been studied [29-31], it is not suitable for practical clinical
sophisticated PPG waveform analysis in addition to the heart situations because it depends on high-dimensional clinical data,
rate interval and PPG amplitude reflected in the SPI [5-7]. such as patient records and electroencephalograms, which are
However, these pain indicators still depend on complex rarely used in postoperative care. However, machine learning
processes, such as peak detection and feature extraction, which from PPGs, which are frequently used in clinical practice during
require accurate peak extraction algorithms and are vulnerable postoperative care, has high practical utility. In this study, we
to signal quality degradation. The proposed PPG spectrogram used a spectrogram–CNN combination, which has already been
input does not require any peak detection or feature extraction applied to electrocardiograms and electroencephalograms and
process, thus avoiding problems such as peak misdetection has shown reasonable performance in predicting seizures and
during preprocessing. In addition, the spectrogram provides atrial fibrillation [32-35]. The spectrogram converts the data
information from almost the whole PPG waveform because into 2D, and the CNN has the advantage of extracting the spatial
only the domain in which information is represented is features of multidimensional data. The combination of these
http://www.jmir.org/2021/2/e23920/ J Med Internet Res 2021 | vol. 23 | iss. 2 | e23920 | p. 7
(page number not for citation purposes)
XSL• FO
RenderXJOURNAL OF MEDICAL INTERNET RESEARCH Choi et al
techniques thus extends the dimensions of PPG and allows image recognition in 2012 [9]. Moreover, the previous study
spatiotemporal analysis, maximizing the use of features inherent evaluated pain based on full-length data, whereas ours assessed
in the signal. Nonlinear classification may be another important pain every 10 seconds, the same data display interval as in the
reason for the good performance of the proposed model. While SPI. Therefore, it can be applied to real-time pain assessment,
the SPI is derived from a simple linear combination of which is in contrast to the other study.
normalized heartbeat interval and normalized pulse wave
There are some limitations to this study. First, the SPI was
amplitude [3,36], the proposed spectrogram–CNN model
selected as a comparative index to evaluate the performance of
performs nonlinear classification using the ReLU activation
the spectrogram–CNN index, but its suitability is somewhat
function. In addition, the nonlinearity is increased because the
debated. The SPI is neither developed nor recommended for
ReLUs are overlapped with each other in a multilayered
use in conscious patients. However, when a new analgesic index
structure.
is developed, it is essential to evaluate its performance, and this
In this study, patient data used for model development and is commonly done by comparing it with an existing index using
validation were separated, and fivefold cross-validation was the same data. Although the SPI is not recommended for use in
performed to eliminate interindividual interference and to conscious patients, some studies on conscious patients suggest
generalize the model. Therefore, the proposed that SPI can discriminate between the presence and absence of
spectrogram–CNN index is expected to show similar pain [28,38]. Between the SPI and another commonly used
performance in other groups of patients of similar age who did commercial analgesic index—the Analgesia Nociception Index
not participate in model development. However, there may be (PhysioDoloris, MetroDoloris)—the AUC–ROC for detecting
a few new variables to consider. In Table 2, performance postoperative pain in conscious patients was highest for the SPI
measures were approximately 95%, approximately 85%, and [38]. Hence, the SPI was chosen as the comparative index for
approximately 70% for the training, validation, and test sets, this study. Second, neostigmine and glycopyrrolate, when
respectively. The decision criteria also differed with 50 in the administered to reverse neuromuscular blockade, can contribute
training set, 54 in the validation set, and 48 in the test set, to PPG signals. As this study was observational, only data
indicating that overfitting occurred. In a random permutation necessary for the development of a new analgesic index were
test on balanced accuracy, the average accuracy was 49.5 (SD collected during the normal anesthesia process without
0.7), and the range of values was 47.6-51.8. Considering that intervention. Neostigmine and glycopyrrolate were used in all
all balanced accuracies of the training, validation, and test sets patients because none of them required sugammadex.
were over 71, it is likely that the overfitting in our result Neostigmine is known to be rapidly eliminated from the plasma
stemmed from large intersubject variability rather than the model after administration, with an average half-life of approximately
itself. Overfitting can be interpreted as degradation of the 25 minutes [39]. We collected postoperative PPG data an
model’s versatility, but it can also be interpreted as higher average of 29.4 minutes after administration of these 2 agents.
performance, at least in terms of validation accuracy, if sufficient A previous study reported that baroreflex sensitivity was
data are used. Therefore, further studies are required to improve restored to its baseline value after approximately 82 minutes of
the reliability and versatility of this index using a large patient glycopyrrolate administration [40]. It is possible that
population with diverse body characteristics. glycopyrrolate has mixed effects on postoperative PPG.
However, because sugammadex usage is not common, it may
The spectrogram–CNN index may not have been able to
be more beneficial to develop an index to distinguish pain based
distinguish pain intensity because the number of observations
on data that can be obtained from actual practical conditions.
was relatively small. A previous study showed that SPI
Further studies are required to evaluate the extent of the effect
distinguishes postoperative pain intensity [28]; however, the
of these 2 drugs on postoperative PPG. Third, it is difficult to
authors of this previous study analyzed 1300 observations,
determine whether the PPG data collected from the PACU solely
whereas we only used 93. Nonetheless, a more fundamental
reflect pain. In the conscious state, the sympathetic nervous
reason is that the severity of pain was not accounted for when
system may be activated for other reasons, such as arousal or
developing the spectrogram–CNN index. If sufficient PPG data
anxiety. Anxiety has been associated with reduced heart rate
were provided when learning to classify pain severity, it would
variability and vagal tone [41]. As we did not evaluate patient
be possible to classify pain intensity.
anxiety, we cannot determine its contribution to the PPG data.
The database used in this study was shared by 2 research groups. Considering the condition of patients who arrived in the PACU
Another group, independent of this study, has already published immediately after surgery, the PPG data mostly reflected
their results. Their pain classifier, based on a deep belief network immediate postoperative pain without controlling consciousness.
using various PPG features, discriminated well between the
In conclusion, although there were several limitations to the
presence and absence of pain [37]. Compared to the other study
study design, we confirmed that the newly developed
that extracted various features, ours used a simple spectrogram
spectrogram–CNN index can effectively detect postoperative
containing all PPG information without any complicated feature
pain in conscious patients. Further validation studies are required
extraction procedure and is based on a CNN optimized for the
to assess its feasibility and prevent overfitting to various
spectrogram input. CNNs have lead in the machine learning
populations, including patients under general anesthesia.
field because they demonstrated performance improvements in
http://www.jmir.org/2021/2/e23920/ J Med Internet Res 2021 | vol. 23 | iss. 2 | e23920 | p. 8
(page number not for citation purposes)
XSL• FO
RenderXJOURNAL OF MEDICAL INTERNET RESEARCH Choi et al
Acknowledgments
This research was supported by two grants from the Basic Science Research Program through the National Research Foundation
of Korea (NRF), one funded by the Ministry of Science and ICT (NRF-2018R1A4A1025704), and one funded by the Ministry
of Education (NRF-2018R1D1A3B07046442), Republic of Korea.
Conflicts of Interest
None declared.
References
1. Chou R, Gordon DB, de LOA, Rosenberg JM, Bickler S, Brennan T, et al. Management of postoperative pain: a clinical
practice guideline from the American Pain Society, the American Society of Regional Anesthesia and Pain Medicine, and
the American Society of Anesthesiologists' Committee on Regional Anesthesia, Executive Committee, and Administrative
Council. J Pain 2016 Feb;17(2):131-157. [doi: 10.1016/j.jpain.2015.12.008] [Medline: 26827847]
2. Logier R, Jeanne M, De Jonckheere J, Dassonneville A, Delecroix M, Tavernier B. PhysioDoloris: a monitoring device for
analgesia / nociception balance evaluation using heart rate variability analysis. Annu Int Conf IEEE Eng Med Biol Soc
2010;2010:1194-1197. [doi: 10.1109/IEMBS.2010.5625971] [Medline: 21095676]
3. Huiku M, Uutela K, van Gils M, Korhonen I, Kymäläinen M, Meriläinen P, et al. Assessment of surgical stress during
general anaesthesia. Br J Anaesth 2007 May;98(4):447-455 [FREE Full text] [doi: 10.1093/bja/aem004] [Medline: 17329347]
4. Ledowski T. Objective monitoring of nociception: a review of current commercial solutions. Br J Anaesth 2019
Aug;123(2):e312-e321 [FREE Full text] [doi: 10.1016/j.bja.2019.03.024] [Medline: 31047645]
5. Park C, Yang M, Choi B, Jeon B, Lee Y, Shin H, et al. Performance of the nasal photoplethysmographic index as an
analgesic index during surgery under general anaesthesia. Sci Rep 2020 Apr 28;10(1):7130 [FREE Full text] [doi:
10.1038/s41598-020-64033-0] [Medline: 32346057]
6. Yang YL, Seok HS, Noh G, Choi B, Shin H. Postoperative Pain Assessment Indices Based on Photoplethysmography
Waveform Analysis. Front Physiol 2018;9:1199 [FREE Full text] [doi: 10.3389/fphys.2018.01199] [Medline: 30210363]
7. Seok HS, Choi B, Noh G, Shin H. Postoperative Pain Assessment Model Based on Pulse Contour Characteristics Analysis.
IEEE J Biomed Health Inform 2019 Nov;23(6):2317-2324. [doi: 10.1109/JBHI.2018.2890482] [Medline: 30605112]
8. LeCun Y, Bengio Y, Hinton G. Deep learning. Nature 2015 May 28;521(7553):436-444. [doi: 10.1038/nature14539]
[Medline: 26017442]
9. Krizhevsky A, Sutskever I, Hinton GE. ImageNet classification with deep convolutional neural networks. Commun. ACM
2017 Jun;60(6):84-90 [FREE Full text] [doi: 10.1145/3065386]
10. Pham H. Springer Handbook of Engineering Statistics. Cham, Switzerland: Springer Science & Business Media; 2006.
11. Schnider TW, Minto CF, Gambus PL, Andresen C, Goodale DB, Shafer SL, et al. The influence of method of administration
and covariates on the pharmacokinetics of propofol in adult volunteers. Anesthesiology 1998 May;88(5):1170-1182 [FREE
Full text] [doi: 10.1097/00000542-199805000-00006] [Medline: 9605675]
12. Minto CF, Schnider TW, Egan TD, Youngs E, Lemmens HJ, Gambus PL, et al. Influence of age and gender on the
pharmacokinetics and pharmacodynamics of remifentanil. I. Model development. Anesthesiology 1997 Jan;86(1):10-23
[FREE Full text] [doi: 10.1097/00000542-199701000-00004] [Medline: 9009935]
13. Aldrete JA. Modifications to the postanesthesia score for use in ambulatory surgery. J Perianesth Nurs 1998
Jun;13(3):148-155. [doi: 10.1016/s1089-9472(98)80044-0] [Medline: 9801540]
14. Flanagan JL. Speech Analysis Synthesis and Perception. Cham, Switzerland: Springer Science & Business Media; 2013.
15. Wang W, Zhang G, Yang L, Balaji V, Elamaran V, Arunkumar N. Revisiting signal processing with spectrogram analysis
on EEG, ECG and speech signals. Future Generation Computer Systems 2019 Sep;98:227-232. [doi:
10.1016/j.future.2018.12.060]
16. Huang J, Chen B, Yao B, He W. ECG Arrhythmia Classification Using STFT-Based Spectrogram and Convolutional Neural
Network. IEEE Access 2019;7:92871-92880. [doi: 10.1109/access.2019.2928017]
17. Alian AA, Shelley KH. Photoplethysmography. Best Pract Res Clin Anaesthesiol 2014 Dec;28(4):395-406. [doi:
10.1016/j.bpa.2014.08.006] [Medline: 25480769]
18. Shin H, Roth HR, Gao M, Lu L, Xu Z, Nogues I, et al. Deep Convolutional Neural Networks for Computer-Aided Detection:
CNN Architectures, Dataset Characteristics and Transfer Learning. IEEE Trans Med Imaging 2016 May;35(5):1285-1298
[FREE Full text] [doi: 10.1109/TMI.2016.2528162] [Medline: 26886976]
19. Romero A, Gatta C, Camps-Valls G. Unsupervised Deep Feature Extraction for Remote Sensing Image Classification.
IEEE Trans. Geosci. Remote Sensing 2016 Mar;54(3):1349-1362. [doi: 10.1109/tgrs.2015.2478379]
20. Soleymani S, Dabouei A, Kazemi H, Dawson J, Nasrabadi N. Multi-level feature abstraction from convolutional neural
networks for multimodal biometric identification. New York, NY: IEEE; 2018 Presented at: 24th International Conference
on Pattern Recognition (ICPR); August 20-24, 2018; Beijing, China. [doi: 10.1109/icpr.2018.8545061]
21. Ioffe S, Szegedy C. Batch normalization: accelerating deep network training by reducing internal covariate shift. arXiv
2021.
http://www.jmir.org/2021/2/e23920/ J Med Internet Res 2021 | vol. 23 | iss. 2 | e23920 | p. 9
(page number not for citation purposes)
XSL• FO
RenderXJOURNAL OF MEDICAL INTERNET RESEARCH Choi et al
22. Raghu M, Poole B, Kleinberg J, Ganguli S, Dickstein J. On the expressive power of deep neural networks. In: Proceedings
of the 34th International Conference on Machine Learning (Volume 70). 2017 Presented at: 34th International Conference
on Machine Learning; August 2017; Sydney, Australia URL: https://dl.acm.org/doi/pdf/10.5555/3305890.3305975
23. Arora R, Basu A, Mianjy P, Mukherjee A. Understanding deep neural networks with rectified linear units. arXiv 2021.
24. Srivastava N, Hinton G, Krizhevsky A, Sutskever I, Salakhutdinov R. Dropout: a simple way to prevent neural networks
from overfitting. Journal of Machine Learning Research 2014;15(1):1929-1958 [FREE Full text]
25. Rubinstein RY, Kroese DP. The Cross-Entropy Method: A Unified Approach to Combinatorial Optimization, Monte-Carlo
Simulation and Machine Learning. Cham, Switzerland: Springer Science & Business Media; 2013.
26. Kingma DP, Ba JA. A method for stochastic optimization. arXiv 2021.
27. Bridle J. Training stochastic model recognition algorithms as networks can lead to maximum mutual information estimation
of parameters. Adv Neural Inform Process Syst 1990;2:211-217.
28. Thee C, Ilies C, Gruenewald M, Kleinschmidt A, Steinfath M, Bein B. Reliability of the surgical Pleth index for assessment
of postoperative pain: a pilot study. Eur J Anaesthesiol 2015 Jan;32(1):44-48. [doi: 10.1097/EJA.0000000000000095]
[Medline: 24827966]
29. Gram M, Erlenwein J, Petzke F, Falla D, Przemeck M, Emons MI, et al. Prediction of postoperative opioid analgesia using
clinical-experimental parameters and electroencephalography. Eur J Pain 2017 Feb;21(2):264-277. [doi: 10.1002/ejp.921]
[Medline: 27470494]
30. Lötsch J, Ultsch A, Kalso E. Prediction of persistent post-surgery pain by preoperative cold pain sensitivity: biomarker
development with machine-learning-derived analysis. Br J Anaesth 2017 Oct 01;119(4):821-829 [FREE Full text] [doi:
10.1093/bja/aex236] [Medline: 29121286]
31. Tighe PJ, Harle CA, Hurley RW, Aytug H, Boezaart AP, Fillingim RB. Teaching a Machine to Feel Postoperative Pain:
Combining High-Dimensional Clinical Data with Machine Learning Algorithms to Forecast Acute Postoperative Pain. Pain
Med 2015 Jul;16(7):1386-1401 [FREE Full text] [doi: 10.1111/pme.12713] [Medline: 26031220]
32. Raghu S, Sriraam N, Temel Y, Rao SV, Kubben PL. EEG based multi-class seizure type classification using convolutional
neural network and transfer learning. Neural Netw 2020 Apr;124:202-212. [doi: 10.1016/j.neunet.2020.01.017] [Medline:
32018158]
33. Zhai X, Jelfs B, Chan RHM, Tin C. Self-Recalibrating Surface EMG Pattern Recognition for Neuroprosthesis Control
Based on Convolutional Neural Network. Front Neurosci 2017;11:379 [FREE Full text] [doi: 10.3389/fnins.2017.00379]
[Medline: 28744189]
34. Parvaneh S, Rubin J, Rahman A, Conroy B, Babaeizadeh S. Analyzing single-lead short ECG recordings using dense
convolutional neural networks and feature-based post-processing to detect atrial fibrillation. Physiol Meas 2018 Aug
23;39(8):084003. [doi: 10.1088/1361-6579/aad5bd] [Medline: 30044235]
35. Xia Y, Wulan N, Wang K, Zhang H. Detecting atrial fibrillation by deep convolutional neural networks. Comput Biol Med
2018 Feb 01;93:84-92. [doi: 10.1016/j.compbiomed.2017.12.007] [Medline: 29291535]
36. Ahonen J, Jokela R, Uutela K, Huiku M. Surgical stress index reflects surgical stress in gynaecological laparoscopic day-case
surgery. Br J Anaesth 2007 Apr;98(4):456-461 [FREE Full text] [doi: 10.1093/bja/aem035] [Medline: 17350969]
37. Lim H, Kim B, Noh G, Yoo SK. A Deep Neural Network-Based Pain Classifier Using a Photoplethysmography Signal.
Sensors (Basel) 2019 Jan 18;19(2):384 [FREE Full text] [doi: 10.3390/s19020384] [Medline: 30669327]
38. Lee J, Choi B, Jung Y, Lee Y, Bang J, Noh G. Evaluation of Surgical Pleth Index and Analgesia Nociception Index as
surrogate pain measures in conscious postoperative patients: an observational study. J Clin Monit Comput 2020
Oct;34(5):1087-1093. [doi: 10.1007/s10877-019-00399-5] [Medline: 31628569]
39. Calvey TN, Wareing M, Williams NE, Chan K. Pharmacokinetics and pharmacological effects of neostigmine in man. Br
J Clin Pharmacol 1979 Mar;7(2):149-155 [FREE Full text] [doi: 10.1111/j.1365-2125.1979.tb00915.x] [Medline: 216382]
40. Parlow JL, van Vlymen JM, Odell MJ. The duration of impairment of autonomic control after anticholinergic drug
administration in humans. Anesth Analg 1997 Jan;84(1):155-159. [doi: 10.1097/00000539-199701000-00028] [Medline:
8989017]
41. Miu AC, Heilman RM, Miclea M. Reduced heart rate variability and vagal tone in anxiety: trait versus state, and the effects
of autogenic training. Auton Neurosci 2009 Jan 28;145(1-2):99-103. [doi: 10.1016/j.autneu.2008.11.010] [Medline:
19059813]
Abbreviations
AUC: area under the curve
CNN: convolutional neural network
PPG: photoplethysmogram
ReLU: rectified linear unit
SPI: surgical pleth index
VAS: Visual Analog Scale
http://www.jmir.org/2021/2/e23920/ J Med Internet Res 2021 | vol. 23 | iss. 2 | e23920 | p. 10
(page number not for citation purposes)
XSL• FO
RenderXJOURNAL OF MEDICAL INTERNET RESEARCH Choi et al
Edited by G Eysenbach; submitted 27.08.20; peer-reviewed by K Chen, H Demir; comments to author 21.09.20; revised version
received 21.09.20; accepted 18.01.21; published 03.02.21
Please cite as:
Choi BM, Yim JY, Shin H, Noh G
Novel Analgesic Index for Postoperative Pain Assessment Based on a Photoplethysmographic Spectrogram and Convolutional Neural
Network: Observational Study
J Med Internet Res 2021;23(2):e23920
URL: http://www.jmir.org/2021/2/e23920/
doi: 10.2196/23920
PMID:
©Byung-Moon Choi, Ji Yeon Yim, Hangsik Shin, Gyujeong Noh. Originally published in the Journal of Medical Internet Research
(http://www.jmir.org), 03.02.2021. This is an open-access article distributed under the terms of the Creative Commons Attribution
License (https://creativecommons.org/licenses/by/4.0/), which permits unrestricted use, distribution, and reproduction in any
medium, provided the original work, first published in the Journal of Medical Internet Research, is properly cited. The complete
bibliographic information, a link to the original publication on http://www.jmir.org/, as well as this copyright and license information
must be included.
http://www.jmir.org/2021/2/e23920/ J Med Internet Res 2021 | vol. 23 | iss. 2 | e23920 | p. 11
(page number not for citation purposes)
XSL• FO
RenderXYou can also read