WER-BERT: Automatic WER Estimation with BERT in a Balanced Ordinal Classification Paradigm
←
→
Page content transcription
If your browser does not render page correctly, please read the page content below
WER–BERT: Automatic WER Estimation with BERT in a Balanced
                                                           Ordinal Classification Paradigm

                                             Akshay Krishna Sheshadri*                   Anvesh Rao Vijjini*            Sukhdeep Kharbanda

                                                                  Samsung R&D Institute India - Bangalore
                                                         {a.sheshadri,a.vijjini,sukhdeep.sk}@samsung.com

                                                                 Abstract                           systems. WER is widely considered as the standard
                                                                                                    metric for ASR evaluation. A higher WER means
                                              Automatic Speech Recognition (ASR) sys-               a higher percentage of errors between the ground
                                              tems are evaluated using Word Error Rate
arXiv:2101.05478v2 [cs.CL] 13 Feb 2021

                                                                                                    truth and the transcription from the system. WER
                                              (WER), which is calculated by comparing the
                                              number of errors between the ground truth and
                                                                                                    is calculated by aligning the two text segments us-
                                              the transcription of the ASR system. This cal-        ing string alignment in a dynamic programming
                                              culation, however, requires manual transcrip-         setting. The formula is as follows:
                                              tion of the speech signal to obtain the ground
                                              truth. Since transcribing audio signals is a                                     ERR
                                                                                                                     W ER =                         (1)
                                              costly process, Automatic WER Evaluation (e-                                      N
                                              WER) methods have been developed to auto-
                                                                                                       where ERR is the sum of errors (Insertions,
                                              matically predict the WER of a speech system
                                              by only relying on the transcription and the
                                                                                                    Deletions or Substitutions) between the transcrip-
                                              speech signal features. While WER is a con-           tion and the ground truth. N is number of words
                                              tinuous variable, previous works have shown           in ground truth. As evident from this equation, the
                                              that positing e-WER as a classification prob-         presence of ground truth is necessary for the cal-
                                              lem is more effective than regression. How-           culation of errors, and hence, for WER. However,
                                              ever, while converting to a classification set-       manual transcription of speech at word level is a
                                              ting, these approaches suffer from heavy class        expensive and dilatory process. Hence, the need
                                              imbalance. In this paper, we propose a new
                                                                                                    for an automatic ASR evaluation is important but
                                              balanced paradigm for e-WER in a classifica-
                                              tion setting. Within this paradigm, we also           few attempts have addressed this. Furthermore,
                                              propose WER-BERT, a BERT based architec-              for effectively training, evaluating and judging the
                                              ture with speech features for e-WER. Further-         performance of an ASR system, WER calculation
                                              more, we introduce a distance loss function to        needs to be done on adequate hours of data. As
                                              tackle the ordinal nature of e-WER classifica-        this test set increases, a more accurate estimation
                                              tion. The proposed approach and paradigm              of WER is possible. Since automatic WER evalu-
                                              are evaluated on the Librispeech dataset and a
                                                                                                    ation does not have the bottleneck of manual tran-
                                              commercial (black box) ASR system, Google
                                              Cloud’s Speech-to-Text API. The results and
                                                                                                    scription, it can be calculated over large test sets
                                              experiments demonstrate that WER-BERT es-             leading to more accurate estimates. Because of
                                              tablishes a new state-of-the-art in automatic         the immense popularity of attention based archi-
                                              WER estimation.                                       tectures for text classification (Madasu and Rao,
                                                                                                    2019; Choudhary et al., 2020; Madasu and Rao,
                                         1    Introduction                                          2020a; Rao et al., 2020; Madasu and Rao, 2020b),
                                                                                                    we propose the transformer (Vaswani et al., 2017)
                                         ASR systems are ubiquitous now. They are avail-
                                                                                                    encoder architecture — Bidirectional Encoder Rep-
                                         able across applications such as Voice Assistants,
                                                                                                    resentations from Transformers (BERT) (Devlin
                                         Assisted Living or Hands free device usage. How-
                                                                                                    et al., 2018) for e-WER. BERT is pretrained on
                                         ever, with the widespread usage of ASR systems,
                                                                                                    huge amounts of open domain language and is ex-
                                         there comes a heavy need for ASR Evaluation as
                                                                                                    tensively used for its effectiveness in natural lan-
                                         well - to select, compare or improve alternate ASR
                                                                                                    guage understanding tasks. By pretraining on such
                                              *The authors contributed equally to the work.         data, the model gains knowledge of general do-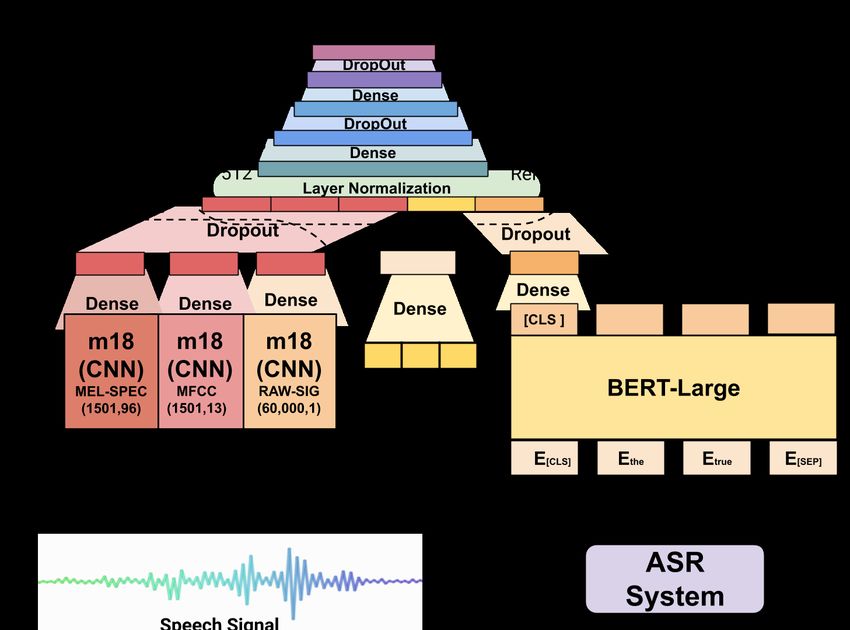
Figure 1: Distribution of WER classes of the 100 hr dataset, using proposed Balanced approach and using the
Elloumi et al. (2018) imbalanced approach. The space between two consecutive vertical lines indicates the size of
a respective class. The blue lines are evenly spaced, whereas the orange lines are spaced irregularly, indicating an
imbalanced distribution.

main language structure which aids in predicting            works directly addressing it. Related works such
speech errors which are typically observed as a             as exploring the word-level confidence in ASR pre-
deviation from the general syntax and semantics             diction are abundant (Seigel and Woodland, 2011;
of a sentence. While previous approaches address            Huang et al., 2013). There have also been works
e-WER (Ali and Renals, 2018; Elloumi et al., 2018,          predicting the errors or error estimates as well in
2019) in classification settings, their models suffer       some form (Ogawa and Hori, 2015, 2017; Seigel
with gross imbalance in the WER classes. To ad-             and Woodland, 2014; Yoon et al., 2010). These
dress this issue, we present a training framework           approaches either predict some of the errors de-
which will always consist of training on equal sized        scribed in WER prediction or alternate metrics to
classes no matter the true WER distribution. Addi-          rate ASR systems such as accuracy or error type
tionally, these previous e-WER classification tasks         classification. However, they lack calculation of
assume that there is no inherent relative ordering to       the complete WER score. Transcrater (Jalalvand
the classes. However, this is not the case with WER         et al., 2016) was one of the first works which aim
classification since a misclassification closer to the      at predicting WER directly. They propose a neural
ground truth will lead to a lower mean absolute             network in a regression setting trained on various
error (MAE) in the WER prediction. Such classifi-           features such as parts of speech, language model,
cation tasks are called Ordinal classification(Frank        lexicon, and signal features. However, more recent
and Hall, 2001).                                            approaches(Ali and Renals, 2018; Elloumi et al.,
   The overall contributions of our paper can be            2018, 2019) phrase WER prediction as a classifica-
summarized follows:                                         tion approach. Ali and Renals (2018) propose two
   (i) A new balanced paradigm for training WER             types of models based on the input available — the
as a classification problem which addresses the             glassbox model which uses internal features of the
label imbalance issue faced by previous works.              target ASR system such as its confidence in tran-
   (ii) WER-BERT - We find that language model              scribing the audio clip; and the black box model
information is helpful in predicting WER and hence          which only uses the transcripts and other features
propose a BERT based architecture e-WER.                    generated from the transcript such as the word and
   (iii) Distance Loss to address the ordinal nature        the grapheme count. They propose a bag-of-words
of WER classification which penalizes misclassi-            model along with additional transcription features
fications differently based on how far off the pre-         such as duration for e-WER.
dicted class is when compared to the real class.
                                                              The black box setting is a harder task since ASR
2   Related Work                                            model features such as the average log likelihood
                                                            and the transcription confidence can give a good
While the importance of an automatic WER predic-            indication on how many errors may have occurred
tion system is immense, there have not been many            during the automatic transcription. However, the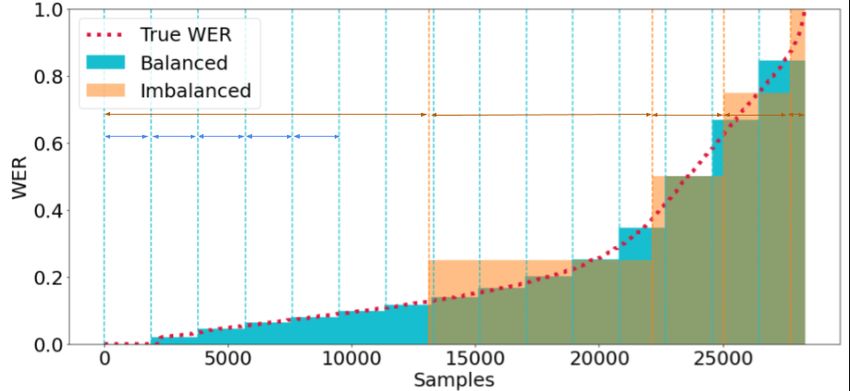
black box approach is not specific to the architec-
tural design of an ASR system and can be used
with any ASR system without access to its inter-
nal metrics such as the aforementioned confidence.
Thus our proposed approach is trained in a black
box setting.
Elloumi et al. (2018, 2019) build a CNN based
model for WER classification. We built mod-
els based on them as baselines to evaluate WER-
BERT’s performance. They are further explained
in the Sections 4 and 6.
ASR errors often make a transcription ungram-
matical or semantically unsound. Identifying such
constructs is also reflected in the dataset of Cor-
pus of Linguistic Acceptability(CoLA) (Warstadt
et al., 2019b,a). CoLA is a dataset intended to
gauge at the linguistic competence of models by
making them judge the grammatical acceptability
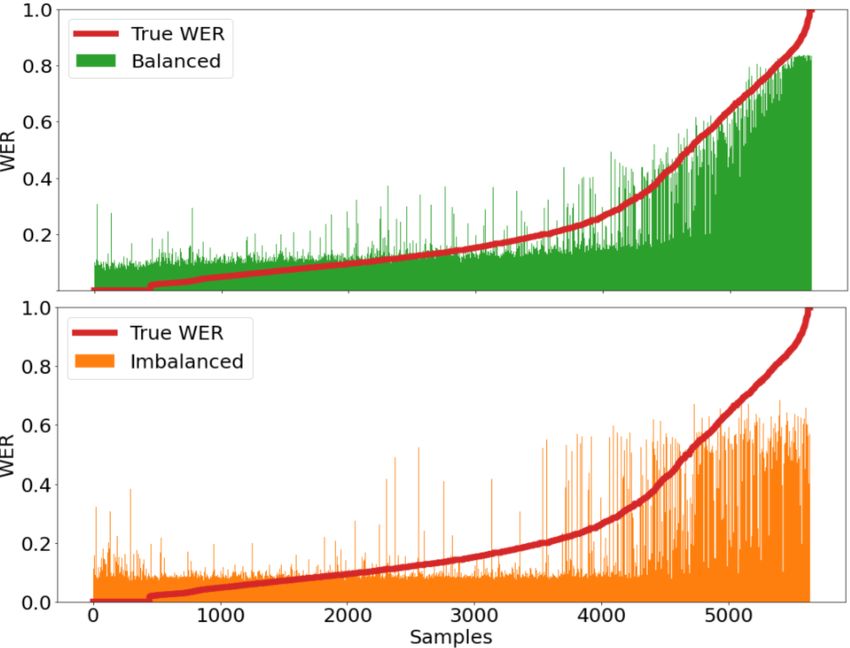
of a sentence. CoLA is also part of the popular Figure 2: Distribution of WER, ERR and Word Count
GLUE benchmark datasets for Natural Language on our Training (Train 100hr) set.
Understanding (Wang et al., 2018). BERT (De-
vlin et al., 2018) is known for outperforming previ-
ous GLUE state-of-the-Art models, including the predicted by our proposed model.
CoLA dataset.
4 Single Task and Double Task for WER
3 Dataset Estimation
For our experiments, we have used the Librispeech As shown in Equation 1, the WER of an utterance
dataset (Panayotov et al., 2015) which is a diverse is the fraction obtained by the division of 2 inte-
collection of audio book data along with the ground gers — Errors per sentence (ERR), which is the
text. It has around 1000 Hours of audio recordings total number of insertions, deletions and substitu-
with different levels of complexity. We pass these tions needed to convert an ASR’s transcript to the
audio clips through an ASR system to get its tran- ground text, and the word count of the ground text
scripts and the WER is calculated by comparing (N). Since the WER of a sentence is a continuous
it with the ground text. This paper reports find- variable between 0 and 1 (mostly), a common way
ings in the experiments run with Google Cloud’s to model this is through a regression model. El-
Speech-to-Text API. We chose this commercial loumi et al. (2018, 2019) instead present a way to
ASR system, rather than reporting results on an turn this into a classification problem for e-WER.
internal ASR system, since it’s easily accessible They experiment with various combinations of text
through the google-api and the results are repro- and audio signal inputs and show that a classifica-
ducible. For our experiments, we have used the 10 tion approach outperforms its corresponding regres-
and 100 hour datasets and made a 60:20:20 split sion approach trained on the same inputs. Elloumi
into train, dev and test sets for each dataset. As can et al. (2018)’s approach estimates WER directly
be seen in Table 1 of Section B of the Appendix, with a 6 class classification model (with classes
the characteristics of the 100 and 10 hour datasets corresponding to 0%, 25%, 50%, 75%, 100% and
are quite different. However, within a dataset, the 150%). Once the model is trained, the predictions
train, dev and test sets have similar distributions are calculated as follows:
of WER and other characteristics. Table 1 lists a
W ERP red (s) = Psof tmax (s) · W ERf ixed (2)
few examples with each row having the ground
text, the transcript obtained from Google Cloud’s
where s is a sample, W ERP red is the predicted
Speech-to-Text API, the True WER and the WER
WER for s, Psof tmax (s) is the softmax probabil-
https://cloud.google.com/speech-to-text. ity distribution output by the classification model,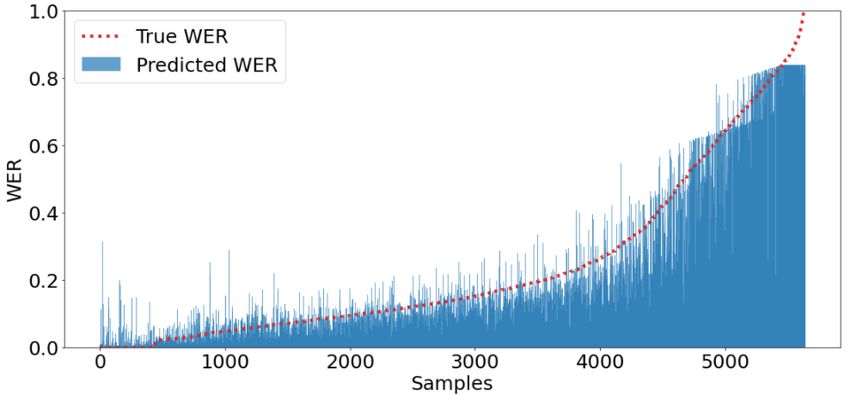
W ERf ixed = [0, 0.25, 0.5, 0.75, 1.0, 1.5] is the            divided uniformly will be ns = (D/K). A class
fixed vector and ‘·’ is the dot product operator. We          Ci will be defined as the samples with WER in the
call this approach as the Single Task method for e-           range: [w(i−1)∗ns , w(i)∗ns ] where i ∈ {1, 2, ...K}.
WER. Alternatively, Ali and Renals (2018) present             This is shown in Figure 1 where K = 15 classes
another classification approach for e-WER. They               are made with equal number of samples in each.
argue that the calculation of WER relies on two               The WER value W ERF ixedi associated with each
distinct calculations — ERR and N. Since both                 class Ci is defined as the mean WER of that class:
of them are discrete integers, they propose two in-
                                                                                           (i)∗ns
dependent classification problems to the estimate                                           X         wj
errors in the sentence ERRest. and to estimate the                      W ERF ixedi =                          (3)
                                                                                                      ns
Word Count of the ground text Nest. . The predicted                                      j=(i−1)∗ns

WER is then calculated as (ERRest. /Nest. ). We                  Once W ERF ixed is calculated, we use Equation
call this approach as the Double Task method for              2 to compute the predicted WER of a sample using
e-WER.                                                        Psof tmax calculated from a neural network model.
4.1   The Problem of Class Imbalance                          Apart from being balanced, this approach also has
                                                              the benefit of generating classes which fits the true
While these approaches had good results, both                 WER curve better than the previous approach as
of them suffer from the problem of imbalanced                 show in Figure 1. It’s important to understand that
classes. As we can seen from Figure 2, the ERR                while the ERR estimation in the Double Task set-
and the WER are highly imbalanced. The nature of              ting of Ali and Renals (2018) is also imbalanced,
WER is such that it is very less likely for this task         it can’t be mapped into arbitrary classes based on
to be balanced for any data and any ASR system.               ordering. Since WER is a continuous variable, un-
This imbalance leads to poor performance due to               like ERR, it is possible to decide the boundary for
certain WER or ERR classes having very few sam-               a WER class arbitrarily to create balanced sets.
ples in them. With Elloumi et al. (2018), all the true
WER’s are ‘cast’ to the nearest multiple of 0.25.             5   WER-BERT
It can be seen from Figure 2 that the number of
samples belonging to a class varies tremendously              In this section we explain our proposed architecture
in this imbalanced setting. This leads to the model           WER-BERT, which is primarily made of four sub-
having poor performance, especially in the higher             networks. Our architecture is shown with details in
WER ranges. Moreover, different ASR systems                   Figure 3.
will have their own distributions and some may be                Signal Sub-network: Elloumi et al. (2018) use
relatively well balanced in some ranges while other           the raw signal of the audio clip to generate features
may be much worse. This approach is not scalable              such as MFCC and Mel Spectrogram. They are fea-
and it fails to generalize a method for creating bal-         tures commonly used in the design of ASR systems,
anced class distributions, irrespective of the ASR            particularly systems which use an acoustic model
system.                                                       and furthermore these features aid their model per-
                                                              formance. These signal features are passed through
4.2   Proposed Balanced Division                              the m18 architecture (Dai et al., 2017). m18 is a
We propose an alternate paradigm for creating                 popular deep convolutional neural network (CNN)
WER class distributions. We extend the single task            used for classification with audio signal features.
setting for e-WER to a balanced WER class distri-             This CNN model has 17 convolutional+max pool-
bution irrespective of the dataset and ASR system.            ing layers which is followed by global average
Instead of fixing a list of WER values based on               pooling. L2 Regularization of 1e − 4 and Batch
a factor such as 0.25 to represent the classes, the           Normalization are added after each of the convolu-
total number of classes desired K is decided. Let             tional layers.
w1 , w2 , w3 , ....wD be the WERs of individual sam-             Numerical Features Sub-network: Ali and
ples ordered in an ascending manner where D is                Renals (2018) black box models had two ma-
the total number of samples in the corpus. Then the           jor components — text input and numerical fea-
number of samples in each of the K classes when               tures. These numerical features are important to
     Refer to Section A.2 of the appendix for tuning of the   the model as they contain information regarding
class hyperparameter K                                        the number of errors. For instance, in ASR sys-
Figure 3: Proposed WER-BERT tems, there are errors if a user speaks too fast or merical sub-network and the signal sub-network). too slow and this is directly reflected in the du- It has 4 hidden layers (512, 256, 128 and 64 ration and word count features. The numerical neurons) followed by the output softmax layer. features we have used are Word Count, Grapheme Dropout regularization is added to prevent overfit- Count and Duration. These features are concate- ting considering the large amount of parameters. To nated and passed through a simple feed forward account for outputs from the eclectic sub-networks network which is used to upscale the numerical with disparate distributions, we further add Layer features fed into the model (from 3 to 32). Normalization (Ba et al., 2016) before concate- BERT: Bi-directional Encoder Representations nation. Normalization is important to lessen the (BERT) (Devlin et al., 2018) is a pre-trained unsu- impact of any bias the network may learn towards pervised natural language processing model. It is one or the other representations. a masked language model which has been trained Distance Loss for Ordinal Classification: on a large corpus including the entire Wikipedia Typical classification problems deal with classes corpus. The transcription samples from the ASR which are mutually exclusive and independent such system, are passed through the associated tokenizer as sentiment prediction or whether an image is a which gives a contextual representation for each cat or a dog. In such a setting, classification accu- word. It also adds 2 special tokens — the [CLS] racy is the most important metric and there is no token at the beginning and the [SEP] token at the relation or relative ordering between the classes. end of the sentence. We have used the BERT-Large However, e-WER in a classification setting is an or- Uncased variant. The large variant has 24 stacked dinal classification problem (Frank and Hall, 2001). transformer Vaswani et al. (2017) encoders. It gives Previous approaches which propose WER estima- an output of the shape (Sequence Length X 1024) tion as classification tasks ignore this idea (Elloumi of which only the 1024 shaped output correspond- et al., 2018; Ali and Renals, 2018; Elloumi et al., ing to the [CLS] token is used. In WER-BERT, 2019). While the classification accuracy is impor- BERT weights are fine tuned with rest of architec- tant, it is more important that given a sample is ture during training. misclassified, the predicted label is close to the Feed Forward Sub-Network: This sub- true label. For instance, if the true label corre- network is a deep fully connected network which sponds to the WER class of 0.1, a prediction of 0.2 is used to concatenate and process the features gen- and a prediction of 0.7 are treated the same in the erated by the sub-networks predating it (BERT, nu- current classification scenario. Since we want the
Ground Truth                                       Google Cloud’s Speech-to-Text                            True    Predicted
                                                       Transcription                                            WER     WER
 one historian says that an event was produced by      when is dorian says that an event was produced           16.7    16.5
 napoleon’s power another that it was produced by      by napoleon’s power another that it was produced
 alexander’s                                           by alexander’s
 rynch watched dispassionately before he caught        wrench watch dispassionately before he caught a          21.9    22.1
 the needler jerking it away from the prisoner the     kneeler jerking it away from the prisoner the man
 man eyed him steadily and his expression did          i can steadily and his expression did not alter even
 not alter even when rynch swung the off world         when wrench swampy off world weapon to center
 weapon to center its sights on the late owner         its sights on the late owner
 of acting a father’s part to augustine until he was   acting a father’s part 2 augustine until he was fairly   42.8    42.7
 fairly launched in life he had a child of his own     launched in life
 supported by an honorable name how could she ex-      supported by an honorable name how could you             14.3    14.4
 tricate herself from this labyrinth to whom would     extricate herself in this labyrinth to whom would
 she apply to help her out of this painful situation   she apply to help her out of this painful situation
 debray to whom she had run with the first instinct    dubray to whom should run the first instinct of a
 of a woman towards the man she loves and who          woman towards the man she loves and who yep
 yet betrays her                                       betrays her
 seventeen twenty four                                 1724                                                     100.0   30.7
 saint james’s seven                                   st james 7                                               100.0   32.1
 mamma says i am never within                          mama says i am never with him                            50.0    13.44

                        Table 1: Some examples of the proposed approach’s WER Prediction

Figure 4: WER Predicted by WER-BERT SOTA model as compared to the True WER of all samples (Test 100hr)

prediction to be as close as possible, if not exactly              performance of all the runs on the test set. For all
the same, we introduce a “distance” loss which is                  the experiments, we use Crossentropy as the loss
Lcustom (s) = Lθ (s) + α ∗ γ and γ is as follows                   function and M AE of W ER as the evaluation
                                                                   metric.
 |ypred (s) · W ERf ixed − ytrue (s) · W ERf ixed |
                                                (4)
                                                                   6.1     BOW
where s is a sample, α is a hyperparameter (we                     Bag of Words + Num. Feat.(Black Box): Fol-
have used α = 50 in our experiments), Lθ (s) is the                lowing (Ali and Renals, 2018), we build a black
cross entropy loss, ytrue (s) is a one hot vector rep-             box model for the double task estimation of ERR
resenting the true WER class of s and ypred is the                 and word count.The word count estimation task
estimated probability distribution of s over all the               was treated as a 46 class classification model with
classes output by the softmax of the classification                class 1 corresponding to word count of 2, class
model.                                                             46 with word count of 47 (90th percentile). Simi-
                                                                   larly, the ERR estimation task was modelled as a
6     Experiments And Baselines
                                                                   20 class classification problem with class 0 corre-
For each of the experiments below, the training                    sponding to no errors and class 19 corresponding to
is repeated for 10 runs and we report the average                  19 errors(90th percentile). Both of these tasks are
    Refer to Section A.1 of the appendix for tuning of the         handled by logistic regression models which use
Distance Loss hyperparameter α                                     Bag of Words features for both the words present in
the sentence as well as the graphemes (monograms line to compare against Bert-large since that does
and bigrams) of the sentence. These features are not have signal features as well. This model is
concatenated with numerical features such as word trained in our balanced class setting with 15 classes
count, grapheme count and the duration and then explained in Section 4.2.
fed to a feedforward network. Dropouts are also CNN-text + RAWSIG (Double Task): The
added after each layer to prevent overfitting. best architecture in Elloumi et al. (2018) was
trained in the double task setting proposed by (Ali
6.2 CNN and Renals, 2018). The ERR estimation was mod-
Following, Elloumi et al. (2018) for e-WER. These elled as a 20 class task and the word count estima-
CNN models use ASR transcript and signal fea- tion was modelled as a 46 class task.
tures (Raw signal, MFCC and Mel Spectrogram) CNN-text + RAWSIG (Elloumi et al., 2018):
as inputs and CNN for learning features from the This was the best architecture proposed by El-
textual transcription itself. loumi et al. (2018). This is a single task approach
Text Input: The text input is padded to T words which uses the imbalanced WER class distribu-
(where T was taken as 50, the 95th percentile of the tion (classes corresponding to WER of 0, 0.25...1.5
sentence length) and was transformed into a matrix WER).
Embeddings of the size N XM where M is the CNN-text + RAWSIG (Balanced): Same
embedding size (300). These embeddings were model as CNN-text + RAWSIG but trained in our
obtained from GloVe (Pennington et al., 2014). The balanced class setting with 15 classes explained in
CNN architecture is Kim (2014). Section 4.2.
Signal Inputs: CNN-text + MFCC + MELSPEC + RAWSIG
(Balanced): Instead of using only RAWSIG input,
RAWSIG: This input is obtained by sampling
we pass all 3 signal features into their respective
the audio clip at 8KHz and max duration was set
m18 models. The outputs of the KIM CNN model
to 15s; shorter audio clips were padded while the
(for the text input) and each of these m18 models
longer ones were clipped. While using this with the
are concatenated and processed in same fashion as
M18 architecture, it was further down-sampled to
WER-BERT explained in Section 5.
4KHz due to memory constraints and its dimension
is 60000X1. 6.3 BERT architectures
MELSPEC: This input was calculated with 96
dimensional vectors, each of which corresponds Experiments are carried with the architecture de-
to a particular Mel frequency range. They were scribed in Section 5. We carry out Ablation studies
extracted every 10ms with an analysis window of to identify important input features in isolation. We
25ms and its dimension is 1501X96. start with the full architecture shown in section 5
and subsequently remove sub-networks to compare
MFCC: This input was calculated by comput-
performance. All the experiments except for the
ing 13 MFCCs every 10ms and its dimension is
distance loss one are carried out with Crossentropy
1501X13.
as the loss and M AE of W ER as the evaluation
These signal features are used as an input to the
metric and are trained with the balanced classes
M18 architecture Dai et al. (2017) (refer to Section
paradigm.
5: Signal sub-network). For joint use of both text
and signal inputs, the outputs of the text and signal
7 Results and Discussion
sub-networks are followed by a hidden layer (512
processing units) whose outputs are concatenated Table 2 captures the results of proposed approach
(with a dropout regularization of 0.1 being applied with previous approaches along with ablation stud-
between the hidden layer and the concatenation ies for the proposed approach. While the WER of
layer). This is followed by 4 hidden layers (of 512, the 10 hour dataset is low (≈10) and the 100 hour
256, 128 and 64 neurons) and the output layer with dataset is high (≈20), we see that the proposed
Dropout regularization added to prevent overfitting approach models both effectively. Figure 4 shows
due to the large amount of parameters that WER-BERT’s estimation of WER closely fol-
CNN-text (balanced): While Elloumi et al. lows the true WER curve. Furthermore, due to the
(2018) show that just CNN-text isn’t enough to proposed balanced paradigm, it is able to predict
get good results. This experiment provides a base- well in the mid-high WER classes even with lessMAE RMSE MAE RMSE
Model WER WER WER WER
100 hour 100 hour 10 hour 10 hour
BoW Bag of Words
16.45 26.76 12.65 19.66
+ Num. Feat.(Black Box) (Ali and Renals, 2018)
CNN-text (Balanced) 14.44 18.9 13.08 18.79
CNN-text + RAWSIG (Double Task) 14.09 18.11 19.36 24.79
CNN CNN-text
11.34 16.74 13.3 17.48
+ RAWSIG (Elloumi et al., 2018)/(Imbalanced)
CNN-text + RAWSIG (Balanced) 9.65 13.64 11.3 15.89
CNN-text
9.35 11.84 10.11 15.17
+ MFCC + MELSPEC + RAWSIG / Signal Feat. (Balanced)
BERT-large 12.04 17.98 11.19 16.38
BERT-large + Num. Feat. 11.03 16.09 9.92 14.58
WER-BERT BERT-large + MFCC + MELSPEC + RAWSIG 8.15 11.43 9.12 14.17
BERT-large + Num. Feat. + Signal Feat. 6.91 10.01 8.89 13.52
BERT-large + Num. Feat. + Signal Feat. + Distance Loss 5.98 8.82 7.37 12.67
Table 2: Performance Comparison.
samples in this region. Figure 5 shows the com- can steadily.” being identified by BERT’s language
parison of Balanced and Imbalanced class setting. model. Furthermore, even when our model predicts
Comparing Figure 4 and 5, we see that the WER- a far off WER, it does so in a justified manner. The
BERT models much better in the lower and mid transcription “1724” and “st james 7” give a high
regions compared to the CNN balanced model. True WER score whereas WER-BERT identifies
these sequences as correct and probable and gives
7.1 Effectiveness of WER-BERT and low scores. Since WER matches strings exactly, it
Ablation Studies ends up giving a 100% error in this case due to li-
The best WER-BERT model, with all Num., Signal brary’s text processing limitations. Note that while
feats. and distance loss outperforms other models we use BERT, the language model itself can be any
in both MAE and RMSE metrics. In particular, transformer, since they all have the common idea
we see that a BERT model outperforms the corre- that LM backing helps identifying speech errors in
sponding CNN model with the same inputs - 14.44 ways CNN models can’t.
v/s 12.04 & 13.08 v/s 11.19 for the CNN-text and
7.2 Effectiveness of proposed balancing
BERT-large model in the 100 hour and 10 hour
setting
data respectively (and similar results for the CNN-
text + signal feat and BERT-large + signal feat We use the best architecture reported by Elloumi
models). We credit effectiveness of BERT at its et al. (2018): CNN-text + RAWSIG for compar-
language model information and ability to identify ing the three paradigms. Balanced outperforms the
improbable word sequences which often correlate Double Task approach of Ali and Renals (2018)
with transcription errors. Models such as CNN, and Single Task approach Elloumi et al. (2018)
while being effective, lack the backing of a lan- (9.65 v/s 11.34 v/s 14.09 for the 100 Hour set).
guage model and hence fail to do the same. While The class imbalance in their approach causes bias
this is important, it alone fails to beat the earlier towards the largest classes during training, where
approaches which utilise signal features i.e. Mak- most of the predictions end up. This especially
ing a WER prediction from just the transcription harms the WER prediction in higher ranges where
is not enough. Signal features tells us how an ut- number of samples are less. Figure 5 shows the
terance was spoken along with background noise. performance difference between CNN + RAWSIG
This contains valuable information such as signal models in the new balanced paradigm and the im-
noise which correlates with higher WER. The ef- balanced Elloumi et al. (2018) setting. Since the
fectiveness of WER-BERT is particularly evident model encounters heavily imbalanced labels in the
in Table 1 where we see that it is able to predict later setting, its predictions also reflect the same.
WER which is very close to the True WER. We There are only two kinds of predictions - one cor-
hypothesize this is due to irregular word sequences responding to the lowest WER class (also largest
such as “..when is dorian says..” or “..the man i in number as seen in Figure 1) and another in theFigure 5: WER Predicted by the CNN + RAWSIG (Balanced) and CNN + RAWSIG (Elloumi et al., 2018) (Imbal-
anced) as compared to True WER for all samples (Test 100hr)
confusion matrix of WER classification visualized
with and without the custom loss. Due to the cus-
tom loss the models predicted class is much closer
to the ground truth class represented by the diag-
onal of the matrix. This is due to distance loss’
ability to penalize far off predictions which is lack-
(a) with Distance Loss (b) w/o Distance Loss ing in typical classification loss functions such as
cross-entropy. We see an improvement of nearly 1
Figure 6: Confusion Matrices of the BERT-large + All
MAE with this.
Features model
8 Conclusion
range of second largest class. The information of
the other classes are mostly ignored due to being We propose WER-BERT for Automatic WER Es-
present in low numbers. Meanwhile, the balanced timation. While BERT is an effective model, ad-
paradigm fits the slope of the curve after 40 WER dition of speech signal features boosts the perfor-
well. The range of > 40 WER is tough for the mance. Phrasing WER classification as a ordinal
model to predict as the number of samples avail- classification problem by training using a custom
able in this region is lesser than samples in < 40 distance loss encodes the information regarding
WER (almost 70% of data). Despite this, balanced relative ordering of the WER classes into the train-
paradigm effectively divides this area into adequate ing. Finally, we propose a balanced paradigm for
number of classes for good performance. While training WER estimation systems. Training in a
the performance in the mid region (20-40 WER) is balanced setting allows proposed model to predict
poor for this model, custom loss and BERT model WER adequately even in regions where samples
in WER-BERT take care of this as seen in Figure are scarce. Furthermore, this balanced paradigm is
4. independent of WER prediction model, ASR sys-
tem or the speech dataset, making it efficient and
7.3 Effectiveness of Distance loss scalable.
Addition of Distance loss to WER-BERT certainly
improves the performance. In Figure 6 we see the Number of WER classes K = 15References 2019 Conference on Empirical Methods in Natu-
ral Language Processing and the 9th International
Ahmed Ali and Steve Renals. 2018. Word error rate es- Joint Conference on Natural Language Processing
timation for speech recognition: e-wer. In Proceed- (EMNLP-IJCNLP), pages 5662–5671.
ings of the 56th Annual Meeting of the Association
for Computational Linguistics (Volume 2: Short Pa- Avinash Madasu and Vijjini Anvesh Rao. 2020a. A
pers), pages 20–24. position aware decay weighted network for as-
pect based sentiment analysis. arXiv preprint
Jimmy Lei Ba, Jamie Ryan Kiros, and Geoffrey E Hin- arXiv:2005.01027.
ton. 2016. Layer normalization. arXiv preprint
arXiv:1607.06450. Avinash Madasu and Vijjini Anvesh Rao. 2020b. Se-
quential domain adaptation through elastic weight
Nurendra Choudhary, Nikhil Rao, Sumeet Katariya, consolidation for sentiment analysis. arXiv preprint
Karthik Subbian, and Chandan K Reddy. 2020. Self- arXiv:2007.01189.
supervised hyperboloid representations from logi-
cal queries over knowledge graphs. arXiv preprint Atsunori Ogawa and Takaaki Hori. 2015. Asr er-
arXiv:2012.13023. ror detection and recognition rate estimation us-
ing deep bidirectional recurrent neural networks.
Wei Dai, Chia Dai, Shuhui Qu, Juncheng Li, and In 2015 IEEE International Conference on Acous-
Samarjit Das. 2017. Very deep convolutional neural tics, Speech and Signal Processing (ICASSP), pages
networks for raw waveforms. In 2017 IEEE Interna- 4370–4374. IEEE.
tional Conference on Acoustics, Speech and Signal
Processing (ICASSP), pages 421–425. IEEE. Atsunori Ogawa and Takaaki Hori. 2017. Error de-
tection and accuracy estimation in automatic speech
Jacob Devlin, Ming-Wei Chang, Kenton Lee, and recognition using deep bidirectional recurrent neural
Kristina Toutanova. 2018. Bert: Pre-training of deep networks. Speech Communication, 89:70–83.
bidirectional transformers for language understand-
ing. arXiv preprint arXiv:1810.04805. Vassil Panayotov, Guoguo Chen, Daniel Povey, and
Sanjeev Khudanpur. 2015. Librispeech: an asr
Zied Elloumi, Laurent Besacier, Olivier Galibert, Juli- corpus based on public domain audio books. In
ette Kahn, and Benjamin Lecouteux. 2018. Asr 2015 IEEE International Conference on Acoustics,
performance prediction on unseen broadcast pro- Speech and Signal Processing (ICASSP), pages
grams using convolutional neural networks. In 5206–5210. IEEE.
2018 IEEE International Conference on Acoustics,
Speech and Signal Processing (ICASSP), pages Jeffrey Pennington, Richard Socher, and Christopher D
5894–5898. IEEE. Manning. 2014. Glove: Global vectors for word rep-
resentation. In Proceedings of the 2014 conference
Zied Elloumi, Olivier Galibert, Benjamin Lecouteux, on empirical methods in natural language process-
and Laurent Besacier. 2019. Investigating robust- ing (EMNLP), pages 1532–1543.
ness of a deep asr performance prediction system.
Vijjini Anvesh Rao, Kaveri Anuranjana, and Radhika
Eibe Frank and Mark Hall. 2001. A simple approach Mamidi. 2020. A sentiwordnet strategy for curricu-
to ordinal classification. In European Conference on lum learning in sentiment analysis. arXiv preprint
Machine Learning, pages 145–156. Springer. arXiv:2005.04749.
Po-Sen Huang, Kshitiz Kumar, Chaojun Liu, Yifan Matthew Stephen Seigel and Philip C Woodland. 2011.
Gong, and Li Deng. 2013. Predicting speech recog- Combining information sources for confidence esti-
nition confidence using deep learning with word mation with crf models. In Twelfth Annual Confer-
identity and score features. In 2013 IEEE Interna- ence of the International Speech Communication As-
tional Conference on Acoustics, Speech and Signal sociation.
Processing, pages 7413–7417. IEEE.
Matthew Stephen Seigel and Philip C Woodland.
Shahab Jalalvand, Matteo Negri, Marco Turchi, 2014. Detecting deletions in asr output. In
José GC de Souza, Daniele Falavigna, and Mo- 2014 IEEE International Conference on Acoustics,
hammed RH Qwaider. 2016. Transcrater: a tool for Speech and Signal Processing (ICASSP), pages
automatic speech recognition quality estimation. In 2302–2306. IEEE.
Proceedings of ACL-2016 System Demonstrations,
pages 43–48. Ashish Vaswani, Noam Shazeer, Niki Parmar, Jakob
Uszkoreit, Llion Jones, Aidan N Gomez, Łukasz
Yoon Kim. 2014. Convolutional neural net- Kaiser, and Illia Polosukhin. 2017. Attention is all
works for sentence classification. arXiv preprint you need. In Advances in neural information pro-
arXiv:1408.5882. cessing systems, pages 5998–6008.
Avinash Madasu and Vijjini Anvesh Rao. 2019. Se- Alex Wang, Amanpreet Singh, Julian Michael, Felix
quential learning of convolutional features for ef- Hill, Omer Levy, and Samuel R Bowman. 2018.
fective text classification. In Proceedings of the Glue: A multi-task benchmark and analysis platformfor natural language understanding. arXiv preprint
arXiv:1804.07461.
Alex Warstadt, Amanpreet Singh, and Samuel R Bow-
man. 2019a. Cola: The corpus of linguistic accept-
ability (with added annotations).
Alex Warstadt, Amanpreet Singh, and Samuel R Bow-
man. 2019b. Neural network acceptability judg-
ments. Transactions of the Association for Compu-
tational Linguistics, 7:625–641.
Su-Youn Yoon, Lei Chen, and Klaus Zechner. 2010.
Predicting word accuracy for the automatic speech
recognition of non-native speech. In Eleventh An-
nual Conference of the International Speech Com-
munication Association.
A Hyperparameter Tuning Details
In this section we explain the tuning and selection
procedure of the proposed experiments’ hyperpa-
rameters, namely the distance loss weight α and
number of classes K. Furthermore, we also attempt
to explain the behaviour of these variables on the
performance in terms of MAE. Figure 7: Distribution of MAE and RMSE for different
values of α against no custom loss in WER-BERT. The
A.1 Tuning Distance Loss Hyperparameter α values here are presented for the 100hr dataset.
Figure 7 shows the effect of varying α with effect
on performance on the 100hr dataset with the WER-
BERT model with and without custom loss. As
evident, we get the lower MAE and RMSE for
α = 50. Lower or higher α leads to decrement in
performance. Recalling Equation 4 from the main
paper:
Lcustom (s) = Lθ (s) + α ∗ γ (5)
where γ is:
|ypred (s) · W ERf ixed − ytrue (s) · W ERf ixed |
(6)
For low values of α (0.0001 to 0.001), in the above
equations Lcustom (s) becomes equal to just Lθ (s)
which the classification cross entropy loss. Hence,
essentially low α performance tends to the line
of No custom loss WER-BERT performance. On Figure 8: Distribution of MAE and RMSE for differ-
the other hand, higher α values weight the cus- ent values of K against Elloumi et al. (2018) approach.
tom loss too much more than the cross entropy The values here are presented for the CNN + RAWSIG
loss. While the decrement in performance isn’t model on the 100hr dataset.
very high, moderate adverse effects still show that,
regular classification cross entropy loss is required
for WER-BERT training.Datasets ERR Duration Length True WER
Train 100hr 8.16 12.74 34.84 23.42
Dev 100hr 8.13 12.70 34.64 23.47
Test 100hr 8.18 12.61 34.50 23.70
Train 10hr 2.65 7.29 20.44 12.97
Dev 10hr 2.28 7.15 19.96 11.40
Test 10hr 2.41 7.18 20.25 11.91
Table 3: Averaged Statistics regarding the Train 100hr and Test 100hr dataset.
A.2 Tuning Class Hyperparameter K
Figure 8 shows the effect on performance of the
CNN + RAWSIG model for varying MAE. We
get the minimum MAE and RMSE at K = 15.
Largely speaking, for lower K, RMSE and MAE
suffer because the new classes no more accurately
depicts the true WER. For example, in Figure 1 of
main paper, we can see that if K = 3 or 4, WERs
in a wide range from 40 to 100 will be clubbed into
a single class despite their huge differences. This
will further make it hard for the model to predict
WERs in this range.
On the other hand, higher K yields new classes
accurate to true WER especially in the higher
ranges(50 to 100), but at the cost of class size.
For example at K=30, each class will have about
900 (28000/30) samples.Furthermore, since True
WER is a highly imbalanced variable, there exists
a long tail in the lower WER regions in Figure 1
of main paper. This WER region is divided into
many classes, despite the WER range being largely
small. For example for K > 30 the model will be
forced to distinguish between nearly four classes
with arbitrary samples of all 0 True WER. Just for
K = 15, model encounters two classes which are
actually both 0 WER. This number of redundant
classes with arbitrary samples will only increase as
K increases.
Furthermore, for a range of values of K, we
see that the balanced CNN + RAWSIG model still
outperforms the CNN + RAWSIG (Elloumi et al.,
2018)’s performance. This further reinforces the
efficacy of the balanced paradigm even with its
senstivity to a hyperparameter.
B Dataset
Additional dataset details are present in Table 3.You can also read