Artificial Intelligence Enabled Dual Diagnostic Based Algorithm For The Detection Of COVID-19 Patients
←
→
Page content transcription
If your browser does not render page correctly, please read the page content below
Annals of R.S.C.B., ISSN: 1583-6258, Vol. 25, Issue 4, 2021, Pages. 18444-18457
Received 05 March 2021; Accepted 01 April 2021

 Artificial Intelligence Enabled Dual Diagnostic Based Algorithm For The
                       Detection Of COVID-19 Patients
                    Swarnava Biswas1, Debajit Sen2, Moumita Mukherjee3
                            1
                             The Neotia University, Kolkata, West Bengal, India
               2
                 Robert Bosch Engineering and Business Solutions, Bangalore, Karnataka, India
         3
           Department of Physics, School of Science, Adamas University, Kolkata, West Bengal, India
                             Email: moumita.mukherjee@adamasuniversity.ac.in

                                                        Abstract
      COVID-19, a global pandemic first surfaced in the city of Wuhan, China and has henceforth transcended
      differently across geographical borders, classes, and genders from different age groups, sometimes
      mutating its own DNA strands in the process as well. Hospitals and medical centres are getting
      overburdened by the sheer magnitude of the spread of the pandemic. While IoT in healthcare had already
      dominated the public discourse, the onset of COVID-19 has been a watershed development. The need of
      the hour is to deploy robots and IoT devices to keep a check on patient’s body vitals, as well as monitor
      their other pathological data to further have a control on the spread. Needless to mention, there has never
      been a more urgent reason as today to mobilize digital innovations for providing healthcare services
      remotely through computing devices and patient-facing artificial intelligence (AI) powered medical aids.
      In this paper our group has developed an AI enabled Decision Support System for automating the entire
      process flow from estimation to detection of COVID-19 subjects as part of an Intelligent Value Chain
      algorithm for the first time. The proposed method is validated and computational complexity is estimated
      in different Single Board Computer (SBC) platform. The NVIDIA Xavier CUDA system provides very
      low training and predicted time when compared to raspberry pi-4 and Jetson Nano.

      Keywords: Artificial Intelligence, Internet of Things, Deep Learning, Machine Learning, COVID-19
      Detection, X-ray, Pathology Data, Stage Classification COVID-19, Raspberry Pi, Intel® Movidius™
      Neural Compute Stick

INTRODUCTION
With data and analytics (Runkler, 2020) including direct and continuous connect with users,
and natural language processing analysing vast amounts of people health data (Ebadi et al.,
2021), the focus has clearly shifted to prevention ahead of cure. The predicted persistence of
COVID (Fauci, Lane, & Redfield, 2020) in the future will necessitate diagnostic testing in
remote location limited by point of care (Gubala, Harris, Ricco, Tan, & Williams, 2012)
facilities. IoT in healthcare is challenged due to low levels of internet coverage, especially in
countries like India (Sonune, Kalbande, Yeole, & Oak, 2017). As a holistic and preventive
system, IoT in healthcare provides a shift from cost-based to value-based healthcare thereby
strengthening existing medical centres limited by facilities (Yuehong, Zeng, Chen, & Fan,
2016). The reason the research group thought of proposing a solution for an IoT enabled
healthcare to make preventative & control the spread as part of the modern health informatics
system (Farahani, Firouzi, & Chakrabarty, 2020).
The motivation behind such a work can be explained in the way the world was found wanting
during the peak stages of the viral spread in most countries (Chakraborty & Maity, 2020). The
requirement for more tests to correctly identify and diagnose was the need of the hour which
some countries failed to achieve. One of the main reasons could be the real time polymerase
chain reaction (RT-PCR) test and the cost that the same demands both from facility and testing
front. Hence the same could not be adopted by some of the local diagnostic centres for a mass
testing. The other pitfall of such a process was the total turnaround time, more than 48 hours
to be specific (Afzal, 2020). Our group has thus tried to propose a reliable estimation and
efficient screening process to make the diagnostic centres ready for any future spike and proper
identification with its available facilities.

                                                                                                          18444
http://annalsofrscb.ro
Annals of R.S.C.B., ISSN: 1583-6258, Vol. 25, Issue 4, 2021, Pages. 18444-18457
Received 05 March 2021; Accepted 01 April 2021

The authors have also proposed a two-step screening process for correct diagnosis of the
disease. The total process time for screening is estimated to be around 15 minutes to 1 hour.
The first step consists of the body sensor-based evaluation of the patient along with
symptomatic analysis. The second step consists of high-resolution computed tomography
(HRCT) evaluation along with the study of pathological data viz-a-viz from blood routine
examination and body sensor vitals. Any radiography-based imaging technique has a higher
sensitivity but lower specificity and can play a role in the diagnosis and treatment of this nature
of disease. The novelty of this paper is thus best described by the above two-fold methodology.

LITERATURE REVIEW
Lassau et al. have presented a deep learning CT scan based model in combination with
biological and clinical variable to predict severity of the COVID-19 patient. This is a multi-
hypothesis based approach where the authors have collated 58 clinical and biological data along
with CT scan to address the objective (Lassau et al., 2021). Salehi et al. has presented a review
on radiography image findings of different patients. This paper is basically a clinical study of
the affected area in the radiography slices contributing towards the severity of the disease
(Salehi, Abedi, Balakrishnan, & Gholamrezanezhad, 2020). Ahuja et al. have presented a deep
learning automated detection of COVID –19 from lungs CT scan slices. The methodology is
divided into three phases, i.e., data augmentation of the slices, COVID-19 detection performed
on those data augmented slices and abnormality localization on the CT scan slices (Ahuja,
Panigrahi, Dey, Rajinikanth, & Gandhi, 2021). Zhu et al. have presented the article which is a
joint prediction and time estimation of COVID-19 based on CT scan for developing severity
symptoms. The authors have used a classification and regression based technique to jointly
predict the disease progression and the conversion time. Hence ultimately contributing towards
saving lives who may develop severe symptoms of COVID-19 (Zhu et al., 2021). Down the
line, Lee et al. have formulated an article on chest CT scan based COVID Detection. Over here
they tried to address three main objectives such as, a simple to use classification model
validated across 13 diverse sites across the world, investigated on the generalizability in these
13 places and discussed the contribution of the participants outside of China on model
performance and tracked the disease scores of COVID positive patients by using the DCD
features over time (Lee et al., 2021). In view of the current COVID-19 second wave and
understanding the new variant of the same which is believed to be evading antibodies and also
not being detected in RT-PCR, the authors have proposed a complimentary testing procedure
to correctly identify the COVID-19 subjects. The authors have used the combination of
different medical vitals along with a CT scan image as our dataset. The authors have used a
transfer learning on a pre-trained convolutional neural network (CNN) as their first hypothesis,
the second hypothesis is based on a conventional machine learning based methodology which
takes the other medical vitals as its input feed. The two results are fused using a probabilistic
metric to accurately predict the presence of the disease. In this paper, as of the best of author’s
knowledge, they have reported for the first time the deployment of the entire architecture on
SBC platform which have been prototyped for validation and testing to be used in medical
facility.

METHODS
Pathological data-based machine learning model development
The pivot around which our proposed mathematical model revolves to give a predictive
response for detailed Detection and Diagnosis of COVID-19 is based on radiography image
viz-a-viz Computed Tomography (CT) scan. It would thus offer valuable information in the
screening process quickly. The technique would also act as an aid to the conventional PCR

                                                                                             18445
http://annalsofrscb.ro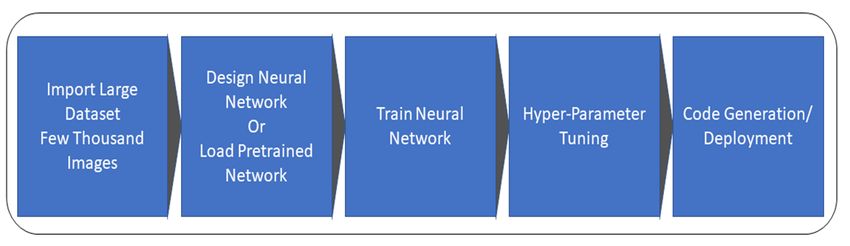
Annals of R.S.C.B., ISSN: 1583-6258, Vol. 25, Issue 4, 2021, Pages. 18444-18457
Received 05 March 2021; Accepted 01 April 2021

based method to isolate the contracted individuals quickly and an efficiently. The proposed
methodology involves a deep learning (DL) model in combination with a classical machine
learning (ML) Model in some processes to detect COVID-19, based on chest radiography, other
medical and pathological vitals like temperature, saturation percentage of oxygen (SpO2) and
leukocyte and lymphocyte counts.
The first evaluation starts with the collection of different medical vitals from body sensors like
temperature, saturation percentage of oxygen (SpO2) and using a classical machine learning
technique to predict an outcome. Our Deep Network Architecture (DNA) then acts on the CT
scan based analysis for a firmer classification.
The new normal trend in any commercial, housing complex, or even in hospital premises is to
screen the visitors by a thermal gun and making the person answer a list of questionnaires. The
process can help to identify some suspicious cases at the entry point. Our objective is to remove
the human factor out of the equation to reduce the manual error. We have used an AI-based
classification tool that we have trained on a huge data set from to classify the COVID from the
normal based on temperature and oxygen saturation percentage.
The data set contained age, gender, temperature and SpO2 as parameters for correct
classification of COVID individuals were trained using the Classification Learner App in
MATLAB® and the Model with the highest accuracy was automatically returned. The details
of the training model along with the different performance evaluation visualizations are given
below in Table 1. The ensemble method was tested separately for Bag, Ada Boost & RUS
Boost. The Number of Learners was tested from 10 to 500, the Learning Rate was varied as
0.001 to 1, the Number of Splits was tested from 1 to 560, and the Number of Predictors was
tested from 1 to 4. The Cost Matrix for Misclassification was fixed as Default and PCA was
disabled. The Final Model obtained is returned as given above.

      Table 1. Pathological data-based machine learning model development parameters

 MODEL:                  OPTIMIZABLE OPTIMIZED                                    OPTIMIZER
 ENSEMBLE                              HYPERPARAMETERS                            OPTIONS
                                       Ensemble                                   Bayesian
 Learner Type            Decision Tree            Bag
                                       Method                                     Optimization
                                       Maximum
                                                                                  Training
 Accuracy                82%           No      of 556                                          300 S
                                                                                  Time
                                       Splits
 Total
                                                No       of                                    30
 Misclassification       104                                58                    Iterations
                                                Learners
 Cost
                         ~790                   No        of
 Prediction Speed                                                                 Training
                         observations/sec       Predictor    4                                 TRUE
                                                                                  Time
 Training Time           312.59 sec             Samples

Body vitals data based machine learning model development
The second step starts with another secondary hypothesis using another machine learning tool
to study the complete blood count (CBC) Data from routine examination of blood. The data set
contained age, gender, Leukocyte, Lymphocyte & Neutrophil count as parameters for correct
classification of COVID individuals, was trained using the Classification Learner App® in
                                                                                                    18446
http://annalsofrscb.ro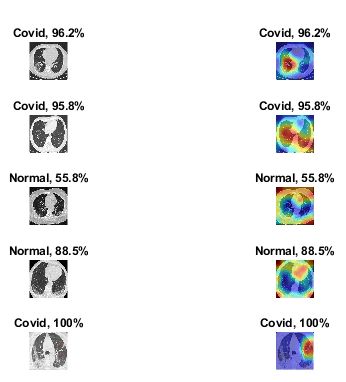
Annals of R.S.C.B., ISSN: 1583-6258, Vol. 25, Issue 4, 2021, Pages. 18444-18457
Received 05 March 2021; Accepted 01 April 2021

MATLAB® and the model with the highest accuracy was automatically returned. The details
of the training model along with the different performance evaluation visualizations are
provided in the following Table 2. The Optimizable Tree method was tested separately for
Gini’s Diversity Index, Twoing Rule and maximum deviance reduction to get the best split
criterion method. The number of splits was tested from 1 to 560. The Cost matrix for
misclassification was kept as default and PCA was disabled. The Final Model obtained was
returned as given above.

               Table 2. Body vitals data based machine learning model parameters

 MODEL: OPTIMIZABLE TREE                       OPTIMIZED                          OPTIMIZER
                                               HYPERPARAMETERS                    OPTIONS
 Surrogate decision                            Maximum                            Bayesian
                    OFF                                     73
 splits                                        No of Splits                       Optimization
                                                                                  Training
 Accuracy                82%                                                                 300 S
                                                                                  Time
 Total
                                                                  Max                          30
 Misclassification       101                                                      Iterations
                                               Split              deviance
 Cost
                                                                  reduction
                         ~17000
 Prediction Speed                                                                 Training
                         observations/sec                                                      TRUE
                                                                                  Time
 Training Time           58.164 sec

HRCT scan based detection
The CT Scan based detection technique by virtue of a more informative imaging technique
would enable the AI based model to draw more indicative inferences. The technique is a highly
popular one when a detailed information for a region is required for a more corrective
diagnosis. In a remarkably similar manner our screening phase-III would be a confirmatory
diagnostic approach for a COVID-19 detected individual. Following the same philosophy for
radiography assisted technique we have deployed pre-trained Convolutional Neural Network
(CNN) to perform a transfer learning to correctly recognise the affected individuals.
For the CT scan assisted diagnostic process as well, we have employed an AI enabled method
which is hence powered by a powerful Multi-Layer Convolutional Neural Network, also known
as Deep Neural Network in short. There are many pre-trained networks that are available, but
we have chosen the one which has been successfully used in the field of Medical Imaging and
related works (Hassan, Ali, Alquhayz, & Safdar, 2020). The Deep Network used by us is
RESNET-50 (Rezende, Ruppert, Carvalho, Ramos, & De Geus, 2017). we have restricted our
classification problem to a Binary Class Problem only, i.e. COVID & NORMAL. The other
important aspect of this paper emphasizes the power of a combined hypothesis, based on the
pathological study as explained above, and AI-enabled radiography assisted technique for
COVID detection. The objective of this part is to distinguish between “COVID”, and
“NORMAL” subjects based on radiography images using this model. Furthermore, the authors
have tried to classify the different stages of “COVID” based on the CT scan images. The
RESNET-50 is a multi-layer Direct Acyclic Graph (DAG) Network, pre-trained to perform
1000 Image Classifications, and has been previously trained on millions of images. The concept
of Transfer Learning helps to re-use a pre-trained network as per our requirements by replacing
the final few layers. The next important step is to tune the network to achieve the optimum
most performance. The above steps are performed to obtain the most optimum model, to be

                                                                                                    18447
http://annalsofrscb.ro
Annals of R.S.C.B., ISSN: 1583-6258, Vol. 25, Issue 4, 2021, Pages. 18444-18457
Received 05 March 2021; Accepted 01 April 2021
used for classification. The Basic Steps that we have employed to see the Pre-trained Model &
perform Transfer Learning on the same to achieve our objectives is given in Figure 1.
Figure 1. Basic Workflow Diagram for Convolutional Neural Network (CNN) Based Deep
Learning Model for Radiographic Image for COVID-19 Identification
In respect to the above symptoms, we can explain the lung condition in the mentioned manner.
The metric used to determine the correct stage are Ground Glass Opacity (GGO) & Lung
Consolidation. GGO is a hazy increased opacity in lung parenchyma without the obscuration
of the underlying vessels. At the initial stage, the virus invades the alveolar epithelium, and
replicates in the epithelial cells, causing the alveolar cavity to leak, and the alveolar wall or the
alveolar space to become inflamed or thickened (W. Yang et al., 2020; Yoon et al., 2020). The
consolidation is the increased lung opacification with the obscuration of the underlying vessels.
As inflammation progresses, the body reacts and a strong inflammatory reaction that results in
large exudation in the alveoli (Guan et al., 2020). The airspace opacities like ground-glass
opacities and consolidations are the most frequent findings in COVID, often bilateral peripheral
distribution particularly at the lower zone (Ludvigsson, 2020; Rodrigues et al., 2020). The
central parenchymal abnormalities, pleural involvement is rare (3%) (Holshue et al., 2020).
The severity score is based on the involvement of bilateral bronchopulmonary segments (R.
Yang et al., 2020). The 18 segments of both lungs were divided into 20 regions. Each of the
segment involvement carries scores of 0, 1, and 2 if parenchymal opacification involved 0%,
less than 50%, or equal or more than 50% of each region. The optimal score of 19.5 is identified
as severe COVID-19 with 83.3% sensitivity and 94% specificity.
Decision Fusion Algorithm
Any decision fusion algorithm plays a crucial role in the multi-hypotheses situation and hence
can be seamlessly used in clinical diagnostic procedures as well. The concept of multi-
hypotheses will act as a valuable second opinion to doctors and hence will be an enabler for
any diagnostic-based approach.
To elaborate the first of the two sub diagnostic measures in our screening processes is based
on pathological data of subjects
In the second screening step, we have proposed the idea of combining the conventional
radiography-based classification to help the doctors to identify any presence of strain more
correctly with an annotated stage.
Since we have created a dual pool hypothesis scenario from two different algorithms hence,
we are proposing an algorithm "Whoever Scores Most" in terms of a probabilistic metric to
correctly recognize the affected subject concerned in decision conflict scenarios. Our algorithm
finally scans through the sets of inferences and finally returns the output of the class which has
a higher probability score. The equation of our methodology is described below:
18448
http://annalsofrscb.roAnnals of R.S.C.B., ISSN: 1583-6258, Vol. 25, Issue 4, 2021, Pages. 18444-18457
Received 05 March 2021; Accepted 01 April 2021
C1 represents the output class predicted by the machine learning algorithm for pathological
data.
S1 represents the probability score for class C1
C2 represents the output class predicted by the deep learning model for radiographic images
S2 represents the probability score for output class C2
Let say X represents the single output given, two different output from different algorithms.
X= arg max (S1, S2); for all output classes.
IoT enabled Deploybility
To make this composite system available to the diagnostic facilities, the authors have used the
concept of the internet of things (IoT), a technology extremely popular in telemediation.
Internet of Things (IoT) has been a trusted friend of various medical facilities ever since its
inception. The concept of telemedicine or remote patient monitoring system has evolved in
many ways with the use of IoT based devices. The authors have used the concept of IoT to
complement our AI-based patient diagnostic system to increase reliability and performance.
The Intel® Movidius™ Neural Compute Stick (NCS) is a new piece of hardware used for
enhancing the inference process of computer vision models on low-powered edge devices. The
Intel Movidius™ product is a USB appliance that can be plugged into any device such as
laptops, Raspberry Pi, or even tablets. We have deployed our trained models into the Intel
Movidius™ Neural Compute Stick for a classification of COVID affected subjects. The power
of the device lies in running parallel ML models, hence useful in the multi-hypothesis scenario.
The device is chosen by the authors for its popularity in different medical imaging activities by
other peer groups.
Our models were initially designed and trained on a capable host machine (a development
computer in our case). Then one of the supported Application Programming Interface (API)
was used to profile, tune, and compile to convert the model to the format supported by the VPU
hardware. With the newly formatted model, the model was validated, and the working
prototype was generated on the same host machine. The hardware is physically connected to
the machine and was accessed using available methods in the API. The development process
using NCS is explained in Figure 2
Figure 2. The development process of the NCS is presented in the workflow diagram
The philosophy of the software architecture to be used for deployment is described in Figure
3.
18449
http://annalsofrscb.roAnnals of R.S.C.B., ISSN: 1583-6258, Vol. 25, Issue 4, 2021, Pages. 18444-18457
Received 05 March 2021; Accepted 01 April 2021
Figure 3. The philosophy of the AI Software Architecture to be used for deployment
The steps followed for inference on the edge are explained in Figure 4.
Figure 4. The setting up the server to test a COVID-19 Positive or Normal sample
The basic steps for drawing inference from the deployed models are as follows-
The server needs to be set to start up on the localhost. In our case, it is the ‘UP Squared
Device’.‘UP Squared Device’ is a piece of hardware from intel with which the NCS is
connected.
A set of encryptions was performed on the same to secure the files or folders from
access to the outside world
The set of collected radiography images from the different subject or single individual
was uploaded to the UP Squared for using it for the server.
The models running on the Intel® Movidius™ stick can be used for drawing inference
on the set of Radiography Images.
It was observed that using the Intel® Movidius™ product on a ‘UP Squared device’,
there is no difference in classification accuracy to the development machine; which in my case
was a Windows 10 Home with Intel Core™ i3 6006U with only a slight difference in the time
the classification process took to complete. The platform was marginally faster than my
computer.
The authors have proposed a network architecture for making the medical facility an IoT
enabled unit. The same is being proposed for faster detection and isolation of COVID-19
subjects. The network architecture is prototyped by an IoT enabled alarm system using a
NVIDIA Xavier CUDA, Raspberry Pi device and NVIDIA Jetson Nano. The NVIDIA Xavier
CUDA, Raspberry Pi device and NVIDIA Jetson Nano is virtually connected with the server
so that for any COVID-19 positive subject, the server can trigger specific actions on the IoT
18450
http://annalsofrscb.roAnnals of R.S.C.B., ISSN: 1583-6258, Vol. 25, Issue 4, 2021, Pages. 18444-18457
Received 05 March 2021; Accepted 01 April 2021
network for communicating with the device. The performance and computation time of
different devices are observed. The results that are captured from the classification of images
in the server are sent to the Raspberry Pi device where the actions like turning on a red LED
and a buzzer when COVID-19 is detected and turn on a blue LED when the classification
results when “Normal” being detected have been programmed and activated. This is an
amazingly simple Proof of Concept (POC) which shows a possibility of its powerful
applications that can save time for medical staff and could help save lives through early and
accurate detection.
RESULTS AND DISCUSSIONS
The different performance evaluation criteria were used to validate our mathematical model
based on pathological data and body vitals is given in Figure 5. The evaluation parameters have
been given in Table 3
Table 3: Confusion matrix table for different machine learning models
Pathological data-based machine learning Body vitals data-based machine learning
model model
Evaluation Score Evaluation Score
Parameter Parameter
Sensitivity 90.71% Sensitivity 91.19%
Specificity 58.87% Specificity 62.097%
The area under the 0.82 The area under the 0.77
curve (AUC) of ROC curve (AUC) of ROC
Misclassification 0.165 Misclassification 0.18
Error Error
From Table 3, the authors have deduced that the two main factors that play a pivotal role in
selecting the correct model are sensitivity & specificity. In simple terms and as an explanation
for the above observations the authors find that “COVID” (target class) detected as “COVID”
(output class) defines the sensitivity. It is observed that the sensitivity test for “COVID” has a
higher accuracy return. Moreover, since the overall accuracy of an AI-based system is built
around the true positives & false negatives count hence, the authors may observe that the entire
model was made to cater to the same. The basic step that the authors have employed for the
implementation of the AI-based radiography assisted technique is the concept of transfer
learning. The concept is useful when the output classes do not match the classes in the pre-
trained model. It also helps in the reduction of training time and does not require the model to
be developed from scratch.
The authors have used the K-fold cross validation concept (Fushiki, 2011), to reduce our
misclassification error (Kuha, Skinner, & Palmgren, 2014) and increase the model accuracy in
return. The K-fold validation shuffles the training set randomly & iteratively and deploys K
different algorithms to automatically return 5 models which can individually be evaluated on
some performance criteria to obtain the best out of the lot. We have chosen the value of K as
‘5’ in our case. The best validated model on the training data was returned whose confusion
matrix and receiver operating characteristics (ROC) (Streiner & Cairney, 2007) curve further
justified its selection for the purpose of HRCT scan assisted diagnostic approach.
18451
http://annalsofrscb.roAnnals of R.S.C.B., ISSN: 1583-6258, Vol. 25, Issue 4, 2021, Pages. 18444-18457
Received 05 March 2021; Accepted 01 April 2021
Figure 5. (a) Receiver Operating Characteristics Plot of Machine Learning Model on
Pathological Data (b) Misclassification Error Plot of Machine Learning Model on
Pathological Data
Hence in our case we find that deep network model for K-fold validation exhibits higher
accuracy in terms of detecting COVID for the test set in particular. The other two important
factors which help us to know the right model are false negatives & false positives. The area
under the curve (AUC) is the best (0.9623) for the 5th k-fold model as was returned by our
algorithm. Since accuracy is proportional to AUC hence the 5th K-fold model wins the race.
RESNET-5 deep network has outperformed the other models in terms of overall accuracy
(87.4%). The sensitivity rate (96%) is also higher in case of RESNET-5. The false negative
rate (4%) is also within acceptable limits. The only drawback of the model lies in the number
of false positives & hence the specificity as well. A little compromise on this point is still
acceptable since the true objective of the model is met. In line with this the precision rate is
hence considered to be under reasonable limits around 80.7%. The confusion matrix and AUC
are given Figure 6.
Figure 6. (a) Receiver Operating Characteristics Plot of Machine Learning Model on Body
Vitals (b) Misclassification Error Plot of Machine Learning Model on Body Vitals
18452
http://annalsofrscb.roAnnals of R.S.C.B., ISSN: 1583-6258, Vol. 25, Issue 4, 2021, Pages. 18444-18457
Received 05 March 2021; Accepted 01 April 2021
Similarly, the immediate next objective was to choose the correct K-fold Validation model
(Fushiki, 2011) from the 5 Models as returned by our proposed methodology. The comparison
table for the selection of the right model based on a performance evaluation metric is given
below in Table 4.
Table 4: Comparison between 5 different k folds of RESNET 50
Different K Fold RESNET 50 Evaluation Parameter Scores in %
Models
K = 1 type Sensitivity 62.7
Specificity 81.8
Precision 88.9
Accuracy 68.5
K = 2 type Sensitivity 74.5
Specificity 77.3
Precision 88.4
Accuracy 75.3
K = 3 type Sensitivity 70.6
Specificity 63.6
Precision 81.8
Accuracy 68.5
K = 4 type Sensitivity 68.6
Specificity 63.6
Precision 81.4
Accuracy 67.1
K = 5 type Sensitivity 74.5
Specificity 81.8
Precision 90.5
Accuracy 76.7
RESNET-5 deep network has outperformed the other models in terms of overall accuracy
(76.7%). The sensitivity rate (74.5%) is also higher in case of RESNET-5. The false negative
rate (20.5%) is also within acceptable limits. The only drawback of the model lies in the
number of false positives & hence the specificity as well. A little compromise on this point is
still acceptable since the true objective of the model is met. In line with this the precision rate
is hence considered to be under reasonable limits around 90.5%.The performance of the Model
is Further validated by another indicative visualization known as the Class Activation Mapping
(CAM) (Selvaraju et al., 2017). This method can help us to understand the reason behind a
classification in terms of a gradient map or score. In our case the red coloured zones enabled
the model to classify the image under any class. Some Sample observations on Images along
with the CAM zones is given in the following Figure 7.
18453
http://annalsofrscb.roAnnals of R.S.C.B., ISSN: 1583-6258, Vol. 25, Issue 4, 2021, Pages. 18444-18457
Received 05 March 2021; Accepted 01 April 2021
Figure 7. Classification Activation Mapping (CAM): Annotated Results to Show Affected
Lung Area
The Figure 8 elucidates the learning time complexity in different SBC platforms. The NVIDIA
Xavier CUDA platform provides reduced computational and time complexity when compared
with the Raspberry pi 4-8GB module and NVIDIA Jetson Nano.
Figure 8. The learning time complexity in different SBC platforms Area
18454
http://annalsofrscb.roAnnals of R.S.C.B., ISSN: 1583-6258, Vol. 25, Issue 4, 2021, Pages. 18444-18457
Received 05 March 2021; Accepted 01 April 2021
CONCLUSION
The solution pipeline as discussed is a more composite and robust one since it includes a three-
step screening process. Our algorithm would be developed into a software as part of our future
work and would hence act as an aid to the health practitioners & other medical staff and provide
a valuable second opinion in the existing diagnostic process. Our algorithm is not intended to
replace the more acceptable PCR Process but act like an aid to the same. In addition to being
an aid, it is also a highly cost-effective Solution for the prediction of COVID-19 cases. The
false negatives as explained is expected to be reduced by using a series of secondary hypotheses
using other machine learning algorithms. The PCR-test is specific, but has a lower sensitivity,
which means that the test can be negative even when the patient is infected. Another problem
is, that you have to wait for the test results, which can take more than 24 hours, while CT results
are available right away. Common laboratory findings in COVID-19 are a decreased
lymphocyte count and an increased CRP and high-sensitivity C-reactive protein level. Our
proposed methodology may help to accelerate the testing process and hence increase the
number of testing cases conducted per day with efficient Identification and Isolation process.
It may also help in centres not having the PCR facilities as well. The model was trained and
validated on data available from different sites. The same is tested and validated in different
SBC like Raspberry Pi 4, NVIDIA Jetson Nano and Xavier boards and their performances are
compared. Hence the authors provided a IoT enabled solution for testing of COVID-19 affected
patients in a deployable format.
Acknowledgement
The authors acknowledge Department of Radiology and Imaging, North Eastern Indira Gandhi
Regional Institute of Health and Medical Sciences, Shillong, Meghalaya, India for supporting
us with Data for large scale clinical validation. The authors also acknowledge The Neotia
University and Adamas University for providing excellent research infrastructure and for
necessary funding.
REFERENCES
[1] Afzal, A. (2020). Molecular diagnostic technologies for COVID-19: Limitations and
challenges. Journal of advanced research.
[2] Ahuja, S., Panigrahi, B. K., Dey, N., Rajinikanth, V., & Gandhi, T. K. (2021). Deep
transfer learning-based automated detection of COVID-19 from lung CT scan slices.
Applied Intelligence, 51(1), 571-585.
[3] Chakraborty, I., & Maity, P. (2020). COVID-19 outbreak: Migration, effects on society,
global environment and prevention. Science of the Total Environment, 728, 138882.
[4] Ebadi, A., Xi, P., Tremblay, S., Spencer, B., Pall, R., & Wong, A. (2021). Understanding
the temporal evolution of COVID-19 research through machine learning and natural
language processing. Scientometrics, 126(1), 725-739.
[5] Farahani, B., Firouzi, F., & Chakrabarty, K. (2020). Healthcare iot. In Intelligent Internet
of Things (pp. 515-545): Springer.
[6] Fauci, A. S., Lane, H. C., & Redfield, R. R. (2020). Covid-19—navigating the uncharted.
In: Mass Medical Soc.
[7] Fushiki, T. (2011). Estimation of prediction error by using K-fold cross-validation.
Statistics and Computing, 21(2), 137-146.
[8] Guan, W.-j., Ni, Z.-y., Hu, Y., Liang, W.-h., Ou, C.-q., He, J.-x., . . . Hui, D. S. (2020).
Clinical characteristics of coronavirus disease 2019 in China. New England journal of
medicine, 382(18), 1708-1720.
18455
http://annalsofrscb.roAnnals of R.S.C.B., ISSN: 1583-6258, Vol. 25, Issue 4, 2021, Pages. 18444-18457
Received 05 March 2021; Accepted 01 April 2021
[9] Gubala, V., Harris, L. F., Ricco, A. J., Tan, M. X., & Williams, D. E. (2012). Point of
care diagnostics: status and future. Analytical chemistry, 84(2), 487-515.
[10] Hassan, M., Ali, S., Alquhayz, H., & Safdar, K. (2020). Developing intelligent medical
image modality classification system using deep transfer learning and LDA. Scientific
reports, 10(1), 1-14.
[11] Holshue, M. L., DeBolt, C., Lindquist, S., Lofy, K. H., Wiesman, J., Bruce, H., . . . Tural,
A. (2020). First case of 2019 novel coronavirus in the United States. New England journal
of medicine.
[12] Kuha, J., Skinner, C., & Palmgren, J. (2014). Misclassification error. Wiley StatsRef:
Statistics Reference Online.
[13] Lassau, N., Ammari, S., Chouzenoux, E., Gortais, H., Herent, P., Devilder, M., . . .
Lamarque, J.-P. (2021). Integrating deep learning CT-scan model, biological and clinical
variables to predict severity of COVID-19 patients. Nature communications, 12(1), 1-11.
[14] Lee, E. H., Zheng, J., Colak, E., Mohammadzadeh, M., Houshmand, G., Bevins, N., . . .
Kim, J.-K. (2021). Deep COVID DeteCT: an international experience on COVID-19 lung
detection and prognosis using chest CT. NPJ digital medicine, 4(1), 1-11.
[15] Ludvigsson, J. F. (2020). Systematic review of COVID‐19 in children shows milder cases
and a better prognosis than adults. Acta paediatrica, 109(6), 1088-1095.
[16] Rezende, E., Ruppert, G., Carvalho, T., Ramos, F., & De Geus, P. (2017). Malicious
software classification using transfer learning of resnet-50 deep neural network. Paper
presented at the 2017 16th IEEE International Conference on Machine Learning and
Applications (ICMLA).
[17] Rodrigues, J., Hare, S., Edey, A., Devaraj, A., Jacob, J., Johnstone, A., . . . Robinson, G.
(2020). An update on COVID-19 for the radiologist-A British society of Thoracic
Imaging statement. Clinical radiology, 75(5), 323-325.
[18] Runkler, T. A. (2020). Data Visualization. In Data Analytics (pp. 37-59): Springer.
[19] Salehi, S., Abedi, A., Balakrishnan, S., & Gholamrezanezhad, A. (2020). Coronavirus
disease 2019 (COVID-19): a systematic review of imaging findings in 919 patients.
American Journal of Roentgenology, 215(1), 87-93.
[20] Selvaraju, R. R., Cogswell, M., Das, A., Vedantam, R., Parikh, D., & Batra, D. (2017).
Grad-cam: Visual explanations from deep networks via gradient-based localization.
Paper presented at the Proceedings of the IEEE international conference on computer
vision.
[21] Sonune, S., Kalbande, D., Yeole, A., & Oak, S. (2017). Issues in IoT healthcare
platforms: A critical study and review. Paper presented at the 2017 International
Conference on Intelligent Computing and Control (I2C2).
[22] Streiner, D. L., & Cairney, J. (2007). What's under the ROC? An introduction to receiver
operating characteristics curves. The Canadian Journal of Psychiatry, 52(2), 121-128.
[23] Yang, R., Li, X., Liu, H., Zhen, Y., Zhang, X., Xiong, Q., . . . Zeng, W. (2020). Chest CT
severity score: an imaging tool for assessing severe COVID-19. Radiology:
Cardiothoracic Imaging, 2(2), e200047.
[24] Yang, W., Cao, Q., Qin, L., Wang, X., Cheng, Z., Pan, A., . . . Qu, J. (2020). Clinical
characteristics and imaging manifestations of the 2019 novel coronavirus disease
(COVID-19): a multi-center study in Wenzhou city, Zhejiang, China. Journal of
Infection, 80(4), 388-393.
[25] Yoon, S. H., Lee, K. H., Kim, J. Y., Lee, Y. K., Ko, H., Kim, K. H., . . . Kim, Y.-H.
(2020). Chest radiographic and CT findings of the 2019 novel coronavirus disease
(COVID-19): analysis of nine patients treated in Korea. Korean journal of radiology,
21(4), 494.
18456
http://annalsofrscb.roAnnals of R.S.C.B., ISSN: 1583-6258, Vol. 25, Issue 4, 2021, Pages. 18444-18457
Received 05 March 2021; Accepted 01 April 2021
[26] Yuehong, Y., Zeng, Y., Chen, X., & Fan, Y. (2016). The internet of things in healthcare:
An overview. Journal of Industrial Information Integration, 1, 3-13.
[27] Zhu, X., Song, B., Shi, F., Chen, Y., Hu, R., Gan, J., . . . Gao, Y. (2021). Joint prediction
and time estimation of COVID-19 developing severe symptoms using chest CT scan.
Medical image analysis, 67, 101824.
18457
http://annalsofrscb.roYou can also read